Author Affiliations
1Institute of Geographic Sciences and Natural Resources Research, CAS, Beijing 100101, China2University of Chinese Academy of Sciences, Beijing 100049, China3School of Earth Science and Resource, Chang'an University, Xi'an 710000, Chinashow less
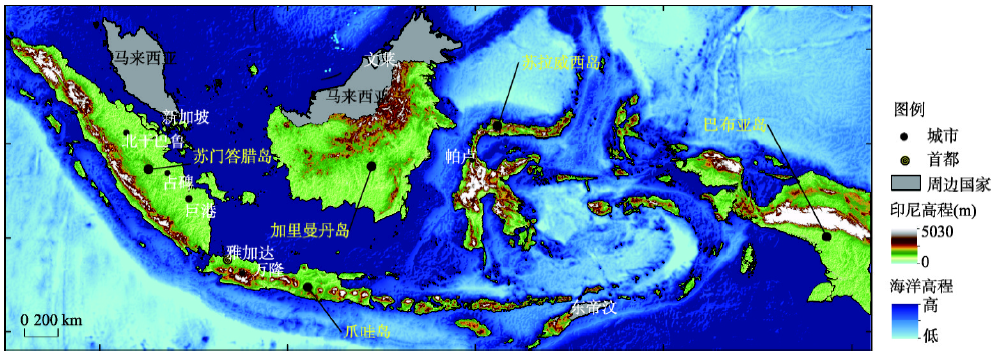
Fig. 1. Map showing the study area (Indonesia) and topographical features of the land (i.e., islands) and surrounding sea area
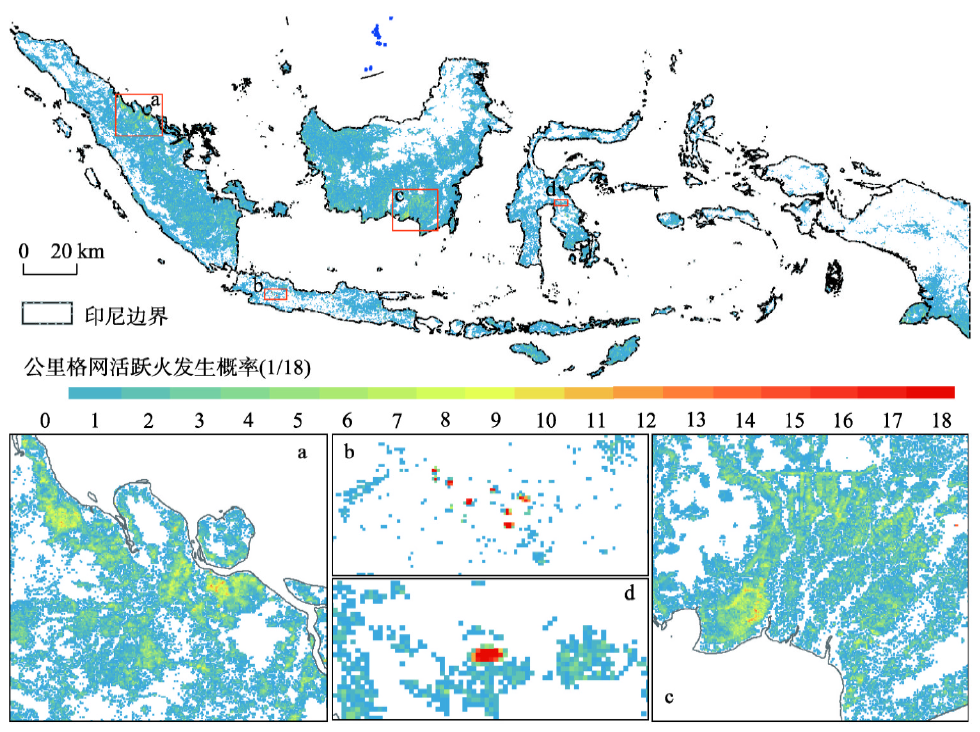
Fig. 2. Spatial distribution of the cumulated occurrence probability of MODIS C6 active fire in Indonesia during 2001-2018
Fig. 3. The differences in the occurrence probability of MODIS (2001-2018) active fires in Indonesia (a), Kalimantan (b), Sumatra(c), Papua (d), Sulawesi (e) and Java (f)
Fig. 4. The differences in the occurrence probability of active fires based on MODIS (2001-2018) in the five major islands (Kalimantan, Sumatra, Papua, Sulawesi and Java) of Indonesia
Fig. 5. Monthly occurrence probability of MODIS active fires in Indonesia during 2001-2018
Fig. 6. Spatial distribution of the occurrence intensity of MODIS C6 active fire in Indonesia during 2001-2018
Fig. 7. The difference in the proportions of the occurrence intensity of MODIS C6 active fires in Indonesia during 2001-2018
Fig. 8. The differences in the occurrence intensity of active fires based on MODIS C6 (2001-2018) under the three levels of occurrence probability in Indonesia
Fig. 9. Annual changes in the proportions of the active fire between August and October in Indonesia and its five major islands
月份 | 12—2 | 1—3 | 2—4 | 3—5 | 4—6 | 5—7 | 6—8 | 7—9 | 8—10 | 9—11 | 10—12 | 11—1 |
---|
2000 | -1.7 | -1.4 | -1.1 | -0.8 | -0.7 | -0.6 | -0.6 | -0.5 | -0.5 | -0.6 | -0.7 | -0.7 | 2001 | -0.7 | -0.5 | -0.4 | -0.3 | -0.3 | -0.1 | -0.1 | -0.1 | -0.2 | -0.3 | -0.3 | -0.3 | 2002 | -0.1 | 0 | 0.1 | 0.2 | 0.4 | 0.7 | 0.8 | 0.9 | 1.0 | 1.2 | 1.3 | 1.1 | 2003 | 0.9 | 0.6 | 0.4 | 0 | -0.3 | -0.2 | 0.1 | 0.2 | 0.3 | 0.3 | 0.4 | 0.4 | 2004 | 0.4 | 0.3 | 0.2 | 0.2 | 0.2 | 0.3 | 0.5 | 0.6 | 0.7 | 0.7 | 0.7 | 0.7 | 2005 | 0.6 | 0.6 | 0.4 | 0.4 | 0.3 | 0.1 | -0.1 | -0.1 | -0.1 | -0.3 | -0.6 | -0.8 | 2006 | -0.8 | -0.7 | -0.5 | -0.3 | 0 | 0 | 0.1 | 0.3 | 0.5 | 0.7 | 0.9 | 0.9 | 2007 | 0.7 | 0.3 | 0 | -0.2 | -0.3 | -0.4 | -0.5 | -0.8 | -1.1 | -1.4 | -1.5 | -1.6 | 2008 | -1.6 | -1.4 | -1.2 | -0.9 | -0.8 | -0.5 | -0.4 | -0.3 | -0.3 | -0.4 | -0.6 | -0.7 | 2009 | -0.8 | -0.7 | -0.5 | -0.2 | 0.1 | 0.4 | 0.5 | 0.5 | 0.7 | 1.0 | 1.3 | 1.6 | 2010 | 1.5 | 1.3 | 0.9 | 0.4 | -0.1 | -0.6 | -1.0 | -1.4 | -1.6 | -1.7 | -1.7 | -1.6 | 2011 | -1.4 | -1.1 | -0.8 | -0.6 | -0.5 | -0.4 | -0.5 | -0.7 | -0.9 | -1.1 | -1.1 | -1.0 | 2012 | -0.8 | -0.6 | -0.5 | -0.4 | -0.2 | 0.1 | 0.3 | 0.3 | 0.3 | 0.2 | 0 | -0.2 | 2013 | -0.4 | -0.3 | -0.2 | -0.2 | -0.3 | -0.3 | -0.4 | -0.4 | -0.3 | -0.2 | -0.2 | -0.3 | 2014 | -0.4 | -0.4 | -0.2 | 0.1 | 0.3 | 0.2 | 0.1 | 0 | 0.2 | 0.4 | 0.6 | 0.7 | 2015 | 0.6 | 0.6 | 0.6 | 0.8 | 1.0 | 1.2 | 1.5 | 1.8 | 2.1 | 2.4 | 2.5 | 2.6 | 2016 | 2.5 | 2.2 | 1.7 | 1.0 | 0.5 | 0 | -0.3 | -0.6 | -0.7 | -0.7 | -0.7 | -0.6 | 2017 | -0.3 | -0.1 | 0.1 | 0.3 | 0.4 | 0.4 | 0.2 | -0.1 | -0.4 | -0.7 | -0.9 | -1.0 | 2018 | -0.9 | -0.8 | -0.6 | -0.4 | -0.1 | 0.1 | 0.1 | 0.2 | 0.4 | 0.7 | 0.9 | 0.8 |
|
Table 1. Global Oceanic Niño Index (ONI) since 2000
分组 | 发生概率 |
---|
低概率组 | 1/18 | 2/18 | 3/18 | 4/18 | 5/18 | 6/18 | 中概率组 | 7/18 | 8/18 | 9/18 | 10/18 | 11/18 | 12/18 | 高概率组 | 13/18 | 14/18 | 15/18 | 16/18 | 17/18 | 18/18 |
|
Table 2. The classification criteria of occurrence probability of active fire
级别 | 强度范围(次/a) | 对应格网数量范围 |
---|
1级 | 1 | 337816 | 2级 | 2~3 | 72230~17785 | 3级 | 4~7 | 7709~1269 | 4级 | 8~12 | 811~141 | 5级 | 13~22 | 97~13 | 6级 | 23~165 | 6~1 |
|
Table 3. The classification criteria of occurrence intensities of active fire
级别 | 强度范围(次/a) | 有火区及在各岛占比(%) |
---|
有火区 | 苏门答腊岛 | 加里曼丹岛 | 巴布亚岛 | 苏拉威西岛 | 爪哇岛 |
---|
1级 | 1 | 75.88 | 70.48 | 74.35 | 81.76 | 85.57 | 89.59 | 2级 | 2~3 | 20.22 | 23.59 | 21.61 | 16.74 | 13.61 | 9.35 | 3级 | 4~7 | 3.38 | 5.06 | 3.59 | 1.28 | 0.68 | 0.70 | 4级 | 8~12 | 0.43 | 0.74 | 0.38 | 0.16 | 0.09 | 0.12 | 5级 | 13~22 | 0.08 | 0.12 | 0.07 | 0.06 | 0.02 | 0.15 | 6级 | 23~165 | 0.01 | 0.01 | 0.00 | 0 | 0.03 | 0.09 |
|
Table 4. The proportions of MODIS active fires under varied occurrence intensities in Indonesian "fire-affected areas" and its five major islands during 2001-2018
多年平均占比 | 苏门答腊岛 | 加里曼丹岛 | 巴布亚岛 | 苏拉威西岛 | 爪哇岛 | 全境 |
---|
所有年份 | 49.04 | 81.73 | 64.87 | 59.58 | 55.75 | 64.37 | 正常年份 | 43.47 | 80.01 | 69.04 | 55.78 | 57.93 | 61.03 | 厄尔尼诺特征年 | 63.14 | 90.29 | 71.63 | 71.38 | 61.28 | 77.78 | 厄尔尼诺非特征年 | 43.92 | 76.78 | 48.71 | 50.25 | 44.65 | 56.04 |
|
Table 5. The average proportions of the active fire that happened between August and October in Indonesia and its five major islands