
Kangliang Lu, Jun Xue, Chongben Tao. Multi target tracking based on spatial mask prediction and point cloud projection[J]. Opto-Electronic Engineering, 2022, 49(9): 220024
- Opto-Electronic Engineering
- Vol. 49, Issue 9, 220024 (2022)
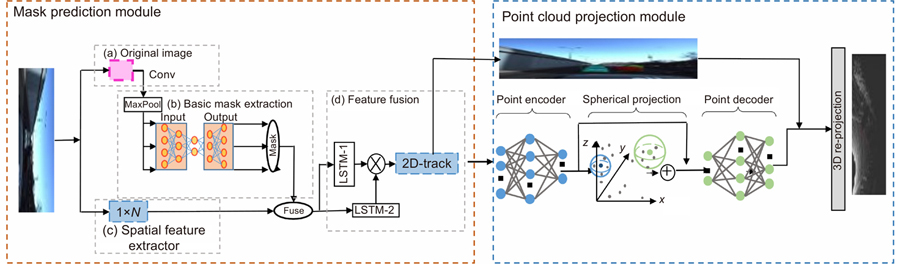
Fig. 1. Algorithm frame diagram
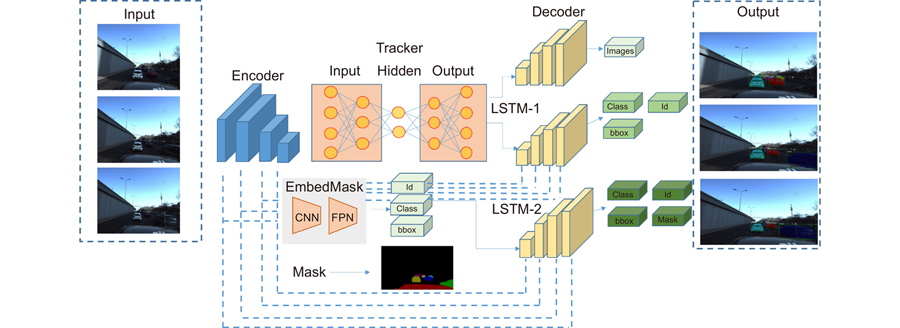
Fig. 2. Mask prediction module
Fig. 3. Prediction module
Fig. 4. Point cloud projection
Fig. 5. Calibration board effect
Fig. 6. Mask projection
Fig. 7. Input sequence RGB and mask data into the model. (a) Original sequence RGB data; (b) Corresponding sequence mask data
Fig. 8. Loss function curve. (a) Four definitions of loss; (b) Total algorithm loss
Fig. 9. PR curve comparison
Fig. 10. The accuracy of the three algorithms for different distance, occlusion, luminosity and ambiguity
Fig. 11. Performance of multiple target tracking algorithms on MOT
Fig. 12. Effect of Apollo dataset test
Fig. 13. Effect of KITTI dataset test
Fig. 14. Effect of BDD100K dataset test
Fig. 15. Effect of point cloud projection
Fig. 16. Experimental platform
Fig. 17. Effect of actual road experiment
|
Table 1. This algorithm is compared with other algorithms
|
Table 2. Performance index


Set citation alerts for the article
Please enter your email address

© Copyright 2018-2021 | Chinese Laser Press. All Rights Reserved 沪ICP备15018463号-20