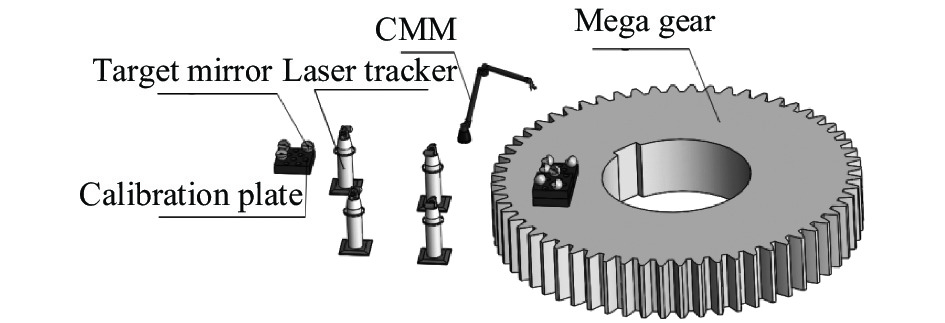
Fig. 1. Combined measuring network of mega gear
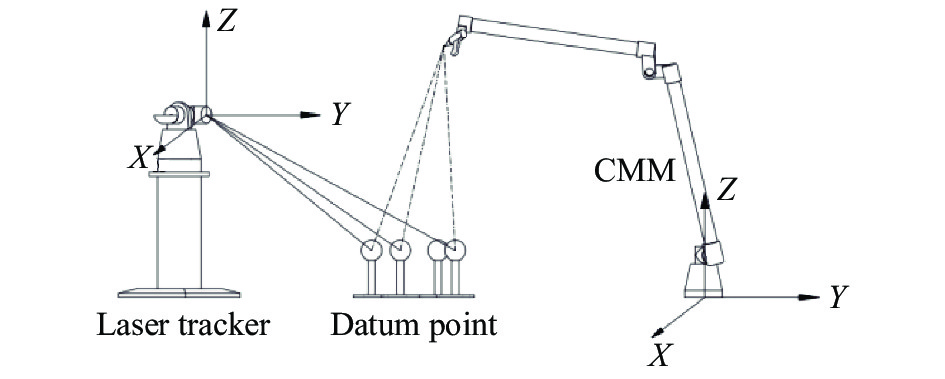
Fig. 2. Schematic diagram of coordinate transformation principle
Fig. 3. Schematic diagram of measuring the center of the target mirror
Fig. 4. Schematic diagram of measurement of redundancy technology
Fig. 5. Calibration model of laser tracker position parameters
Fig. 6. Calibration plate diagram
Fig. 7. Selected measuring instrument
Fig. 8. Histogram of parameter calibration error of laser tracker
Fig. 9. Line chart of measurement error
Fig. 10. [in Chinese]
Fig. 10. Line chart of measurement error
Position | Group 1 | Group 2 | Group 3 | Group 4 | P2
| X | Standard value | 278.293 | 350.237 | 408.318 | 465.041 | Measured value | 278.294 | 350.237 | 408.319 | 465.040 | Y | Standard value | 19.608 | 91.833 | 86.587 | 181.150 | Measured value | 19.609 | 91.832 | 86.587 | 181.149 | P3
| X | Standard value | 108.947 | 211.714 | 144.500 | 201.476 | Measured value | 108.947 | 211.714 | 144.499 | 201.476 | Y | Standard value | 207.212 | 259.048 | 256.227 | 443.156 | Measured value | 207.212 | 259.048 | 256.227 | 443.156 | P4
| X | Standard value | 297.151 | 517.629 | 502.104 | 706.057 | Measured value | 297.151 | 517.629 | 502.103 | 706.056 | Y | Standard value | 192.448 | 388.820 | 305.389 | 710.938 | Measured value | 192.448 | 388.820 | 305.390 | 710.939 |
|
Table 1. Coordinate values of different stations of laser tracker (Unit: mm)
Direction | Group 1 | Group 2 | Group 3 | Group 4 | X | 0.001 | 0.005 | 0.005 | 0.012 | Y | 0.001 | 0.007 | 0.011 | 0.014 |
|
Table 2. Average value of parameter calibration error (Unit: mm)
Group | Error value | Group | Error value | Group | Error value | Group | Error value | Group | Error value | 1 | 0.012 | 10 | −0.003 | 19 | 0.014 | 28 | −0.004 | 37 | 0.009 | 2 | −0.014 | 11 | 0.002 | 20 | 0.008 | 29 | 0.015 | 38 | 0.009 | 3 | −0.005 | 12 | −0.004 | 21 | −0.005 | 30 | 0.005 | 39 | 0.010 | 4 | −0.007 | 13 | −0.003 | 22 | 0.007 | 31 | 0.006 | 40 | 0.004 | 5 | 0.003 | 14 | 0.008 | 23 | 0.003 | 32 | −0.002 | 41 | 0.007 | 6 | 0.008 | 15 | −0.002 | 24 | −0.001 | 33 | −0.004 | 42 | −0.011 | 7 | −0.013 | 16 | 0.005 | 25 | 0.004 | 34 | −0.003 | 43 | 0.013 | 8 | 0.008 | 17 | 0.005 | 26 | −0.007 | 35 | 0.014 | 44 | −0.014 | 9 | 0.008 | 18 | 0.012 | 27 | 0.008 | 36 | −0.005 | 45 | 0.013 |
|
Table 3. Measurement error of block gauge length measured by combined measuring network(Unit: mm)
Group | Error value | Group | Error value | Group | Error value | Group | Error value | Group | Error value | 1 | 0.081 | 10 | −0.058 | 19 | 0.078 | 28 | −0.031 | 37 | 0.029 | 2 | −0.075 | 11 | −0.010 | 20 | 0.029 | 29 | 0.062 | 38 | 0.030 | 3 | −0.055 | 12 | −0.028 | 21 | −0.047 | 30 | 0.017 | 39 | 0.042 | 4 | −0.036 | 13 | −0.092 | 22 | 0.047 | 31 | 0.017 | 40 | −0.011 | 5 | −0.056 | 14 | 0.021 | 23 | 0.043 | 32 | −0.015 | 41 | −0.008 | 6 | 0.025 | 15 | 0.003 | 24 | −0.039 | 33 | −0.025 | 42 | −0.094 | 7 | −0.069 | 16 | 0.049 | 25 | −0.060 | 34 | −0.031 | 43 | −0102 | 8 | −0.006 | 17 | −0.067 | 26 | 0.007 | 35 | 0.053 | 44 | −0.144 | 9 | 0.022 | 18 | 0.041 | 27 | 0.022 | 36 | −0.040 | 45 | −0.091 |
|
Table 4. Measurement error of the block gauge length measured directly by laser tracker(Unit: mm)
Position | Optimized | | Direct | Avg. | Std. | Avg. | Std. | P1
| 0.007 | 0.004 | | 0.044 | 0.028 | P2
| 0.005 | 0.003 | 0.027 | 0.020 | P3
| 0.007 | 0.004 | 0.036 | 0.023 | P4
| 0.007 | 0.004 | 0.044 | 0.031 | P5
| 0.007 | 0.005 | 0.049 | 0.037 |
|
Table 5. Analysis table of measurement error results(Unit: mm)