• Photonics Research
  • Vol. 9, Issue 7, 1172 (2021)
Angika Bulbul* and Joseph Rosen
Author Affiliations
  • School of Electrical and Computer Engineering, Ben-Gurion University of the Negev, Beer-Sheva 8410501, Israel
  • show less
    DOI: 10.1364/PRJ.422381 Cite this Article Set citation alerts
    Angika Bulbul, Joseph Rosen. Super-resolution imaging by optical incoherent synthetic aperture with one channel at a time[J]. Photonics Research, 2021, 9(7): 1172 Copy Citation Text show less
    Scheme of the COACH system used as a platform for OCTISAI.
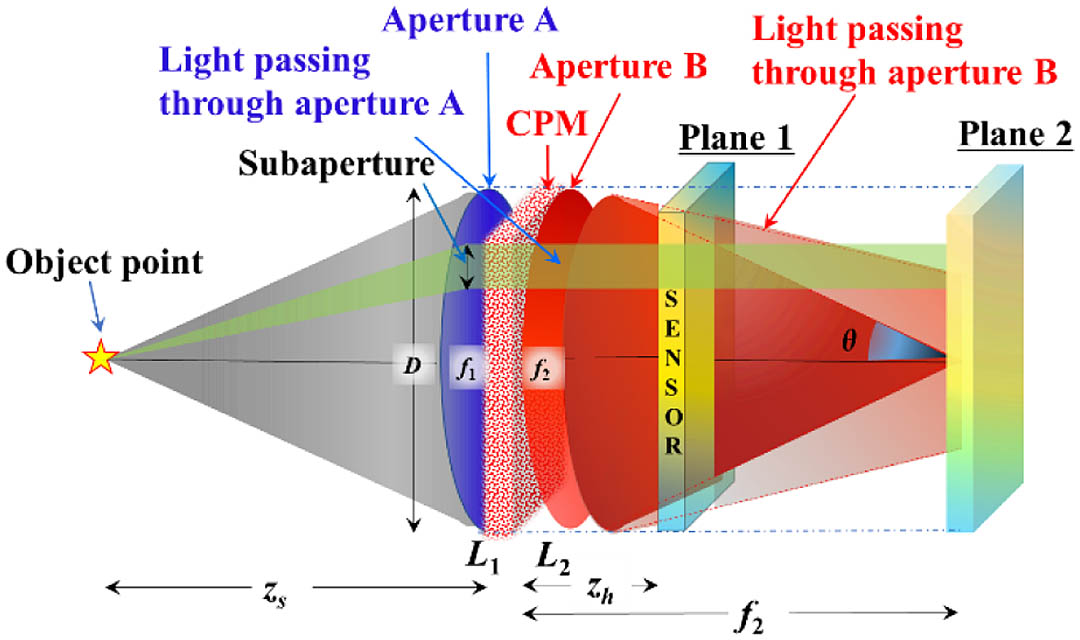
    Fig. 1. Scheme of the COACH system used as a platform for OCTISAI.
    Laboratory setup of OCTISAI. CPM, coded phase mask; L0 and L1, refractive lenses; QPM, quadratic phase mask; P1 and P2, polarizers.
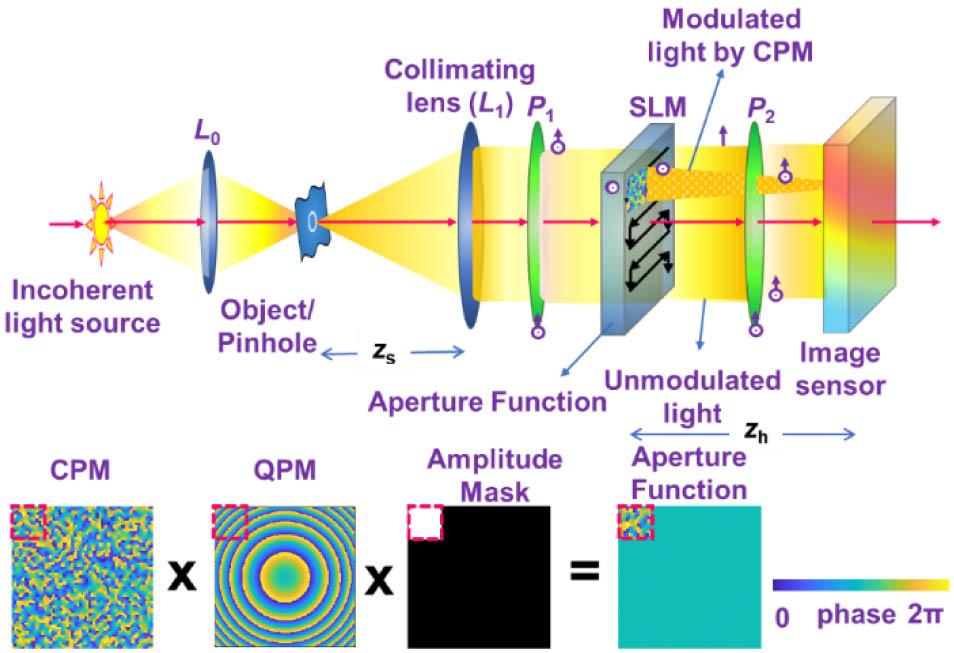
    Fig. 2. Laboratory setup of OCTISAI. CPM, coded phase mask; L0 and L1, refractive lenses; QPM, quadratic phase mask; P1 and P2, polarizers.
    Schematic of the GSA for synthesizing a set of CPMs.
    Fig. 3. Schematic of the GSA for synthesizing a set of CPMs.
    Modulation transfer functions (MTFs) plotted for different aperture sizes, different SLM-sensor gaps, and various imaging systems. MTF profile of (a) square aperture of (D/8)×(D/8) COACH with zh/f2=0.4, (b) synthetic aperture (SA) with zh/f2=0.4, (c) SA with zh/f2=0.5, (d) limited aperture of (D/8)×(D/8) direct imaging with zh=f2, (e) full aperture of D×D COACH with zh=f2, and (f) full aperture of D×D direct imaging with zh=f2; the semitransparent contour shows the MTF of the coherent direct imaging system with D×D aperture and zh=f2. zh is the distance between the imaging aperture and an optical sensor.
    Fig. 4. Modulation transfer functions (MTFs) plotted for different aperture sizes, different SLM-sensor gaps, and various imaging systems. MTF profile of (a) square aperture of (D/8)×(D/8) COACH with zh/f2=0.4, (b) synthetic aperture (SA) with zh/f2=0.4, (c) SA with zh/f2=0.5, (d) limited aperture of (D/8)×(D/8) direct imaging with zh=f2, (e) full aperture of D×D COACH with zh=f2, and (f) full aperture of D×D direct imaging with zh=f2; the semitransparent contour shows the MTF of the coherent direct imaging system with D×D aperture and zh=f2. zh is the distance between the imaging aperture and an optical sensor.
    Scheme of OCTISAI for calculating the system bandwidth.
    Fig. 5. Scheme of OCTISAI for calculating the system bandwidth.
    Tabletop experimental setup for OCTISAI with far-field illuminated objects and components assembled inside the blue rectangle to execute the operation of OCTISAI. BS1 and BS2, beam splitters; CMOS camera, complementary metal-oxide-semiconductor camera; L01, L02, and L1, refractive lenses; LED1 and LED2, identical light-emitting diodes; P1 and P2, polarizers; SLM, spatial light modulator; and USAF, United States Air Force resolution target.
    Fig. 6. Tabletop experimental setup for OCTISAI with far-field illuminated objects and components assembled inside the blue rectangle to execute the operation of OCTISAI. BS1 and BS2, beam splitters; CMOS camera, complementary metal-oxide-semiconductor camera; L01, L02, and L1, refractive lenses; LED1 and LED2, identical light-emitting diodes; P1 and P2, polarizers; SLM, spatial light modulator; and USAF, United States Air Force resolution target.
    Holograms of limited aperture of 135×135 pixels: (a1)–(a3) point spread holograms (PSHs) and (c1)–(c3) object holograms, (b1) magnitude and (b2) phase of the final PSH, (d1) magnitude and (d2) phase of the final object hologram; full aperture holograms: (e1)–(e3) PSHs and (g1)–(g3) object holograms, (f1) magnitude and (f2) phase of the final PSH, (h1) magnitude and (h2) phase of the final object hologram; limited aperture images: (i) COACH and (j) direct imaging; full aperture images: (k) COACH and (l) direct imaging. The subscripts 1, 2, and 3 represent holograms recorded for phase values 0, 2π/3, and 4π/3, respectively.
    Fig. 7. Holograms of limited aperture of 135×135  pixels: (a1)–(a3) point spread holograms (PSHs) and (c1)–(c3) object holograms, (b1) magnitude and (b2) phase of the final PSH, (d1) magnitude and (d2) phase of the final object hologram; full aperture holograms: (e1)–(e3) PSHs and (g1)–(g3) object holograms, (f1) magnitude and (f2) phase of the final PSH, (h1) magnitude and (h2) phase of the final object hologram; limited aperture images: (i) COACH and (j) direct imaging; full aperture images: (k) COACH and (l) direct imaging. The subscripts 1, 2, and 3 represent holograms recorded for phase values 0, 2π/3, and 4π/3, respectively.
    OCTISAI: (a) magnitude and (b) phase of the complete mosaic of the PSH, (c) magnitude and (d) phase of the object holograms, obtained from 64 limited apertures; reconstructed images after stitching of (e) eight central horizontal holograms, (f) eight central vertical holograms, (g) 2×2 central holograms, (h) 4×4 central holograms, (i) 6×6 central holograms, and (j) full 64 holograms; (k) MSE of OCTISAI reconstructed images versus the number of subapertures.
    Fig. 8. OCTISAI: (a) magnitude and (b) phase of the complete mosaic of the PSH, (c) magnitude and (d) phase of the object holograms, obtained from 64 limited apertures; reconstructed images after stitching of (e) eight central horizontal holograms, (f) eight central vertical holograms, (g) 2×2 central holograms, (h) 4×4 central holograms, (i) 6×6 central holograms, and (j) full 64 holograms; (k) MSE of OCTISAI reconstructed images versus the number of subapertures.
    COACH, OCTISAI, and DI images with visibility curve at the bottom for (a) limited aperture COACH with zh=f2/2.5, (b) synthetic aperture (SA) with zh=f2/2.5, (c) SA with zh=f2/2, (d) limited aperture direct imaging with zh=f2, (e) full aperture COACH with zh=f2, and (f) full aperture direct imaging with zh=f2; f2=25 cm.
    Fig. 9. COACH, OCTISAI, and DI images with visibility curve at the bottom for (a) limited aperture COACH with zh=f2/2.5, (b) synthetic aperture (SA) with zh=f2/2.5, (c) SA with zh=f2/2, (d) limited aperture direct imaging with zh=f2, (e) full aperture COACH with zh=f2, and (f) full aperture direct imaging with zh=f2; f2=25  cm.
    (a1)–(a8) Phase maps of coded phase masks (CPMs) and (b1)–(b8) the respective reconstructed images by OCTISAI, while implementing SA with scattering degrees, σ, from 0.046 to 0.648; (c) SNR and visibility plots versus σ for (b1)–(b8).
    Fig. 10. (a1)–(a8) Phase maps of coded phase masks (CPMs) and (b1)–(b8) the respective reconstructed images by OCTISAI, while implementing SA with scattering degrees, σ, from 0.046 to 0.648; (c) SNR and visibility plots versus σ for (b1)–(b8).
    Angika Bulbul, Joseph Rosen. Super-resolution imaging by optical incoherent synthetic aperture with one channel at a time[J]. Photonics Research, 2021, 9(7): 1172
    Download Citation