• Photonics Research
  • Vol. 9, Issue 7, 1172 (2021)
Angika Bulbul* and Joseph Rosen
Author Affiliations
  • School of Electrical and Computer Engineering, Ben-Gurion University of the Negev, Beer-Sheva 8410501, Israel
  • show less
    DOI: 10.1364/PRJ.422381 Cite this Article Set citation alerts
    Angika Bulbul, Joseph Rosen. Super-resolution imaging by optical incoherent synthetic aperture with one channel at a time[J]. Photonics Research, 2021, 9(7): 1172 Copy Citation Text show less

    Abstract

    Imaging with an optical incoherent synthetic aperture (SA) means that the incoherent light from observed objects is processed over time from various points of view to obtain a resolution equivalent to single-shot imaging by the SA larger than the actual physical aperture. The operation of such systems has always been based on two-wave interference where the beams propagate through two separate channels. This limitation of two channels at a time is removed in the present study with the proposed SA where the two beams pass through the same single channel at any given time. The system is based on a newly developed self-interference technique named coded aperture correlation holography. At any given time, the recorded intensity is obtained from interference between two waves co-propagating through the same physical channel. One wave oriented in a particular polarization is modulated by a pseudorandom coded phase mask and the other one oriented orthogonally passes through an open subaperture. Both subapertures are multiplexed at the same physical window. The system is calibrated by a point spread hologram synthesized from the responses of a guide star. All the measurements are digitally processed to achieve a final image with a resolution higher than that obtained by the limited physical aperture. This unique configuration can offer alternatives for the current cumbersome systems composed of far apart optical channels in the large optical astronomical interferometers. Furthermore, the proposed concept paves the way to an SA system with a single less-expensive compact light collector in an incoherent optical regime that may be utilized for future ground-based or space telescopes.

    1. INTRODUCTION

    The history of optical incoherent synthetic aperture (SA) starts with the seminal work of Michelson and Pease published in 1921 [1]. Since then, the entire astronomical interferometers in the radio and optical spectral regimes provide high-resolution images of astronomical objects using incoherent SA imaging [25]. All these astronomical interferometers measure a statistical correlation between two electromagnetic signals that originated in the object after they pass through two telescopes spaced apart. Therefore, all these interferometers operate with two signals propagating through two separate channels at any given time. In the radio regime, this is a less serious problem than in optics, since the radio signals, phase, and amplitude, are recorded in each radio antenna and transferred electronically to the point of the cross correlation. However, in the optical regime, the phase of the signal cannot be recorded by an electrical detector directly without interfering with a wave from another telescope. Hence, two optical signals should be transferred by waveguides from the two far-apart telescopes to the interference laboratory, where the optical path difference between the two channels should be of the order of micrometers for typical optical sources. Therefore, the optical astronomical interferometers are relatively cumbersome devices with a baseline (the maximal gap between two telescopes) limited to a few hundred meters. The only exception to the case of two-wave interference is the intensity interferometer proposed by Hanbury Brown and Twiss [6], in which the intensities, rather than the complex amplitudes, from the two telescopes, are cross correlated. However, only the target size estimation, rather than its image, can be obtained by intensity interferometers and the use of these interferometers has been discontinued since the sixties due to a relatively low signal-to-noise ratio (SNR).

    Fortunately, the statistical correlation is not the only option to produce optical incoherent SA. The appearance of Fresnel incoherent correlation holography (FINCH) in 2007 [7,8] has opened up new opportunities for incoherent SA imaging. FINCH is a technique to record holograms of objects emitting incoherent light. The holograms can be recorded because the light from each object point is split by the recording system into two waves. These two waves are modulated differently on their way to the camera on which these waves interfere as a hologram. As early as 2010 [9], it was suggested, instead of recording a hologram at once, to record it part by part over time. Such a process is SA imaging by definition. However, this FINCH-based optical incoherent SA was not optimal, in the sense of relatively low image resolution. When the SA was implemented on an optimal configuration of FINCH [1012], the various parts of the hologram were obtained by interference of two waves from two far-apart subapertures. In other words, even when the SA imaging is done using a different physical effect than the traditional statistical correlation, the problem of processing simultaneously through two far-apart channels still exists.

    The next milestones in the history of the optical incoherent SA were the invention of three related imaging systems: coded aperture correlation holography (COACH) [13], then interferenceless-COACH (I-COACH) [14], and finally partial imaging system (PAIS) [15]. COACH is a generalization of FINCH in the sense that COACH is also a self-interference method to record incoherent holograms, but the aperture for one of the waves is a chaotic phase mask instead of the quadratic phase mask of FINCH. I-COACH, on the other hand, is a degenerate version of the self-interference COACH to an interferenceless system. PAIS, the third milestone, operates exactly like I-COACH but with a partial aperture in the shape of an annular aperture [15]. In 2018, the I-COACH-based SA was implemented on PAIS by a system called synthetic marginal aperture with revolving telescopes (SMART) [16]. In SMART, the interference intensities of the entire subaperture pairs along the aperture ring are accumulated over time. Once again, the high-resolution image can be achieved if, and only if, the system works in the mode of two far-apart channels at a time, due to the necessity of recording a wave interference from two far-apart subapertures. When the same rule of operating with two channels simultaneously exists in three different systems, each of which is based on a different physical effect, the rule may be suspected as a basic principle of nature that cannot be circumvented. However, as the title of this study suggests, fortunately, this rule can be violated.

    To make this overview more complete, we mention few coherent SA systems, although optical coherent imaging systems with SA are less relevant for imaging astronomical sources. In general, SA with coherent light inherently does not suffer from the problem of operating with two channels simultaneously. In the case of coherent imaging systems, the light source illuminating the targets is usually a laser, controlled by the user [1724]. In that case, SA is composed of a set of holograms [1722], in which the laser light is split to reference and object beams, where only the object beam illuminates the target. The reflected beam from the target interferes with the reference beam to record each subhologram from the set that composes the complete SA. Since only the object beam is reflected from the target and processed by the optical system, the object beam is the only single channel at any given time. Therefore, coherent SA inherently belongs to the type of single channel at a time. Even the coherent SA without wave interference proposed in Refs. [23,24] operates through a single channel. Through this single channel, the intensity along three axial locations is recorded, and by a phase retrieval algorithm, the phase distribution on the SA is computed [23]. In other words, the problem of two-channel at a time is unique to incoherent SA and in the following, we propose a solution to this problem.

    In this study, we propose and demonstrate a one-channel-at-a-time incoherent synthetic aperture imager (OCTISAI) operating in the optical regime of the spectrum. OCTISAI is an incoherent SA imager based on a recently developed self-interference holography technique of COACH [13]. As mentioned above, COACH is an incoherent digital holography method in which the recorded intensity patterns are obtained from the interference between two waves, both originated from the same point on the object. One of the waves is an unmodulated plane or spherical wave and the other is modulated by a scattering phase mask. In OCTISAI, a single moving subaperture contains both the modulating and the non-modulating subapertures multiplexed together. Because the entire waves propagate through the same subaperture on their way to the interference plane, only signals from one channel are processed at any given time. At the end of the computational processing (to be described in the following), the obtained stitched hologram contains more spatial frequencies of the object than there are in a single hologram obtained from a single subaperture. For the first time to the best of our knowledge, OCTISAI provides a solution to the century-old [1] problem of two-channel dependence of optical incoherent SA.

    OCTISAI should not be confused with other works in which the image resolution is improved using scattering masks. Although inserting a scatterer between observed objects and an imaging system can improve the image resolution, the system of Ref. [25] is limited to coherent light and there is no SA in Ref. [25] in the sense that there is no limited aperture that scans much larger aperture in time and space. On the other hand, OCTISAI is an incoherent interference-based SA imaging technique in the present study with an aperture area that is 1.56% of the SA area at any given time. Therefore, using scattering masks should not identify OCTISAI with other techniques such as imaging through a scatterer with a coherent illumination [26,27], learning-based imaging techniques [28,29], and techniques of interferenceless imaging through a scatterer [30].

    The paper consists of five sections and various subsections. In Section 2, the methodology comprising principle and mathematical model of OCTISAI is presented with a theoretical analysis. The experiment procedure is discussed in Section 3, followed by the experimental results. In the end, the conclusion and future scope of this study are summarized.

    2. METHODOLOGY

    OCTISAI is an SA imaging system implemented on the COACH platform [13], and therefore COACH is briefly discussed to clarify the principles of OCTISAI and to explain the resolution enhancement observed with synthetic aperture imaging mode. COACH shown in Fig. 1 is an incoherent self-interference imaging system in which the light from the object is assumed to be quasi-monochromatic and spatially incoherent. Two different apertures A and B are multiplexed in the system, such that every wave arriving from each object point is split into two mutually coherent waves, each of which passes through a different aperture. Aperture A is an open aperture of a diameter of D which creates a plane wave (indicated by light green color in Fig. 1) from every object point, assuming the focal length f1 is equal to the distance zs. The other aperture, B, is a composite of a scattering coded phase mask (CPM) with a spherical lens L2 (indicated by red colors in Fig. 1). Aperture B projects a chaotic pattern on the image sensor for every object point, where the size of the chaotic pattern can be controlled by determining the CPM degree of scattering. In the absence of the CPM, each object point is imaged through the aperture B on the back focal plane of L2 (plane 2 in Fig. 1). Therefore, in the system of aperture B, the intensity on plane 2 is a magnitude square of a scaled Fourier transform of the CPM [31]. The two waves from the two apertures A and B are coherent to each other because they are originated from the same source point. Hence, for each object point, there is an interference pattern on the sensor, where the collection of these patterns for a different object point is recorded as a digital object hologram. In the calibration and imaging modes of the system, point spread holograms (PSHs) and an object hologram are recorded, respectively (sometimes with more than one exposure [32] for each). The final image is digitally reconstructed from cross correlation between the object hologram and the PSH. So far on the subject of COACH, and next we discuss the topic of OCTISAI.

    Scheme of the COACH system used as a platform for OCTISAI.

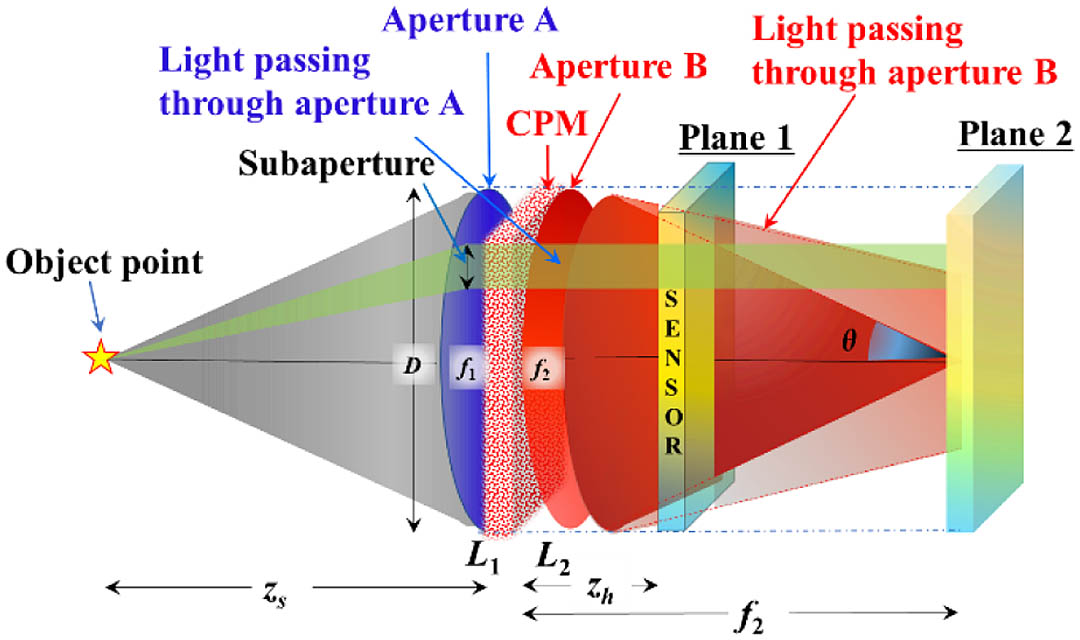
    Figure 1.Scheme of the COACH system used as a platform for OCTISAI.

    For the discussion about the SA with one channel at a time, let us consider a system composed of two multiplexed apertures at the same plane depicted in blue and red colors, and a single subaperture indicated by a semitransparent green color in Fig. 1. The goal is to record a subhologram through this subaperture, and at this point, one can see that there is some problem here. For the case where the sensor is at plane 2 if the CPM degree of scattering is too small the light of aperture B is concentrated near the center of plane 2. Consequently, there is no overlap between the plane wave of aperture A and the light of aperture B. Hence, there is no interference between the waves, and without two-wave interference, the recording is useless for SA imaging. On the other hand, if the chaotic pattern of aperture B covers all the area of the sensor at plane 2, the efficiency of the PSH is low, since the light from each subaperture of channel B scatters all over the sensor, whereas the plane wave from the same subaperture is collimated all the way to the sensor. The solution to this problem can be to move the sensor toward the aperture to plane 1. By doing that, however, the overall image resolution of the SA system is reduced. To show this, let us calculate the minimum resolved size of regular COACH [13] in the original state where the sensor is at plane 2 in Fig. 1. The minimum resolved size is equal to the size of the minimal spot that can be recorded on the sensor, projected back to the object plane, which is λ/[(tanθ)MT]=λ/[(D/2f2)(f2/zs)]=2λzs/D, where λ is the mean wavelength of the incoherent light source, MT=f2/zs is the transverse magnification of the system of the aperture B, and the entire other parameters are indicated in Fig. 1. When the sensor is at plane 1, on the other hand, the size of the minimal recorded spot remains the same, but the transverse magnification is reduced to MT=zh/zs. Therefore, the minimum resolved size is λ/[(tanθ)MT]=λ/[(D/2f2)(zh/zs)]=2λzsf2/(Dzh). It can be concluded that in order to design an efficient SA operating with one channel at a time, there is some penalty. In our case, there is less image resolution than can be achieved with a conventional SA system with two channels at a time [15,1012,16]. In a conventional SA system with N×N subapertures, where each can resolve the minimal size of S, the overall resolved minimal size is S/N. On the other hand, in OCTISAI, the overall minimal resolvable size is Δ=Sf2/(Nzh). However, as long as f2/zh<N, the minimal resolvable size of OCTISAI, Δ, is smaller than S, the minimal resolvable size of the physical system. Therefore, OCTISAI still improves the image resolution of the physical system, and this improvement is more efficient in the sense of using one channel at a time instead of two.

    A. Laboratory Model of OCTISAI

    The laboratory model of OCTISAI is presented in Fig. 2. A pinhole considered as a guide star is illuminated by an incoherent light source through lens L0. The spherical wave diffracted from the pinhole is collimated by lens L1 placed at a distance zs. To satisfy the far-field imaging condition, the setup is calibrated such that zs=f1, where f1 is the focal length of the lens L1, and hence a plane wave is obtained beyond L1. The multiplexing of two apertures discussed above is done by the polarization method [13], in which two orthogonal polarizations propagate through the same setup, but each one is modulated differently. The plane wave is incident on a phase-only spatial light modulator (SLM), where the light is polarized by polarizer P1 at 45° to the active axis of the SLM. Half of the polarized light is modulated by the phase mask displayed on the SLM and the other half, orthogonally oriented to the first half, continues as an unmodulated plane wave. Both beams are collected by the second polarizer, P2, also oriented at 45° to the active axis of the SLM. Since beyond P2 the two beams have the same polarization, and they are originated from the same point object, wave interference is recorded by the image sensor placed at a distance of zh from the SLM.

    Laboratory setup of OCTISAI. CPM, coded phase mask; L0 and L1, refractive lenses; QPM, quadratic phase mask; P1 and P2, polarizers.

    Figure 2.Laboratory setup of OCTISAI. CPM, coded phase mask; L0 and L1, refractive lenses; QPM, quadratic phase mask; P1 and P2, polarizers.

    To demonstrate the SA with M×N subapertures, at a given time tm,n (m=1,,M; n=1,,N), and at the (m,n)th location on the SLM, we display the (m,n)th part of the CPM composed with the corresponding part of the diffractive spherical lens with a focal length of f2 (f2>zh). The SA is implemented by a raster scanning of a single subaperture over all the SA matrix of M×N subapertures. After completing a full raster scanning, the separated parts of the intensity pattern are stitched together. The stitched pattern is actually an incoherent on-axis digital hologram. As in the COACH case [13], for both the PSH and the object hologram, and for every subaperture, we record three shots with three different phase values (φk=0, 2π/3, and 4π/3) in the CPM. The three recorded patterns are superposed such that the reconstructed image appears without the twin image and without the zero-diffraction order. Finally, the high-resolution image of the object is reconstructed by cross correlating the two stitched holograms, the object hologram, and the PSH.

    B. CPM Synthesis

    A set of pseudorandom sub-CPMs is created for OCTISAI from a single full-plane synthesized CPM. The scattering degree of the CPM, as discussed in the following, affects both the image resolution and the SNR of the system. The scattering degree is directly related to the spatial bandwidth of the CPM, and hence we need to synthesize the CPM with a method that can control the spatial bandwidth of the CPM. The Gerchberg–Saxton algorithm (GSA) [33] is such a method since the GSA can synthesize a CPM that its spatial spectrum has approximately a uniform magnitude over a predefined area. The scattering degree of the CPM is defined herein as the ratio between the actual and the maximal areas occupied by the spatial spectrum of the CPM. The GSA used to synthesize the CPM is schematically shown in Fig. 3, and it is based on the system of Fig. 1. The GSA is iteratively bounced from the CPM plane to the spectral domain (plane 2 in Fig. 1) and back by 2D Fourier and inverse Fourier transforms, respectively. The Fourier relations between the CPM plane and plane 2 are satisfied by positioning behind the CPM a diffractive lens of focal length f2. The central ux×uy pixels out of Ux×Uy pixels on the spectrum domain are constrained to be with constant intensity, where outside this area the algorithm enforces zero intensity. Consequently, the scattering degree of the CPM becomes σ=(ux×uy)/(Ux×Uy). Following the projection at the spectral domain, the complex function is inversely Fourier transformed to the CPM plane, in which the magnitude is constrained to be unity, as should be with phase-only CPM. After several iterations, a pseudorandom pure phase CPM is ready and is split into M×N equal subapertures, each of which is positioned at the (m,n)th cell on the SA matrix where zero phase is enforced outside the (m,n)th subaperture.

    Schematic of the GSA for synthesizing a set of CPMs.

    Figure 3.Schematic of the GSA for synthesizing a set of CPMs.

    C. Mathematical Analysis of Image Formation

    The mathematical analysis carried out herein is regarding the optical configuration shown in Fig. 2. We start the analysis by calculating the intensity response of the system to a point source in the input. Consider a point object positioned at (r¯s,zs)=(xs,ys,zs) with a complex amplitude Is. The light propagates from the source to the SLM through the lens L1 with a focal length of f1. Beyond the lens L1, the complex amplitude is given as IsC1L(r¯s/zs)Q(1/zs)Q(1/f1), where C1 is a complex constant, L(s¯)=exp[i2π(s¯·r¯)/λ] is a linear phase function, and Q(s)=exp(iπsr2/λ) is a quadratic phase function. Because the system is calibrated with a guide star, the location of the point source is not limited to be in the front focal plane of L1, as long as the guide star and the object are at the same plane. However, to make the analysis simpler we assume that zs=f1. A polarizer P1 in front of the SLM dictates the polarization of the beam to be 45° to the active axis of the SLM. Thus, there are two beams with orthogonal polarizations, where the horizontal polarization is modulated by the SLM and the vertical polarization continues as a plane unmodulated beam all the way to the sensor. At time tm,n a subaperture of the size lx×ly is displayed on the SLM, containing part of the CPM multiplied by a corresponding patch from the diffractive lens of focal length f2. Note that in this configuration, the size of the complete SA is M·lx·N·ly.

    Beyond the SLM, the unmodulated plane wave and the modulated wave pass through a polarizer P2 also oriented at 45° to the active axis of the SLM. Therefore, on the sensor placed at a distance zh (zh<f2) from the SLM, two mutually coherent equally polarized waves create an interference pattern. The interference intensity at the time tm,n is recorded by the image sensor, and upon completing the entire process along M×N subapertures, the obtained stitched hologram of a single point is Hk(r¯0;r¯s,zs=f1)=n=N2N2m=M2M2|IsC1L(r¯sf1)×{C2+C3exp[iΦm,n(xlxm,ylyn)]Q(1f2)exp(iφk)}×rect(xlxmlx,ylynly)*Q(1zh)|2,where r¯0=(x0,y0) and (x,y) are the transverse coordinates of the sensor and CPM planes, respectively. C2, C3 are constants of the plane and modulated waves, respectively, exp(iφk) is the phase constant involved in the phase shifting, where k=1,2,3, and exp[iΦm,n(x,y)] is a quasi-random phase mask of the (n,m)th subaperture from the complete CPM displayed on the SLM. The sign ‘*’ denotes a 2D convolution and the rect(x/α,y/β) function is defined as 1 for |x|α/2, |y|β/2, and 0 otherwise. It is assumed that the gap zh is short enough and the scattering degree is small enough, such that most of the light is not scattered outside the area of the size of lx×ly at the sensor plane. Only under this assumption, the hologram expression of Eq. (1) can be re-written with an exchange of the order of operations as follows: Hk(r¯0;r¯s)|IsC1L(r¯sf1)×n=N2N2m=M2M2{C2+C3exp[iΦm,n(xlxm,ylyn)]Q(1f2)exp(iφk)}×rect(xlxmlx,ylynly)*Q(1zh)|2=|IsC1L(r¯szs){C2+C3exp[iΦ(x,y)]Q(1f2)exp(iφk)}*Q(1zh)|2,where exp[iΦ(x,y)] is a function of the complete CPM obtained from the GSA. In Eq. (2), we also assume that area of the recorded interference on the sensor is not smaller than the used area of the SLM. Otherwise, the number of terms summed up in Eq. (2) is less than M×N. Equation (2) expresses the fact that the same hologram of Eq. (1) can be generated by the propagation of light through the complete CPM obtained by summation over the entire subapertures. In other words, the sum of intensities of the light propagating from the subapertures is equal to the intensity of the light propagating from the sum of subapertures. The intensity of the interference on the sensor is recorded under three different phase constants (φk=0, 2π/3, and 4π/3) in the CPM for every m and n value. The resulting complex-valued hologram HC of the point object, from the superposition of the three exposures, is HC(r¯0;r¯s)=H1(r¯0;r¯s)[exp(iφ3)exp(iφ2)]+H2(r¯0;r¯s)[exp(iφ1)exp(iφ3)]+H3(r¯0;r¯s)[exp(iφ2)exp(iφ1)]=IsC4[L(r¯szs)*Q(1zh)]*×{L(r¯szs)exp[iΦ(x,y)]Q(1f2)*Q(1zh)}=HPSH(r¯0zhzsr¯s),where C4 is constant and HPSH(r¯0)exp[iΦ(x,y)]×Q(1/f2)*Q(1/zh).

    After stitching a mosaic of M×N holograms to one complete PSH, the object hologram is recorded in the same procedure but instead of the point object, a multi-point object is located at the same input plane. A 2D object O(r¯s) is a collection of L uncorrelated points, each of which is located at r¯l and has intensity al as the following: O(r¯s)=lLalδ(r¯sr¯l),where δ(·) is the Dirac delta function. Since the system is linear and space-invariant, the intensity distribution on the sensor after stitching the subholograms is given by HOBJ,k=1,2,3(r¯0)=lalHk=1,2,3(r¯0zhzsr¯l).Following the phase-shifting procedure, the final object hologram is HOBJ(r¯0)=lalHPSH(r¯0zhzsr¯l).The final image is obtained after cross correlating HOBJ(r¯0) with the phase-only filter (POF) version of HPSH(r¯0). The POF is used to suppress the background noise [1416,32]. The cross correlation of the image reconstruction is IIMG(r¯r)=HOBJ(r¯0)H˜PSH*(r¯0r¯r)dr¯0=lalHPSH(r¯0zhzsr¯l)H˜PSH*(r¯0r¯r)dr¯0=lalΛ(r¯rzhzsr¯l)O(r¯sMT),where r¯r is the coordinate vector of the reconstruction plane and Λ is a delta-like function approximately equal to 1 at (0,0) and a negligible value elsewhere. Here H˜PSH*(r¯0)=F1{exp[i·arg(F{HPSH(r¯0)})]} is an inverse Fourier transform of the POF of the PSH, where F1 and F indicate inverse Fourier and Fourier transform, respectively. The PSH and the object hologram obtained at the end of the process of OCTISAI are identical to the same holograms obtained from the full aperture COACH with identical optical conditions.

    The width of the modulation transfer function (MTF) is the spatial bandwidth of the system related to the image resolution. Based on Eqs. (3) and (7), we conclude that the MTF of OCTISAI is M(ρ¯)=|F{HPSH(r¯0λzh)}|=|ν[λzh]F{exp[iΦ(x,y)]Q(1f2)*Q(1zh)}|,where ρ¯ is the coordinate vector of the spatial frequency domain and ν[a] is the scaling operator such that ν[a]f(x)=f(ax). Although the COACH is an incoherent imaging system, its MTF does not have the conus-like shape typical to incoherent direct imaging (DI) systems [31]. The MTFs calculated by computer simulation for various imaging systems are plotted in Figs. 4(a)–4(f), in comparison to the MTF of the coherent imaging system with the square aperture of D×D depicted by a semitransparent contour. The MTF of the COACH configuration is shown in Fig. 4(a) for a square aperture of (D/8)×(D/8) with zh/f2=0.4. The MTF of OCTISAI with an SA aperture of D×D with zh/f2=0.4 is shown in Fig. 4(b). Figure 4(c) is the MTF of OCTISAI with zh/f2=0.5 and Fig. 4(d) is the MTF of incoherent direct imaging with a subaperture of (D/8)×(D/8) square. The MTF of COACH with D×D square aperture and zh=f2 is shown in Fig. 4(e), and finally, the MTF of incoherent DI with a subaperture of D×D square is depicted in Fig. 4(f). Comparing COACH in Fig. 4(e) with DI of Fig. 4(f), the MTF of COACH spreads over a bandwidth that is half of the incoherent DI. Therefore, it is expected that the image resolution of COACH to be similar to coherent DI, which is about 70% of the resolving power of incoherent DI [8,13]. Because the bandwidth of OCTISAI with D×D square SA is reduced by a factor of zh/f2 compared to a coherent DI system with the same aperture size, the resolving power of OCTISAI is also weaker by the factor of zh/f2 compared to the coherent DI. On the other hand, comparing Figs. 4(a) and 4(d) with 4(b) and 4(c), the bandwidth of OCTISAI with N×N subapertures is wider by a factor of N than COACH and by a factor of N·zh/2f2 than incoherent DI, both with the aperture size of (D/N)×(D/N).

    Modulation transfer functions (MTFs) plotted for different aperture sizes, different SLM-sensor gaps, and various imaging systems. MTF profile of (a) square aperture of (D/8)×(D/8) COACH with zh/f2=0.4, (b) synthetic aperture (SA) with zh/f2=0.4, (c) SA with zh/f2=0.5, (d) limited aperture of (D/8)×(D/8) direct imaging with zh=f2, (e) full aperture of D×D COACH with zh=f2, and (f) full aperture of D×D direct imaging with zh=f2; the semitransparent contour shows the MTF of the coherent direct imaging system with D×D aperture and zh=f2. zh is the distance between the imaging aperture and an optical sensor.

    Figure 4.Modulation transfer functions (MTFs) plotted for different aperture sizes, different SLM-sensor gaps, and various imaging systems. MTF profile of (a) square aperture of (D/8)×(D/8) COACH with zh/f2=0.4, (b) synthetic aperture (SA) with zh/f2=0.4, (c) SA with zh/f2=0.5, (d) limited aperture of (D/8)×(D/8) direct imaging with zh=f2, (e) full aperture of D×D COACH with zh=f2, and (f) full aperture of D×D direct imaging with zh=f2; the semitransparent contour shows the MTF of the coherent direct imaging system with D×D aperture and zh=f2. zh is the distance between the imaging aperture and an optical sensor.

    Another way to calculate the width of the MTF of OCTISAI is by following the route of the three central diffraction orders diffracted from a grating displayed at the input of the system shown in Fig. 5. Recalling that the incoherent illumination can be modeled as a sum of plane waves from multiple different directions, we consider the three central diffraction orders diffracted from the grating by one of the plane waves. To image the grating, at least two orders, zeroth and one of the first orders, should be recorded into the hologram. The system cutoff frequency νc is related to the angle α between the zeroth and first orders through the relation νc=tan(α)/λ. The question regarding the scheme of Fig. 5 is the value of maximal α which guarantees that the interference between the zeroth and first orders will be recorded by a sensor on plane 1. Under the assumption of a small scattering degree (the CPM light is focused to a small area on plane 2), it is easy to see that the maximal α is obtained when the first order follows the marginal ray of the system and contributes the modulated wave (the red broken line focused in Fig. 5) to the two-wave interference. On the other hand, the zeroth order contributes the unmodulated plane wave to the same two-wave interference (red solid line in Fig. 5). Based on this geometry, and the relation tan(α)=Dzh/(2zsf2), we conclude that the overall width of the MTF of OCTISAI is B=2νc=Dzh/(λzsf2). In comparison to other imaging systems, the bandwidth of a single direct incoherent system with subaperture of the diameter of D/N (assuming M=N) is B=2D/(Nλzs). The bandwidth of OCTISAI is wider than B, as long as f2/zh<N/2. However, as mentioned above, there is a penalty for OCTISAI in a form of a narrower bandwidth compared to the two-channels-at-a-time SA system like SMART [16], for instance, in which the bandwidth is D/(λzs)>Dzh/(λzsf2).

    Scheme of OCTISAI for calculating the system bandwidth.

    Figure 5.Scheme of OCTISAI for calculating the system bandwidth.

    3. EXPERIMENT

    The experiments of OCTISAI were performed by a tabletop optical setup illustrated in Fig. 6. The setup was built with two illumination channels, incorporating the object [group 3, element 1, United States Air Force negative resolution target (USAF)] in one channel and a pinhole with a diameter of 25 μm in the other channel. Two identical light-emitting diodes (Thorlabs LED635L, 170 mW, λ=635  nm, and Δλ=15  nm) with two identical lenses denoted L01 and L02 were mounted in the channel-1 and channel-2, respectively, to critically illuminate the object and the point object in the respective channels. The light diffracted from these two channels propagated along a common path beyond the beam splitter BS1, but these optical channels did not operate simultaneously. Before the experiments of imaging the object, a set of PSHs was recorded by illuminating the pinhole for all positions of the space-limited subapertures on the SLM plane. Similarly, a set of object holograms was recorded in the same optical configuration by illuminating only the object. The light diffracted from the object was collimated by a biconvex lens L1 with a diameter 2.5 cm and a focal length of 20 cm, to achieve the far-field imaging condition. The collimated beam was polarized by an input polarizer P1 oriented at an angle of 45° with respect to the active axis of phase-only SLM (Holoeye PLUTO, 1920×1080  pixels, 8 μm pixel pitch, phase-only modulation). The SLM was mounted at a distance of 8 cm from the lens L1. The numerical aperture of the full synthetic aperture is 0.0216, calculated as the ratio between the radius of the full aperture (dictated by the SLM size) and the focal length of L1. SA was performed by displaying a subaperture of only 135×135  pixels out of 1080×1080  pixels (1.56% fill factor) containing a patch from the CPM and from a diffractive lens of 25 cm focal length. The entire patches of the CPM and the lens were displayed on the SLM in a raster-scan mode. From the SLM half of the beam was modulated by the CPM and another half propagated unmodulated due to the polarization induced by P1.

    Tabletop experimental setup for OCTISAI with far-field illuminated objects and components assembled inside the blue rectangle to execute the operation of OCTISAI. BS1 and BS2, beam splitters; CMOS camera, complementary metal-oxide-semiconductor camera; L01, L02, and L1, refractive lenses; LED1 and LED2, identical light-emitting diodes; P1 and P2, polarizers; SLM, spatial light modulator; and USAF, United States Air Force resolution target.

    Figure 6.Tabletop experimental setup for OCTISAI with far-field illuminated objects and components assembled inside the blue rectangle to execute the operation of OCTISAI. BS1 and BS2, beam splitters; CMOS camera, complementary metal-oxide-semiconductor camera; L01, L02, and L1, refractive lenses; LED1 and LED2, identical light-emitting diodes; P1 and P2, polarizers; SLM, spatial light modulator; and USAF, United States Air Force resolution target.

    To eliminate the bias and the twin image from the recoded hologram, the phase-shifting procedure was implemented. For that purpose, three CPMs were displayed one by one on the SLM each of which was multiplied with a different phase constant (φk=0, 2π/3, and 4π/3). The reflected beams from the SLM propagated through a second beam splitter BS2 and passed through an output polarizer P2 oriented at 45° to the SLM active axis. Having the same polarization, the modulated and the unmodulated waves interfered on a digital camera (Hamamatsu ORCA-Flash4.0 V2 Digital CMOS camera, 2048×2048  pixels, 6.5 μm pixel pitch, monochrome) located at 10 cm from the SLM. All recorded incoherent holograms from the SA scanning were digitally processed by a computer with specifications of 32 GB RAM and Intel processor i7-5930K, CPU at 3.50 GHz.

    4. RESULTS AND DISCUSSION

    The first experiment is a performance comparison between COACH and direct imaging. Two tested apertures are a central limited aperture of 135×135  pixels and a full aperture of 1080×1080  pixels. For COACH, all the PSHs, HPSH,k=1,2,3, with phase constants of φk=0, 2π/3, and 4π/3 are recorded by the camera placed at 10 cm from the SLM. The limited aperture COACH holograms are recorded for the point object 25 μm pinhole and the object of the USAF resolution chart, and all are displayed in Figs. 7(a1)–7(a3) and Figs. 7(c1)–7(c3), respectively. The complex-valued PSH, HPSH, and object hologram, HOBJ, are computed using Eq. (3), described in the methodology section. The magnitude and the phase of the complex PSH and the complex object hologram are shown in Figs. 7(b1), 7(b2) and Figs. 7(d1), 7(d2), respectively. Similarly, an experiment for full aperture COACH is performed and its PSHs and object holograms are depicted in Figs. 7(e1)–7(e3) and Figs. 7(g1)–7(g3), respectively. The magnitude and phase of the complex PSH and the complex object holograms are shown in Figs. 7(f1), 7(f2) and Figs. 7(h1), 7(h2), respectively. The images shown in Figs. 7(i) and 7(k) are reconstructed by cross correlating the object hologram with a phase-only filtered version of the PSH for the two respective apertures. Two DI results with the two apertures were captured in the absence of the CPM and only with a single diffractive lens of focal length f2=25  cm displayed on the SLM, where the sensor is positioned in the back focal plane of the diffractive lens. DI results with the limited and full apertures are shown in Figs. 7(j) and 7(l), respectively.

    Holograms of limited aperture of 135×135 pixels: (a1)–(a3) point spread holograms (PSHs) and (c1)–(c3) object holograms, (b1) magnitude and (b2) phase of the final PSH, (d1) magnitude and (d2) phase of the final object hologram; full aperture holograms: (e1)–(e3) PSHs and (g1)–(g3) object holograms, (f1) magnitude and (f2) phase of the final PSH, (h1) magnitude and (h2) phase of the final object hologram; limited aperture images: (i) COACH and (j) direct imaging; full aperture images: (k) COACH and (l) direct imaging. The subscripts 1, 2, and 3 represent holograms recorded for phase values 0, 2π/3, and 4π/3, respectively.

    Figure 7.Holograms of limited aperture of 135×135  pixels: (a1)–(a3) point spread holograms (PSHs) and (c1)–(c3) object holograms, (b1) magnitude and (b2) phase of the final PSH, (d1) magnitude and (d2) phase of the final object hologram; full aperture holograms: (e1)–(e3) PSHs and (g1)–(g3) object holograms, (f1) magnitude and (f2) phase of the final PSH, (h1) magnitude and (h2) phase of the final object hologram; limited aperture images: (i) COACH and (j) direct imaging; full aperture images: (k) COACH and (l) direct imaging. The subscripts 1, 2, and 3 represent holograms recorded for phase values 0, 2π/3, and 4π/3, respectively.

    Next, the experiment for OCTISAI is conducted with a CPM set of 8×8=64 sub-CPMs each of which with 135×135  pixels. Each sub-CPM of the set is displayed three times with three different phase constants. Each sub-CPM is displayed alone at any given time, at a different location on the SLM in raster scanning. For each sub-CPM, the three holograms for the object and for the point object are recorded and superposed to eliminate the twin image and the bias term. The 64 complex-valued subholograms are stitched together to one synthetic complex-valued hologram. The magnitude and phase of the complete mosaic hologram HPSH for the pinhole are shown in Figs. 8(a) and 8(b), respectively. Similar matrices are shown in Figs. 8(c) and 8(d) for the object hologram HOBJ. After cross correlating HOBJ with the phase-only filtered version of HPSH, the reconstruction images are shown in Figs. 8(e)-8(j) for different quantities of subholograms. Figures 8(e) and 8(f) show a reconstruction from eight stitched horizontal and vertical central holograms, respectively. Figures 8(g)–8(i) are obtained after reconstructing from stitched holograms captured from central 4, 16, and 36 subapertures, respectively. Figure 8(j) is obtained from the reconstruction of a complete mosaic of 64 holograms. Comparing the image of Fig. 8(j) with the images of Fig. 7, we conclude that the OCTISAI image is much better than the direct image obtained by the limited aperture [Fig. 7(j)]. Moreover, Fig. 8(j) is similar to the COACH image with the full aperture [Fig. 7(k)] and much better than the image of the limited aperture COACH [Fig. 7(i)]. Figure 8(k) shows the mean square error (MSE) graph calculated from the difference between the reconstructed images and the full aperture DI [Fig. 7(l)] versus the number of subapertures used to record the holograms. As expected, the MSE is inversely related to the number of subapertures.

    OCTISAI: (a) magnitude and (b) phase of the complete mosaic of the PSH, (c) magnitude and (d) phase of the object holograms, obtained from 64 limited apertures; reconstructed images after stitching of (e) eight central horizontal holograms, (f) eight central vertical holograms, (g) 2×2 central holograms, (h) 4×4 central holograms, (i) 6×6 central holograms, and (j) full 64 holograms; (k) MSE of OCTISAI reconstructed images versus the number of subapertures.

    Figure 8.OCTISAI: (a) magnitude and (b) phase of the complete mosaic of the PSH, (c) magnitude and (d) phase of the object holograms, obtained from 64 limited apertures; reconstructed images after stitching of (e) eight central horizontal holograms, (f) eight central vertical holograms, (g) 2×2 central holograms, (h) 4×4 central holograms, (i) 6×6 central holograms, and (j) full 64 holograms; (k) MSE of OCTISAI reconstructed images versus the number of subapertures.

    Figure 9 presents results obtained from COACH, OCTISAI, and DI for different distances zh of the sensor from the SLM (zh=10  cm=f2/2.5, zh=12.5  cm=f2/2, and zh=25  cm=f2) for verifying the resolution variation discussed during the MTF analysis. Reconstruction images are accompanied by the respective visibility plots for the left grating. Figure 9(a) is obtained from a limited aperture COACH (CPM of 135×135  pixels and zh=f2/2.5) and Fig. 9(b) from OCTISAI with zh=f2/2.5. The obtained image after SA is well resolved. Figure 9(c) is reconstructed from OCTISAI with zh=f2/2, and as expected, it has a slightly higher resolution than Fig. 9(b). Figure 9(d) is obtained by DI with a limited aperture (diffractive lens with the size of 135×135  pixels) having a lower resolution than OCTISAI but slightly higher than the limited aperture COACH [Fig. 9(a)]. Figure 9(e) is the result of COACH and Fig. 9(f) is of DI, both with a full aperture and zh=f2. Figure 9(f) is the best image obtained by our experiments and this image was used as the reference in the calculation of the MSE for Fig. 8(k). The important conclusion can be made from comparing Figs. 9(b) and 9(d) that the OCTISAI image is much better than the limited aperture DI result; thus, it can be easily used for far-field imaging purposes.

    COACH, OCTISAI, and DI images with visibility curve at the bottom for (a) limited aperture COACH with zh=f2/2.5, (b) synthetic aperture (SA) with zh=f2/2.5, (c) SA with zh=f2/2, (d) limited aperture direct imaging with zh=f2, (e) full aperture COACH with zh=f2, and (f) full aperture direct imaging with zh=f2; f2=25 cm.

    Figure 9.COACH, OCTISAI, and DI images with visibility curve at the bottom for (a) limited aperture COACH with zh=f2/2.5, (b) synthetic aperture (SA) with zh=f2/2.5, (c) SA with zh=f2/2, (d) limited aperture direct imaging with zh=f2, (e) full aperture COACH with zh=f2, and (f) full aperture direct imaging with zh=f2; f2=25  cm.

    In the next set of experiments, the effect of scattering degree, σ, is studied. σ is defined as the ratio between the constrained scattering area and the maximum scattering area, both areas on the spatial spectrum plane. In the GSA used to synthesize the CPMs, σ=0.046, 0.092, 0.185, 0.278, 0.37, 0.463, 0.556, and 0.648 were produced by varying the size of the constrained magnitude area in the Fourier domain, during the CPM synthesis. Considering Fig. 1, in which the dark red color represents minimum σ and the bright red color indicates a higher value of σ, the interference area between the modulated chaotic beam and an unmodulated plane wave is controlled by σ. In other words, the size of HPSH is determined by the σ constraint of the GSA. The SNR is increased by increasing σ due to the expansion of the interference area and the area of the cross correlation at the sensor. However, above some value of σ, the SNR goes down. This is because the intensity spreads over a too large area, such that the intensity per pixel of the sensor is reduced close to, or below, the noise average level. Figures 10(a1)–10(a8) show the CPM phase maps each for different σ. The images reconstructed by OCTISAI for the various values of σ are shown in Figs. 10(b1)–10(b8). The normalized SNR and visibility for the reconstructed images are shown in Fig. 10(c). Optimum σ was found to be 0.463 for maximum SNR and 0.37 for maximum visibility.

    (a1)–(a8) Phase maps of coded phase masks (CPMs) and (b1)–(b8) the respective reconstructed images by OCTISAI, while implementing SA with scattering degrees, σ, from 0.046 to 0.648; (c) SNR and visibility plots versus σ for (b1)–(b8).

    Figure 10.(a1)–(a8) Phase maps of coded phase masks (CPMs) and (b1)–(b8) the respective reconstructed images by OCTISAI, while implementing SA with scattering degrees, σ, from 0.046 to 0.648; (c) SNR and visibility plots versus σ for (b1)–(b8).

    5. CONCLUSION AND SCOPE

    In this study, we propose a novel incoherent single-channel-at-a-time synthetic aperture imaging technique named OCTISAI that operates in the optical spectral range. The goal of any SA to increase the image resolution of the given imaging system has been achieved by imaging the target over time from various points of view. To demonstrate resolution enhancement, OCTISAI follows the principle of any incoherent SA system manifested by a reference-free two-wave interference. However, the main novelty of OCTISAI is that the two-wave interference is done through a single optical channel rather than two far-apart channels like in all other cases of incoherent SA with the desired fill factor. This advantage of the single-channel operation is achieved with a certain cost. Although the resolution of the other SA systems with two channels is improved by a factor of N, where N is the number of subapertures along the width of the SA, in OCTISAI the factor of improvement is smaller than N by the factor zh/f2, but larger than 1 as long as the condition f2/zh<N is satisfied. In the present experiment where the number of subapertures is N=8 and the sensor is at half the focal length of the diffractive lens, i.e., zh/f2=0.5, we conclude that the resolution of OCTISAI is better than that of single subaperture by a factor of 8 if the subaperture is COACH with zh/f2=0.5, by a factor of 4 if the subaperture is COACH with zh/f2=1, or coherent DI, and by a factor of 3 if the subaperture is incoherent DI.

    The SA is realized with a polarization multiplexing scheme to achieve an interference pattern between a beam modulated by a pseudorandom phase mask and a plane wave. Both these beams are originated from the same object point and hence they create an interference pattern on the image sensor. Each SA hologram, for an object and a guide star, is obtained by stitching the many phase-shifted subholograms obtained from multiple locations of the single OCTISAI subaperture. The image is reconstructed by cross correlating the stitched PSH with the stitched object complex-valued hologram. Using pseudorandom CPM with increasing values of scattering reduced the noise and improved the resolution up to a point that the SNR is reduced due to the weakness of the over-scattered recoded signals. In comparison to FINCH-based systems, OCTISAI is likely to have certain advantages, because of the additional tunable parameter of the scattering degree, which does not exist in FINCH-based systems [912]. In comparison to COACH, OCTISAI improves the image resolution of COACH by using the time dimension and without changing the aperture size of the COACH system. The experimental results obtained for incoherently illuminated objects in our laboratory model of OCTISAI under far-field imaging conditions provide a possible solution to the problem of the two far-apart channels existing in the entire optical incoherent SA imagers. Adapting this solution to astronomical interferometers is an issue for future research.

    Following the current study, there are several open topics for future research. OCTISAI is likely to have 3D imaging capabilities because the parent technique, COACH, has 3D capabilities, as studied in Ref. [13]. Future research with OCTISAI can also explore several topics investigated in other similar systems. For instance, image reconstruction with non-linear correlation [34,35] can reduce the number of camera shots for each subhologram from three to one. Another important issue is the sampling question; is it possible to sample the SA with discrete samples of subapertures, and what is the cost of such a sampling method? Is it possible to expand the SA over only an annular aperture such as in the case of SMART [16]? All these questions, and probably others as well, are open for future investigations. Despite these questions, this study brings us closer to a new technology in which a compact single ground-based or a space-based optical telescope will include all the elements of capturing the light, the waveguide, and the interfering laboratory. Such a single telescope may replace the current array of telescopes in which at any given time at least two far-apart telescopes are connected to a separate interreference laboratory via two different optical channels.

    References

    [1] A. A. Michelson, F. G. Pease. Measurement of the diameter of α-Orionis by the interferometer. Astrophys. J., 53, 249-259(1921).

    [2] F. Merkle. Synthetic-aperture imaging with the European very large telescope. J. Opt. Soc. Am. A, 5, 904-913(1988).

    [3] J. E. Baldwin, C. A. Haniff. The application of interferometry to optical astronomical imaging. Philos. Trans. R. Soc. A, 360, 969-986(2002).

    [4] J. E. Baldwin. Ground-based interferometry: the past decade and the one to come. Proc. SPIE, 4838, 1-8(2003).

    [5] H. Schuha, D. Behrendb. VLBI: a fascinating technique for geodesy and astrometry. J. Geodyn., 61, 68-80(2012).

    [6] R. H. Brown, R. Q. Twiss. A test of a new type of stellar interferometer on Sirius. Nature, 178, 1046-1048(1956).

    [7] J. Rosen, G. Brooker. Digital spatially incoherent Fresnel holography. Opt. Lett., 32, 912-914(2007).

    [8] J. Rosen, G. Brooker. Fresnel incoherent correlation holography (FINCH)–a review of research. Adv. Opt. Technol., 1, 151-169(2012).

    [9] B. Katz, J. Rosen. Super-resolution in incoherent optical imaging using synthetic aperture with Fresnel elements. Opt. Express, 18, 962-972(2010).

    [10] B. Katz, J. Rosen. Could SAFE concept be applied for designing a new synthetic aperture telescope?. Opt. Express, 19, 4924-4936(2011).

    [11] Y. Kashter, J. Rosen. Enhanced-resolution using modified configuration of Fresnel incoherent holographic recorder with synthetic aperture. Opt. Express, 22, 20551-20565(2014).

    [12] Y. Kashter, Y. Rivenson, A. Stern, J. Rosen. Sparse synthetic aperture with Fresnel elements (S-SAFE) using digital incoherent holograms. Opt. Express, 23, 20941-20960(2015).

    [13] A. Vijayakumar, Y. Kashter, R. Kelner, J. Rosen. Coded aperture correlation holography–a new type of incoherent digital holograms. Opt. Express, 24, 12430-12441(2016).

    [14] A. Vijayakumar, J. Rosen. Interferenceless coded aperture correlation holography–a new technique for recording incoherent digital holograms without two-wave interference. Opt. Express, 25, 13883-13896(2017).

    [15] A. Bulbul, A. Vijayakumar, J. Rosen. Partial aperture imaging by systems with annular phase coded masks. Opt. Express, 25, 33315-33329(2017).

    [16] A. Bulbul, A. Vijayakumar, J. Rosen. Superresolution far-field imaging by coded phase reflectors distributed only along the boundary of synthetic apertures. Optica, 5, 1607-1616(2018).

    [17] F. L. Clerc, M. Gross, L. Collot. Synthetic-aperture experiment in the visible with on-axis digital heterodyne holography. Opt. Lett., 26, 1550-1552(2001).

    [18] R. Binet, J. Colineau, J. C. Lehureau. Short-range synthetic aperture imaging at 633 nm by digital holography. Appl. Opt., 41, 4775-4782(2002).

    [19] J. H. Massig. Digital off-axis holography with a synthetic aperture. Opt. Lett., 27, 2179-2181(2002).

    [20] L. Liu. Coherent and incoherent synthetic-aperture imaging ladars and laboratory-space experimental demonstrations [Invited]. Appl. Opt., 52, 579-599(2013).

    [21] T. S. Ralston, D. L. Marks, P. S. Carney, A. B. Stephen. Interferometric synthetic aperture microscopy. Nat. Phys., 3, 129-134(2007).

    [22] C. Zheng, D. Jin, Y. He, H. Lin, J. Hu, Z. Yaqoob, P. T. C. So, R. Zhou. “High spatial and temporal resolution synthetic aperture phase microscopy. Adv. Photonics, 2, 065002(2020).

    [23] A. Ilovitsh, S. Zach, Z. Zalevsky. Optical synthetic aperture radar. J. Mod. Opt., 60, 803-807(2013).

    [24] J. Holloway, W. Yicheng, M. K. Sharma, O. Cossairt, A. Veeraraghavan. SAVI: synthetic apertures for long-range, subdiffraction-limited visible imaging using Fourier ptychography. Sci. Adv., 3, e1602564(2017).

    [25] Y. Choi, T. D. Yang, C. F. Yen, P. Kang, K. J. Lee, R. R. Dasari, M. S. Feld, W. Choi. Overcoming the diffraction limit using multiple light scattering in a highly disordered medium. Phys. Rev. Lett., 107, 023902(2011).

    [26] S. C. W. Hyde, N. P. Barry, R. Jones, J. C. Dainty, P. M. W. French, M. B. Klein, B. A. Wechsler. Depth-resolved holographic imaging through scattering media by photorefraction. Opt. Lett., 20, 1331-1333(1995).

    [27] E. Leith. Imaging through scattering media with holography. J. Opt. Soc. Am. A, 9, 1148-1153(1992).

    [28] R. Horisaki, R. Takagi, J. Tanida. Learning-based imaging through scattering media. Opt. Express, 24, 13738-13743(2016).

    [29] Y. Li, Y. Xue, L. Tian. Deep speckle correlation: a deep learning approach toward scalable imaging through scattering media. Optica, 5, 1181-1190(2018).

    [30] D. B. Chenault, J. L. Pezzaniti. Polarization imaging through scattering media. Proc. SPIE, 4133, 124-133(2000).

    [31] J. W. Goodman. Introduction to Fourier Optics(2005).

    [32] J. Rosen, A. Vijayakumar, M. R. Rai, S. Mukherjee, A. Bulbul. Review of 3D imaging by coded aperture correlation holography (COACH). Appl. Sci., 9, 605(2019).

    [33] R. W. Gerchberg, W. O. Saxton. A practical algorithm for the determination of phase from image and diffraction plane pictures. Optik, 35, 227-246(1972).

    [34] M. R. Rai, A. Vijayakumar, J. Rosen. Non-linear adaptive three-dimensional imaging with interferenceless coded aperture correlation holography (I-COACH). Opt. Express, 26, 18143-18154(2018).

    [35] A. Bulbul, J. Rosen. Partial aperture imaging system based on sparse point spread holograms and nonlinear cross-correlations. Sci. Rep., 10, 21983(2020).

    Angika Bulbul, Joseph Rosen. Super-resolution imaging by optical incoherent synthetic aperture with one channel at a time[J]. Photonics Research, 2021, 9(7): 1172
    Download Citation