
Ziyong Chen, Jun He, Xizhen Xu, Jia He, Baijie Xu, Bin Du, Changrui Liao, Yiping Wang. High-Temperature Sensor Array Based on Fiber Bragg Gratings Fabricated by Femtosecond Laser Point-by-Point Method[J]. Acta Optica Sinica, 2021, 41(13): 1306002
- Acta Optica Sinica
- Vol. 41, Issue 13, 1306002 (2021)
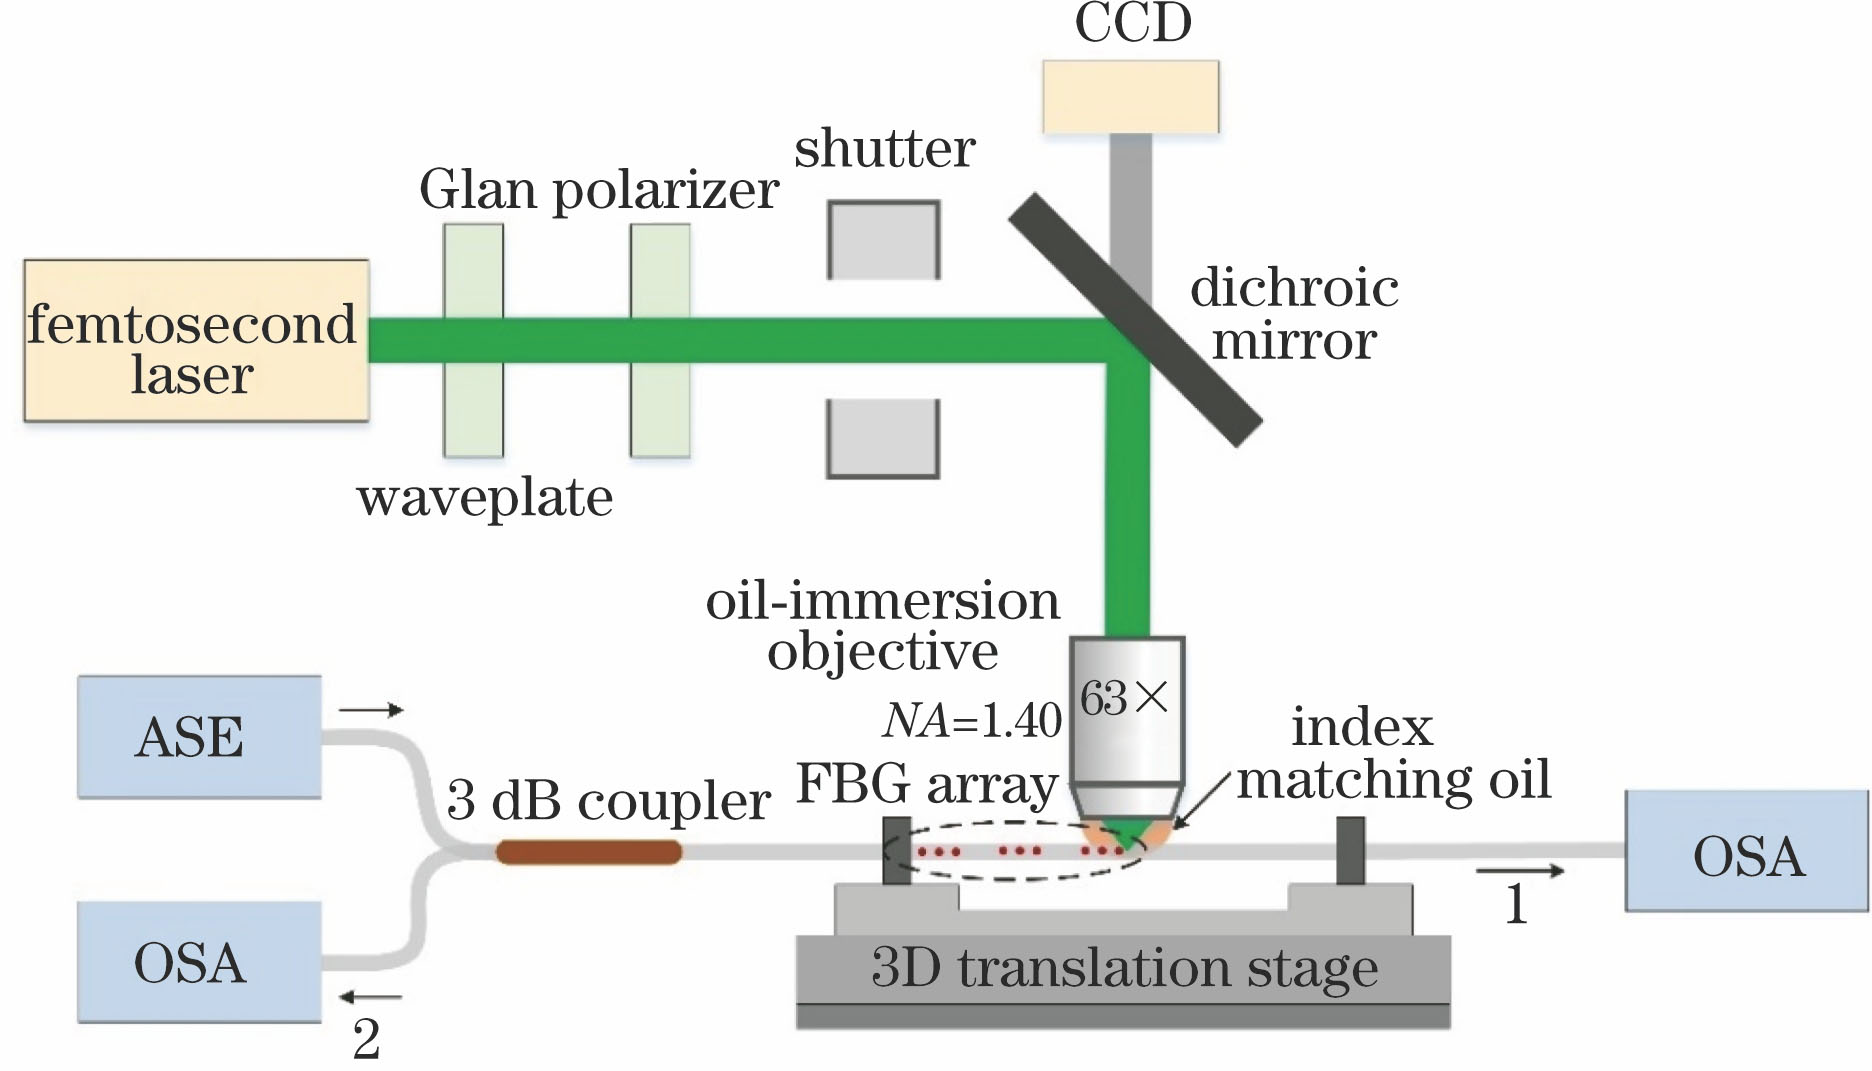
Fig. 1. Experimental setup for fabricating FBG array based on femtosecond laser point-by-point method
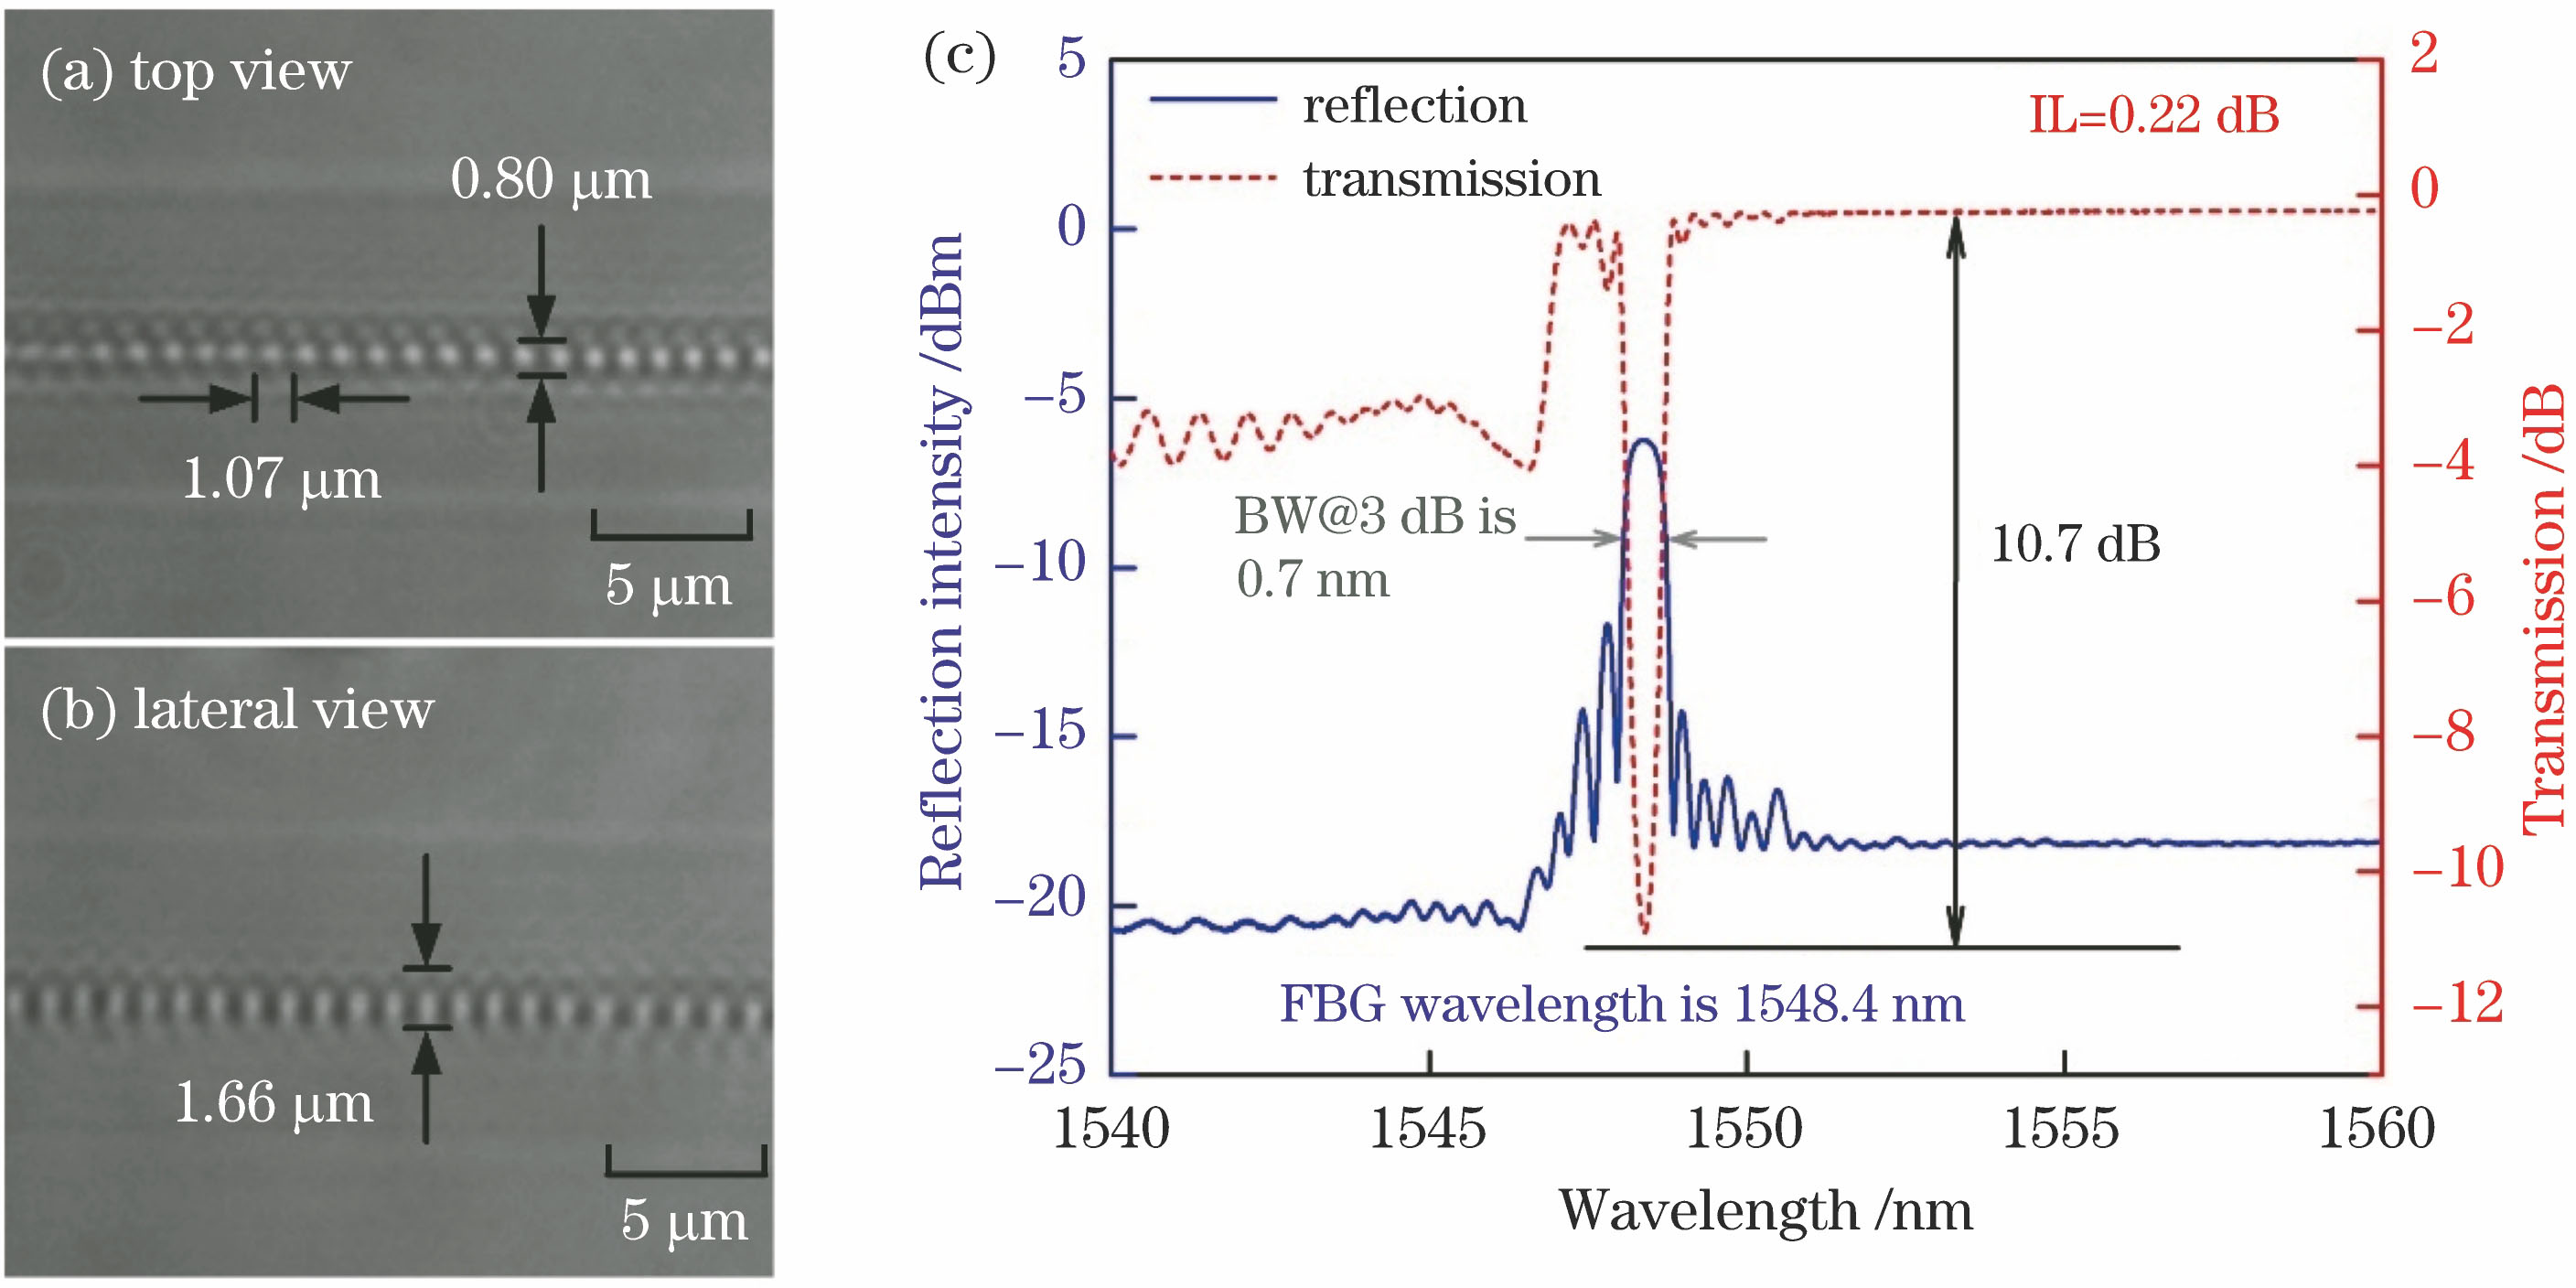
Fig. 2. Microscope images and spectra of the FBG. (a) Top view; (b) lateral view; (c) transmission spectrum and reflection spectrum
Fig. 3. Reflection spectrum of the WDM-FBG array
Fig. 4. Reflection spectra of different FBG. (a) FBG T1 and FBG T2; (b) FBG T3 and FBG T4
Fig. 5. Experimental setup of FBG annealing and calibration system
Fig. 6. FBG center wavelength change curve with time during annealing process. (a) FBG T1 and FBG T3; (b) FBG T2 and FBG T4
Fig. 7. Calculated deviations of different fit functions. (a) Linear function; (b) second-order polynomial function; (c) third-order polynomial function
Fig. 8. Wavelength-temperature calibration points and temperature response fitting curves of FBG T1 and FBG T2
Fig. 9. Fitting errors of FBG T1 and FBG T2
Fig. 10. Fitting curves of the wavelength variation and temperature of 4 grating samples
Fig. 11. Universal fitting function errors of 4 grating samples
Fig. 12. Universal fitting function error of 4 grating samples improved based on piecewise fitting method
Fig. 13. Temperature measurement errors of FBG S1-FBG S4 after improvement
|
Table 1. Preparation parameters of different FBG
|
Table 2. Drift rate of the FBG center wavelength during annealing


Set citation alerts for the article
Please enter your email address

© Copyright 2018-2021 | Chinese Laser Press. All Rights Reserved 沪ICP备15018463号-20