Author Affiliations
School of Optoelectronic Engineering and Instrumentation Science, Dalian University of Technology, Dalian 116024, Liaoning , Chinashow less
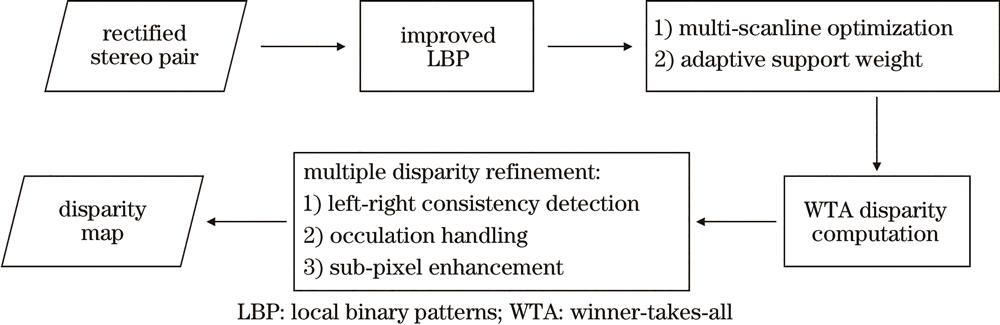
Fig. 1. Diagram of proposed method
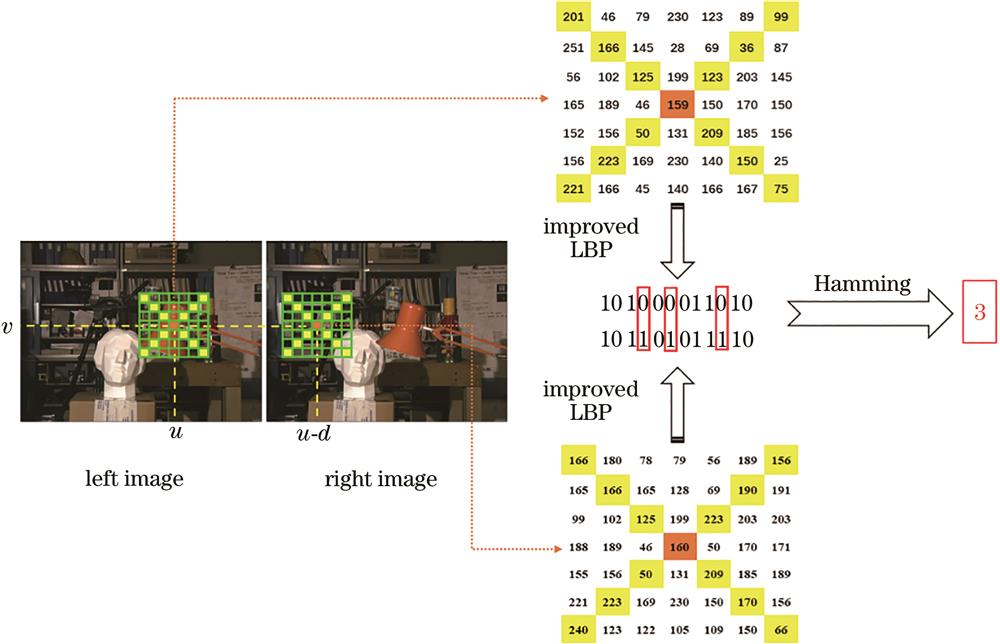
Fig. 2. Process of matching cost calculation
Fig. 3. Transform effects of improved LBP operator and initial LBP operator. (a) Source image; (b) result of initial LBP operator; (c) result of improved LBP operator; (d) calculation time comparison
Fig. 4. Traditional eight-path cost aggregation
Fig. 5. Path selection in proposed method
Fig. 6. Experimental effect images. (a) Raw images in left view (tsukuba, venus, teddy, and cones); (b) true disparity map; (c) disparity map of SGM; (d) disparity map of proposed algorithm; (e) disparity map in pseudo-color of proposed algorithm
| Parameter | LBP size | P1 | P2 | R | ξ | ζ | λ |
|---|
| Value | 7×7 | 10 | 150 | 5 | 10 | 2 | 5 |
|
Table 1. Parameters of proposed algorithm
| Algorithm | Tsukuba | Venus | Teddy | Cones |
|---|
| d∈[0,16] | d∈[0,20] | d∈[0,64] | d∈[0,64] |
|---|
| Cost calculation | Cost aggregation | Cost calculation | Cost aggregation | Cost calculation | Cost aggregation | Cost calculation | Cost aggregation |
|---|
| SGM | 0.170 | 8.472 | 0.280 | 15.777 | 0.695 | 49.987 | 0.713 | 50.114 | | Proposed | 0.053 | 5.354 | 0.074 | 10.076 | 0.253 | 29.979 | 0.254 | 29.714 | | Improved time | 0.117 (68.0%) | 3.118 (36.8%) | 0.206 (73.5%) | 5.701 (36.1%) | 0.442 (63.5%) | 20.008 (40.0%) | 0.459 (64.3%) | 20.400 (40.7%) |
|
Table 2. Calculation time comparison in debug mode
| Algorithm | Tsukuba | Venus | Teddy | Cones |
|---|
| d∈[0,16] | d∈[0,20] | d∈[0,64] | d∈[0,64] |
|---|
| Cost calculation | Cost aggregation | Cost calculation | Cost aggregation | Cost calculation | Cost aggregation | Cost calculation | Cost aggregation |
|---|
| SGM | 0.037 | 0.088 | 0.071 | 0.163 | 0.196 | 0.445 | 0.205 | 0.493 | | Proposed | 0.017 | 0.045 | 0.025 | 0.097 | 0.075 | 0.311 | 0.093 | 0.289 | | Improved time | 0.020 (54.0%) | 0.043 (48.8%) | 0.046 (64.7%) | 0.066 (40.5%) | 0.121 (61.7%) | 0.134 (30.1%) | 0.112 (54.6%) | 0.204 (41.3%) |
|
Table 3. Calculation time comparison in release mode
| Algorithm | Tsukuba | Venus | Teddy | Cones | Average |
|---|
| nonocc | all | disc | nonocc | all | disc | nonocc | all | disc | nonocc | all | disc |
|---|
| RTcensus[19] | 5.1 | 6.3 | 19.2 | 1.6 | 2.4 | 14.2 | 8.0 | 13.8 | 20.3 | 4.1 | 9.5 | 12.2 | 9.73 | | ADcensus[20] | 1.1 | 1.5 | 5.7 | 0.1 | 0.3 | 1.2 | 4.1 | 6.2 | 10.9 | 2.4 | 7.3 | 7.0 | 3.97 | | C-SemiGlob[23] | 2.6 | 3.3 | 9.9 | 0.3 | 0.6 | 3.2 | 5.1 | 11.8 | 13.0 | 2.8 | 8.4 | 8.2 | 5.76 | | planeFitSGM[21] | 3.1 | 4.2 | 14.9 | 1.1 | 1.9 | 14.6 | 5.7 | 11.6 | 17.1 | 3.8 | 9.3 | 11.3 | 8.21 | | SGM[14] | 3.3 | 4.0 | 12.8 | 1.0 | 1.6 | 11.3 | 6.0 | 12.2 | 16.3 | 3.1 | 9.8 | 8.9 | 7.51 | | SGMDDW[22] | 2.3 | 4.4 | 11.8 | 1.2 | 2.7 | 16.8 | 6.5 | 14.5 | 17.5 | 5.6 | 14.2 | 14.8 | 9.36 | | Proposed | 3.3 | 3.5 | 12.7 | 0.9 | 1.1 | 9.8 | 7.3 | 9.1 | 14.4 | 3.9 | 7.3 | 11.7 | 7.08 |
|
Table 4. Comparison of mismatched ratio with threshold is 1
| Algorithm | Tsukuba | Venus | Teddy | Cones | Average |
|---|
| nonocc | all | disc | nonocc | all | disc | nonocc | all | disc | nonocc | all | disc |
|---|
| RTcensus[19] | 12.9 | 14.1 | 28.1 | 3.7 | 4.6 | 17.8 | 11.4 | 18.6 | 27.7 | 5.5 | 11.8 | 15.9 | 14.34 | | ADcensus[20] | 26.8 | 27.0 | 21.1 | 4.1 | 4.6 | 8.0 | 10.6 | 13.8 | 20.1 | 6.6 | 12.4 | 11.9 | 13.92 | | C-SemiGlob[23] | 13.9 | 14.7 | 18.9 | 3.3 | 3.8 | 10.9 | 9.8 | 17.4 | 22.8 | 5.4 | 11.7 | 12.8 | 12.12 | | planeFitSGM[21] | 9.2 | 10.4 | 23.3 | 2.3 | 3.2 | 15.9 | 9.0 | 17.0 | 25.5 | 5.2 | 11.6 | 14.7 | 12.28 | | SGM[14] | 13.4 | 14.3 | 20.3 | 4.6 | 5.4 | 15.7 | 11.0 | 18.5 | 26.1 | 4.9 | 12.5 | 13.5 | 13.35 | | SGMDDW[22] | 15.5 | 17.5 | 23.1 | 8.1 | 9.6 | 25.6 | 15.7 | 23.9 | 31.5 | 14.5 | 22.8 | 26.0 | 19.48 | | Proposed | 6.3 | 8.9 | 20.1 | 5.5 | 5.9 | 17.3 | 8.2 | 10.0 | 30.5 | 8.5 | 10.1 | 17.4 | 12.39 |
|
Table 5. Comparison of mismatched ratio when threshold is 0.5
Stereo pairs | Mismatched ratio |
|---|
| MDP[23] | SRM[24] | Cens5[25] | SGBM1[13] | SGM[14] | DTS[26] | Proposed |
|---|
| Adiron | 25.0 | 28.7 | 37.0 | 39.5 | 29.1 | 20.9 | 25.5 | | ArtL | 15.1 | 15.8 | 17.5 | 19.0 | 11.5 | 17.7 | 11.7 | | Jadepl | 35.9 | 38.2 | 35.9 | 36.0 | 28.1 | 34.3 | 20.2 | | Motor | 30.4 | 27.6 | 32.5 | 25.9 | 25.5 | 21.1 | 17.9 | | MotorE | 28.7 | 30.3 | 28.9 | 36.9 | 22.5 | 21.8 | 15.8 | | Piano | 33.6 | 38.1 | 33.6 | 36.6 | 26.1 | 33.0 | 22.3 | | PianoL | 41.7 | 47.9 | 47.4 | 58.6 | 42.1 | 39.0 | 39.5 | | Pipes | 29.0 | 23.2 | 23.6 | 20.4 | 20.5 | 24.9 | 14.4 | | Playrm | 42.7 | 44.6 | 47.4 | 45.0 | 38.3 | 40.6 | 26.8 | | Playt | 47.8 | 35.0 | 67.9 | 52.4 | 64.7 | 34.7 | 45.3 | | PlaytP | 28.8 | 32.9 | 29.1 | 29.2 | 24.7 | 32.2 | 17.3 | | Recyc | 31.3 | 32.4 | 33.6 | 33.0 | 27.0 | 24.1 | 18.9 | | Shelvs | 54.5 | 54.4 | 62.1 | 57.2 | 59.0 | 46.9 | 41.3 | | Teddy | 10.8 | 10.6 | 12.3 | 18.1 | 10.1 | 10.3 | 8.2 | | Vintge | 43.6 | 49.5 | 61.2 | 55.0 | 51.3 | 47.6 | 35.9 | | Austr | 36.3 | 29.3 | 63.2 | 51.8 | 58.1 | 24.5 | 40.7 | | AustrP | 18.4 | 27.2 | 19.0 | 24.1 | 10.2 | 23.6 | 17.1 | | Bicyc2 | 24.4 | 25.6 | 19.2 | 21.4 | 15.5 | 17.5 | 17.9 | | Class | 30.0 | 29.5 | 33.7 | 24.4 | 30.4 | 21.7 | 31.3 | | ClassE | 48.8 | 40.8 | 57.3 | 78.5 | 54.6 | 38.3 | 38.2 | | Compu | 16.9 | 18.9 | 30.0 | 20.8 | 21.2 | 20.9 | 17.9 | | Crusa | 40.7 | 45.5 | 61.3 | 47.8 | 48.8 | 44.3 | 34.2 | | CrusaP | 32.8 | 45.2 | 47.7 | 41.9 | 27.9 | 45.0 | 19.5 | | Djemb | 20.9 | 21.8 | 19.2 | 13.4 | 13.9 | 19.2 | 23.7 | | DjembL | 47.3 | 42.5 | 49.7 | 63.5 | 44.1 | 33.8 | 30.9 | | Hoops | 41.2 | 41.5 | 51.2 | 49.8 | 44.2 | 39.3 | 31.9 | | Livgrm | 28.8 | 33.4 | 39.5 | 34.6 | 33.1 | 29.1 | 23.2 | | Nkuba | 38.3 | 38.7 | 36.4 | 34.6 | 32.4 | 36.1 | 20.7 | | Plants | 33.5 | 32.3 | 43.0 | 35.4 | 31.9 | 31.7 | 22.3 | | Stairs | 35.2 | 42.5 | 55.0 | 59.2 | 44.7 | 29.8 | 31.3 | | Average | 30.9 | 32.4 | 36.6 | 35.2 | 29.7 | 28.6 | 25.4 |
|
Table 6. Comparison of mismatched ratio in all regions