• Photonics Research
  • Vol. 8, Issue 6, 904 (2020)
Dongmei Huang1、2, Feng Li1、2、*, Chao Shang2、3, Zihao Cheng1、2, S. T. Chu4, and P. K. A. Wai1、2
Author Affiliations
  • 1Photonics Research Centre, Department of Electronic and Information Engineering, The Hong Kong Polytechnic University, Hong Kong SAR, China
  • 2The Hong Kong Polytechnic University Shenzhen Research Institute, Shenzhen 518057, China
  • 3Photonics Research Centre, Department of Electrical Engineering, The Hong Kong Polytechnic University, Hong Kong SAR, China
  • 4Department of Physics and Materials Science, City University of Hong Kong, Hong Kong SAR, China
  • show less
    DOI: 10.1364/PRJ.386900 Cite this Article Set citation alerts
    Dongmei Huang, Feng Li, Chao Shang, Zihao Cheng, S. T. Chu, P. K. A. Wai. Frequency comb swept laser with a high-Q microring filter[J]. Photonics Research, 2020, 8(6): 904 Copy Citation Text show less
    Schematic diagram of an FDML laser with a comb filter. FFP-TF, Fiber Fabry–Pérot tunable filter; SOA, semiconductor optical amplifier; ISO, isolator; AWG, arbitrary-waveform generator; OC, optical coupler; PC, polarization controller; CIR, circulator; SMF, single-mode fiber; DCF, dispersion compensation fiber; FRM, Faraday rotating mirror; CF, comb filter (microring or F–P comb filter). The inset shows a photo of the Hydex glass microring comb filter.
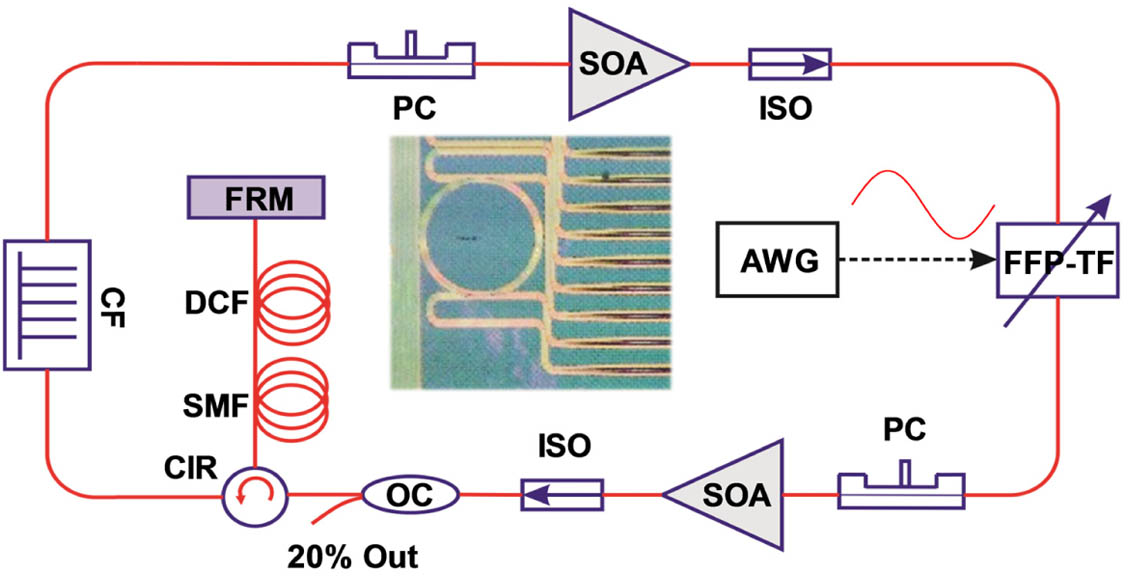
    Fig. 1. Schematic diagram of an FDML laser with a comb filter. FFP-TF, Fiber Fabry–Pérot tunable filter; SOA, semiconductor optical amplifier; ISO, isolator; AWG, arbitrary-waveform generator; OC, optical coupler; PC, polarization controller; CIR, circulator; SMF, single-mode fiber; DCF, dispersion compensation fiber; FRM, Faraday rotating mirror; CF, comb filter (microring or F–P comb filter). The inset shows a photo of the Hydex glass microring comb filter.
    Schematic diagram of the point spread function and sensitivity roll-off measurement system. OC, optical coupler; PD, photodetector; BPD, balanced photodetector; CIR, circulator; PC, polarization controller; VODL, variable optical delay line.
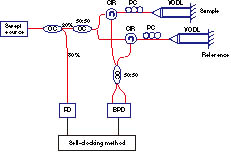
    Fig. 2. Schematic diagram of the point spread function and sensitivity roll-off measurement system. OC, optical coupler; PD, photodetector; BPD, balanced photodetector; CIR, circulator; PC, polarization controller; VODL, variable optical delay line.
    (a) Transmission spectrum of the microring filter. (b) The fine structures of a pair of resonances for TE and TM modes; (c) and (d) respectively show the TM and TE resonances shown in (b) with Lorentzian fittings. (e) Transmission spectrum of the F–P comb filter. (f) The fine structure of one resonance of the F–P comb filter with Lorentzian fitting. All the spectra are captured with averaging of 30 measurements.
    Fig. 3. (a) Transmission spectrum of the microring filter. (b) The fine structures of a pair of resonances for TE and TM modes; (c) and (d) respectively show the TM and TE resonances shown in (b) with Lorentzian fittings. (e) Transmission spectrum of the F–P comb filter. (f) The fine structure of one resonance of the F–P comb filter with Lorentzian fitting. All the spectra are captured with averaging of 30 measurements.
    Performance of a discrete FDML laser with F–P comb filter. (a) Output spectra and (b) the zoom-in view from 1555 to 1565 nm. (c) The instantaneous linewidth of the swept signal with Lorentzian fitting measured by the optical complex spectrum analyzer, (d) the temporal waveform, and (f) the zoom-in view from 10 to 10.3 μs without averaging. (e) The temporal waveform and (g) the zoom-in view with averaging of 10 measurements.
    Fig. 4. Performance of a discrete FDML laser with F–P comb filter. (a) Output spectra and (b) the zoom-in view from 1555 to 1565 nm. (c) The instantaneous linewidth of the swept signal with Lorentzian fitting measured by the optical complex spectrum analyzer, (d) the temporal waveform, and (f) the zoom-in view from 10 to 10.3 μs without averaging. (e) The temporal waveform and (g) the zoom-in view with averaging of 10 measurements.
    Performance of the discrete FDML laser with microring comb filter. (a) The output spectra and (b) the zoom-in view from 1555 to 1565 nm. (c) The instantaneous linewidth of the swept signal with Lorentzian fitting measured by the optical complex spectrum analyzer, (d) the temporal waveform, and (f) the zoom-in view from 10 to 10.3 μs without averaging. (e) The temporal waveform and (g) the zoom-in view with averaging of 10 measurements.
    Fig. 5. Performance of the discrete FDML laser with microring comb filter. (a) The output spectra and (b) the zoom-in view from 1555 to 1565 nm. (c) The instantaneous linewidth of the swept signal with Lorentzian fitting measured by the optical complex spectrum analyzer, (d) the temporal waveform, and (f) the zoom-in view from 10 to 10.3 μs without averaging. (e) The temporal waveform and (g) the zoom-in view with averaging of 10 measurements.
    (a) Example of raw interference fringe pattern with an F–P comb filter captured by the BPD. (b) Resampled interference spectrum with self-clocking. (c) Axial resolution estimation with PSF calculated from the signal of (b). (d)–(g) The measured PSFs of the frequency comb swept laser with an F–P comb filter for different OCT imaging ranges. (d) The imaging range from 0 to 14 mm. (e) The zoom-in view from 0 to 1.5 mm. (f) The zoom-in view from 6.1 to 7.6 mm, covering the 6 dB sensitivity roll-off length. (g) The zoom-in view from 12.4 to 13.9 mm, covering the 20 dB sensitivity roll-off length.
    Fig. 6. (a) Example of raw interference fringe pattern with an F–P comb filter captured by the BPD. (b) Resampled interference spectrum with self-clocking. (c) Axial resolution estimation with PSF calculated from the signal of (b). (d)–(g) The measured PSFs of the frequency comb swept laser with an F–P comb filter for different OCT imaging ranges. (d) The imaging range from 0 to 14 mm. (e) The zoom-in view from 0 to 1.5 mm. (f) The zoom-in view from 6.1 to 7.6 mm, covering the 6 dB sensitivity roll-off length. (g) The zoom-in view from 12.4 to 13.9 mm, covering the 20 dB sensitivity roll-off length.
    (a) Example of raw interference fringe pattern with microring comb filter captured by the BPD. (b) Resampled interference spectrum with self-clocking. (c) Axial resolution estimation with PSF calculated from the signal of (b). (d)–(g) The measured PSFs of frequency comb swept laser with microring comb filter for different OCT imaging ranges. (d) The imaging range from 0 to 104 mm. (e) The zoom in view from 0 to 1.5 mm. (f) The zoom-in view from 51.7 to 53.2 mm, covering the 6 dB sensitivity roll-off length. (g) The zoom-in view from 102.6 to 104.1 mm, covering the 15 dB sensitivity roll-off length.
    Fig. 7. (a) Example of raw interference fringe pattern with microring comb filter captured by the BPD. (b) Resampled interference spectrum with self-clocking. (c) Axial resolution estimation with PSF calculated from the signal of (b). (d)–(g) The measured PSFs of frequency comb swept laser with microring comb filter for different OCT imaging ranges. (d) The imaging range from 0 to 104 mm. (e) The zoom in view from 0 to 1.5 mm. (f) The zoom-in view from 51.7 to 53.2 mm, covering the 6 dB sensitivity roll-off length. (g) The zoom-in view from 102.6 to 104.1 mm, covering the 15 dB sensitivity roll-off length.
    Dongmei Huang, Feng Li, Chao Shang, Zihao Cheng, S. T. Chu, P. K. A. Wai. Frequency comb swept laser with a high-Q microring filter[J]. Photonics Research, 2020, 8(6): 904
    Download Citation