
Quan-Jiang Lv, Yi-Hong Zhang, Chang-Da Zheng, Jiang-Dong Gao, Jian-Li Zhang, Jun-Lin Liu. Analysis of stress-induced inhomogeneous electroluminescence in GaN-based green LEDs grown on mesh-patterned Si (111) substrates with n-type AlGaN layer[J]. Chinese Physics B, 2020, 29(8):
- Chinese Physics B
- Vol. 29, Issue 8, (2020)
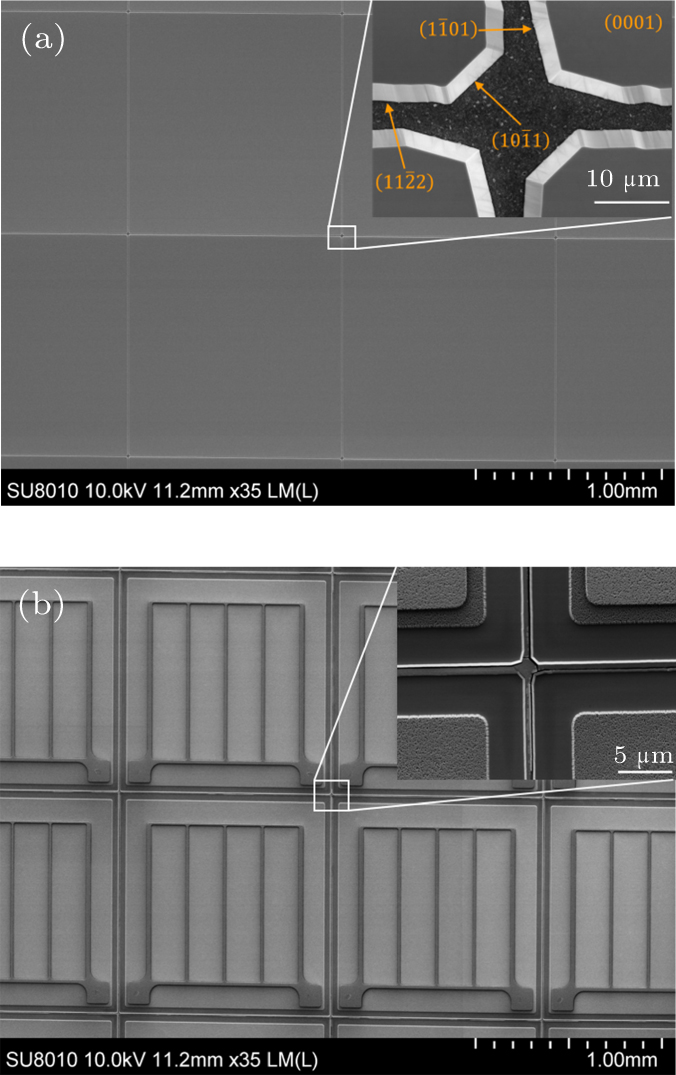
Fig. 1. FE-SEM images of GaN-based LED wafer surface on Si (111) masked with SiO2 before (a) and after (b) chip process.
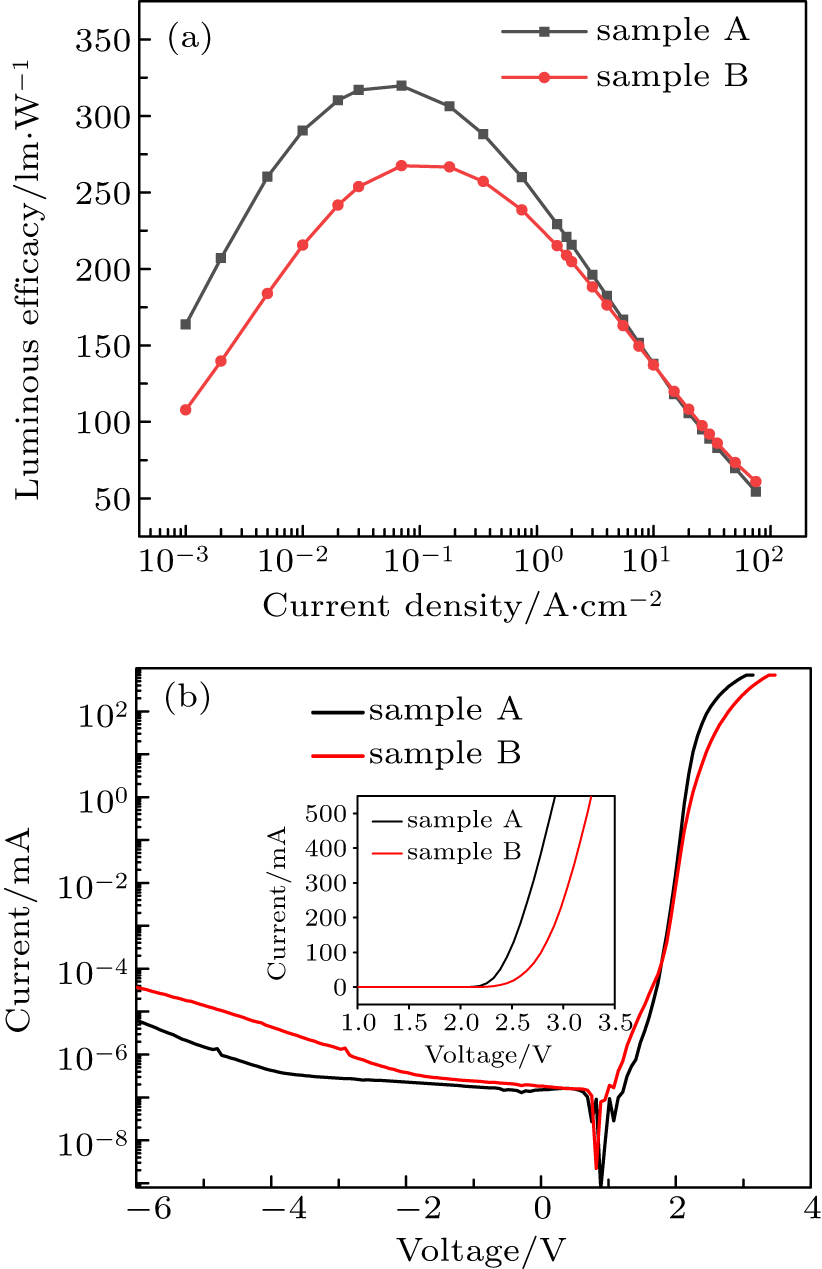
Fig. 2. (a) Experimentally measured luminous efficacy curves versus current injection of green LEDs with and without n-AlGaN. (b) Semi-logarithmic scale I – V characteristics of samples A and B. The inset is the forward I – V curves of the two LED chips plotted on linear scale.
Fig. 3. (a) Near-field emission intensity distribution images of samples A and B at J = 0.1 A⋅cm−2, 1.5 A⋅cm−2, and 7.5 A⋅cm−2. The curve to the right of the images represent the light output measured along the dashed line; (b) Micro-Raman spectra collected from edges and center part of the mesh-patterned unit. (c) Schematic diagram of various recombination current components in mesh-patterned LEDs and its corresponding equivalent circuit. (d) Spatial thermal distribution of samples A and B at J = 0.1 A⋅cm−2.
Fig. 4. (a) Semi-logarithmic plot of the forward I –V characteristics of both samples; (b) Diode-ideality factor extracted from the I –V analyses versu forward bias dependence. Three domains named I, II, and III can be distinguished.
Fig. 5. Simulated conduction band diagrams (red) and electron concentration distributions (black) of InGaN/GaN LEDs without (a) and with (b) n-AlGaN at J = 0.1 A⋅cm−2.

Set citation alerts for the article
Please enter your email address
© Copyright 2018-2021 | Chinese Laser Press. All Rights Reserved 沪ICP备15018463号-20