
Qiujie Dong, Xuedong He, Haiyan Ge, Shengzong Zhou. Adaptive Merging Complementary Learners for Visual Tracking Based on Probabilistic Model[J]. Laser & Optoelectronics Progress, 2019, 56(16): 161505
- Laser & Optoelectronics Progress
- Vol. 56, Issue 16, 161505 (2019)
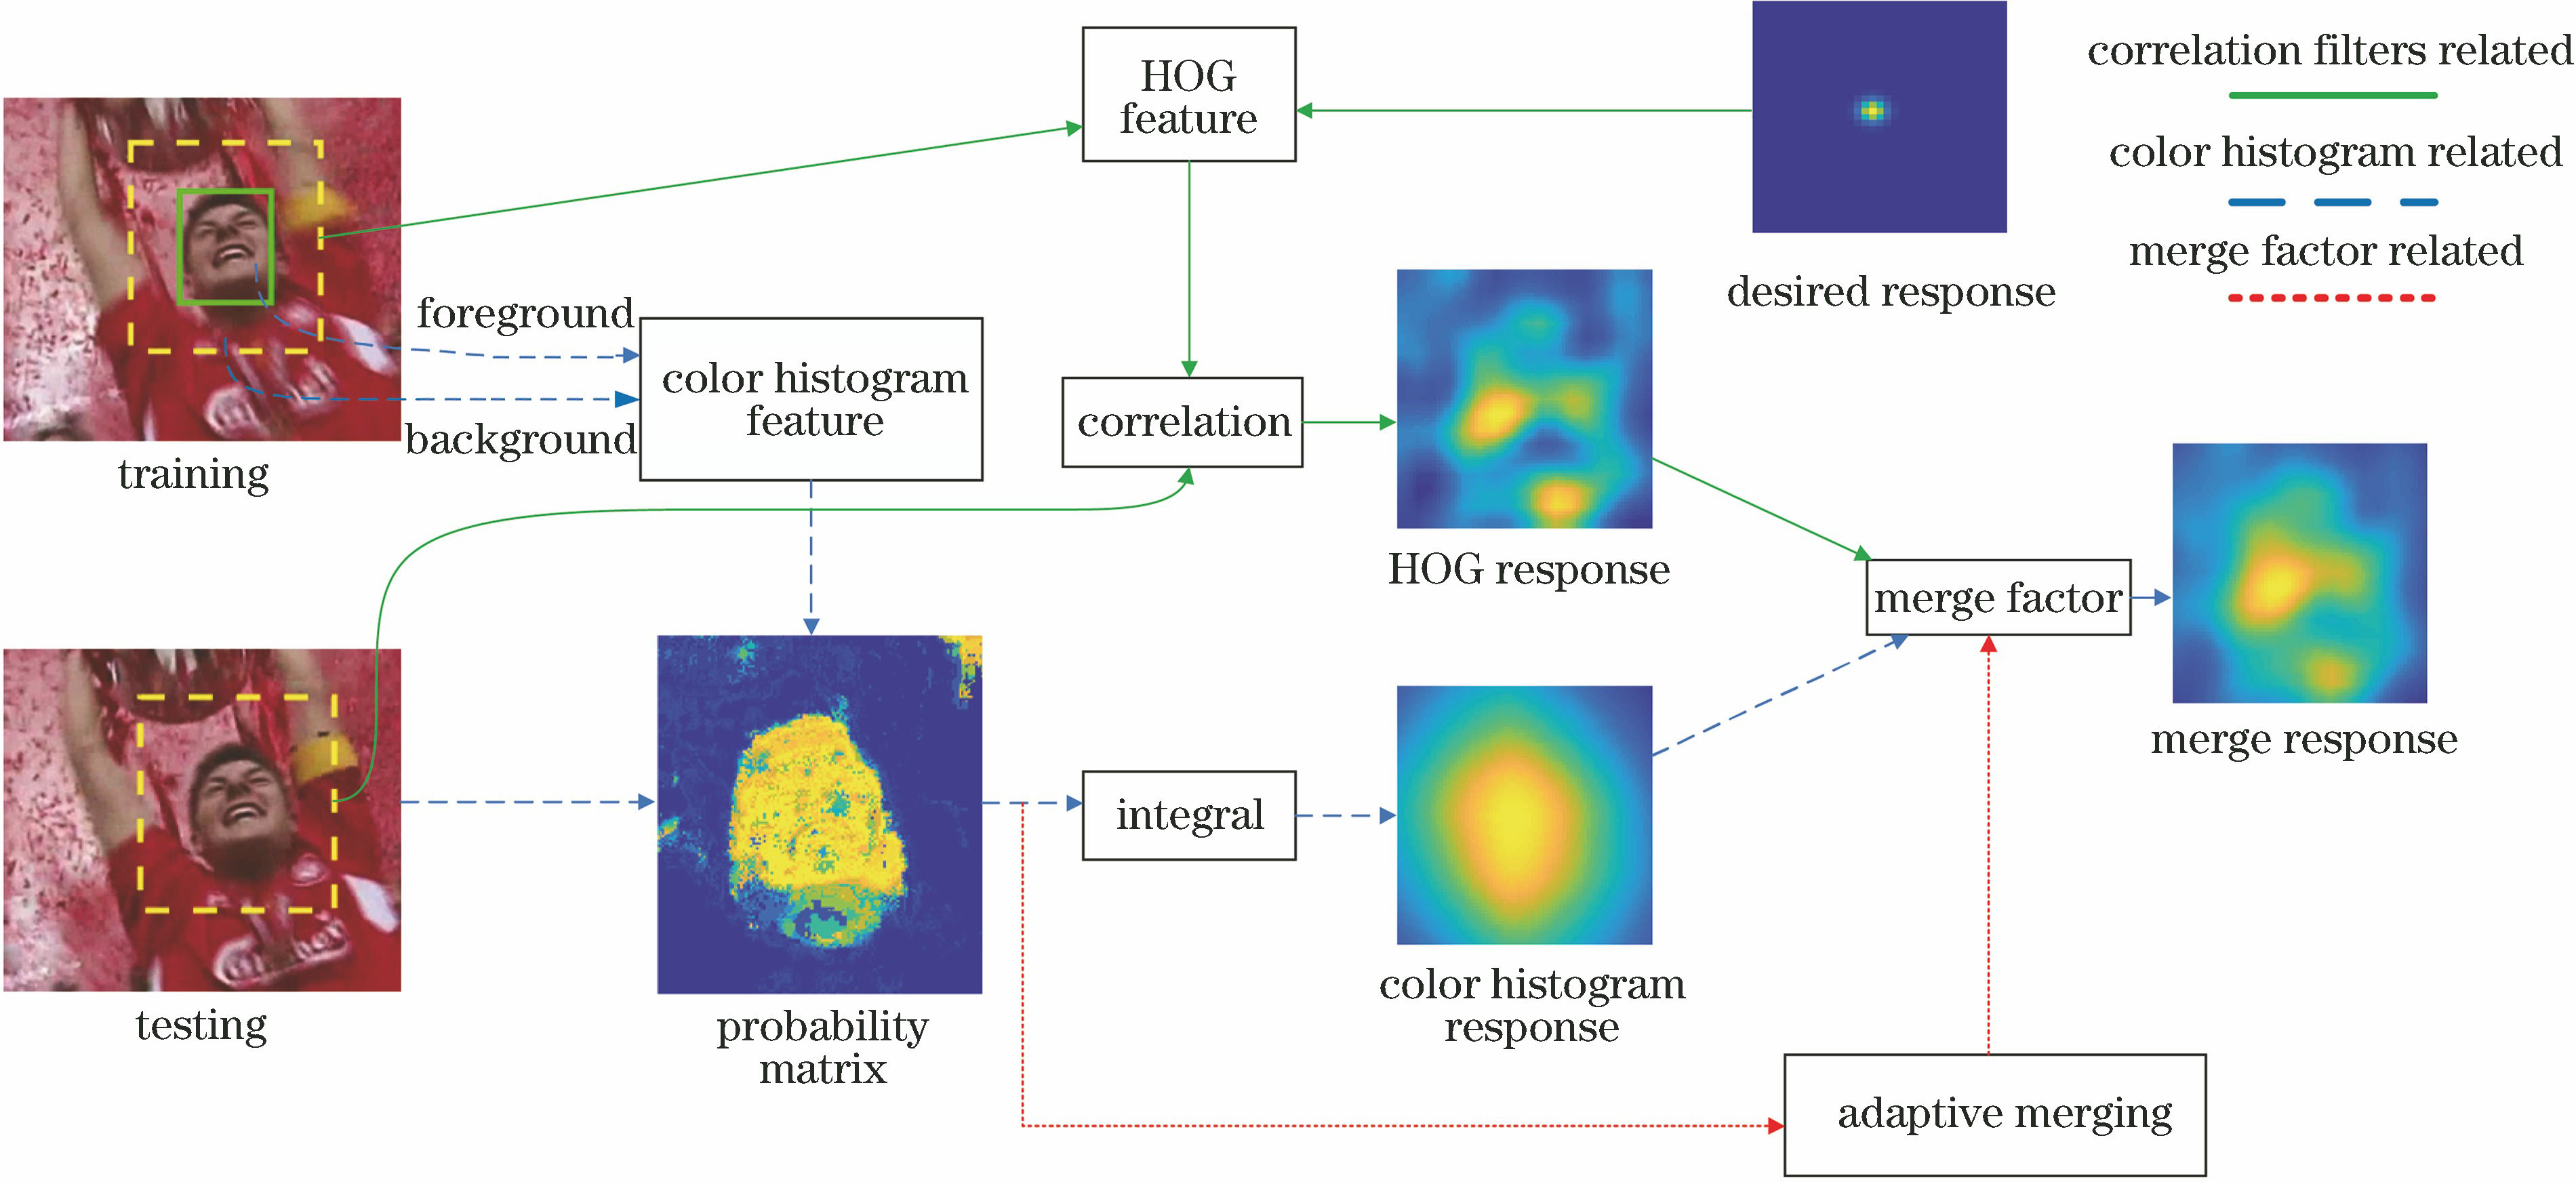
Fig. 1. Framework of amStaple algorithm
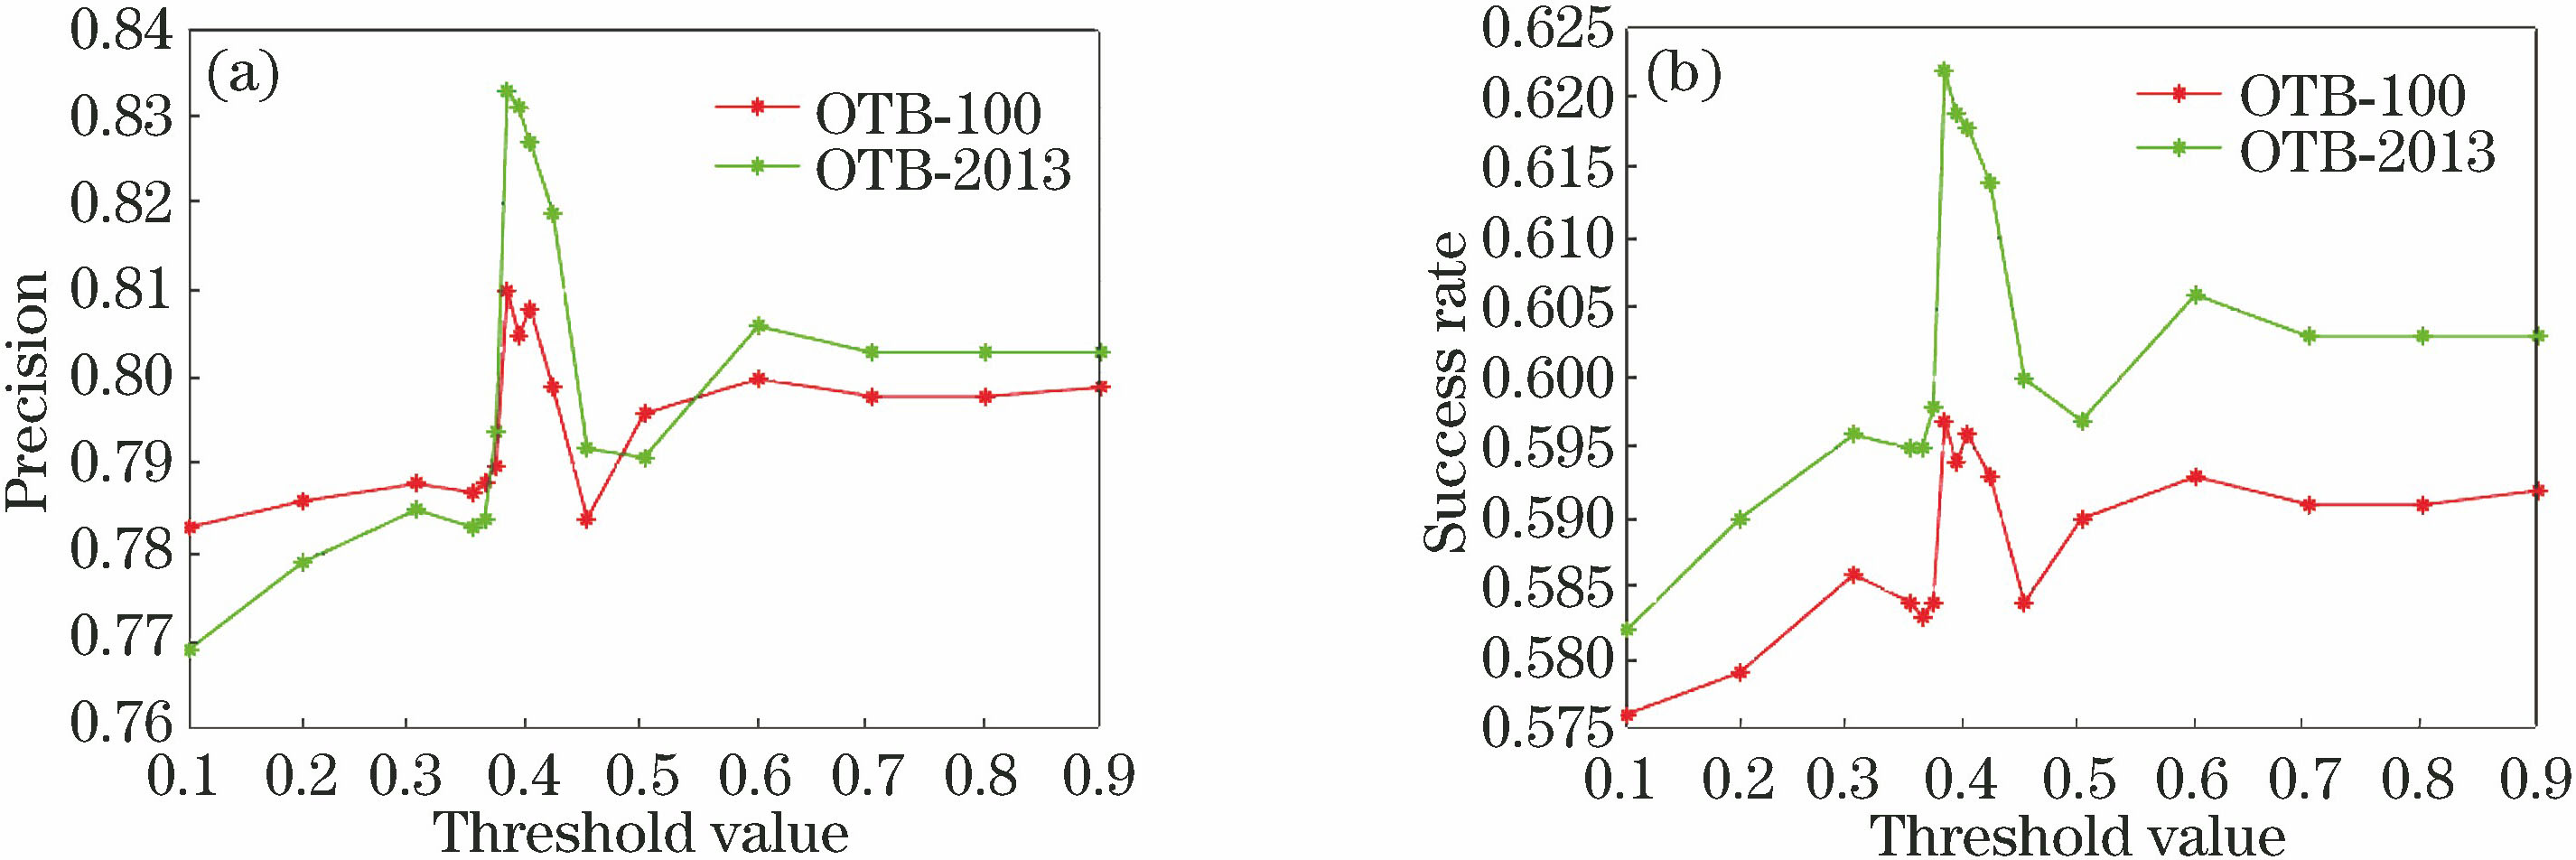
Fig. 2. Tracking results of all thresholds ε on different benchmarks. (a) Precision curves; (b) success rate curves
Fig. 3. Tracking results of nine algorithms on different benchmarks. (a) Precision for OTB-2013 benchmark; (b) success rates for OTB-2013 benchmark; (c) precision for OTB-100 benchmark; (d) success rates for OTB-100 benchmark
Fig. 4. Seven attributes in OTB-100 benchmark sequence where amStaple has best performance. (a) Illumination variation; (b) out-of-plane rotation; (c) occlusion; (d) deformation; (e) in-plane rotation; (f) out-of-view; (g) background clutter
Fig. 5. Qualitative comparison of top three algorithms on ten videos. (a) Bird1; (b) Bolt; (c) ClifBar; (d) coke; (e) dog; (f) dragon baby; (g) shaking; (h) girl; (i) soccer; (j) trellis
Fig. 6. Video attribute success rate curves where amStaple1 performs better than amStaple on different benchmarks. (a) Fast motion for OTB-2013 benchmark; (b) motion blur for OTB-2013 benchmark; (c) low resolution for OTB-2013 benchmark; (d) fast motion for OTB-100 benchmark; (e) motion blur for OTB-100 benchmark; (f) low resolution for OTB-100 benchmark
Fig. 7. Tracking effects of amStaple1 and amStaple in Deer benchmark sequence. Red is amStaple and green is amStaple1
|
Table 1. Basic experimental parameter settings
|
Table 2. Precision and success rates of amStaple and Staple on different benchmarks and percentage increases of amStaple compared to Staple
|
Table 3. Comparison of success rates of amStaple and Staple on different attributes of OTB-100 benchmark

Set citation alerts for the article
Please enter your email address
© Copyright 2018-2021 | Chinese Laser Press. All Rights Reserved 沪ICP备15018463号-20