
Wei Fang, Kui Yang, Haiyuan Li. Propagation-based incremental triangulation for multiple views 3D reconstruction[J]. Chinese Optics Letters, 2021, 19(2): 021101
- Chinese Optics Letters
- Vol. 19, Issue 2, 021101 (2021)
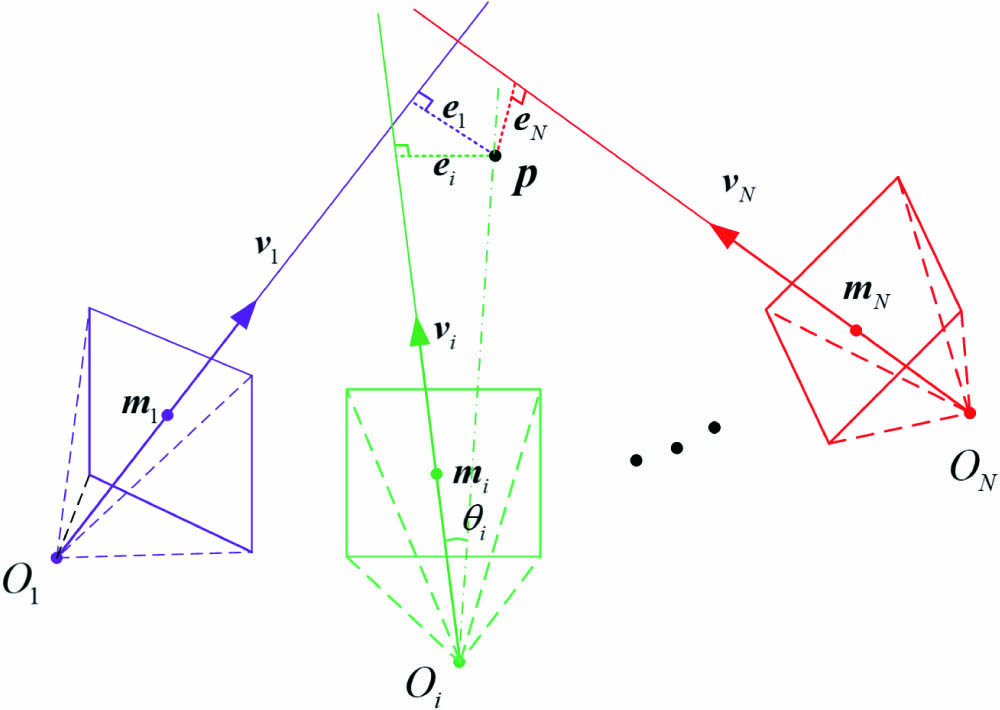
Fig. 1. Geometric indication of multi-view triangulation.
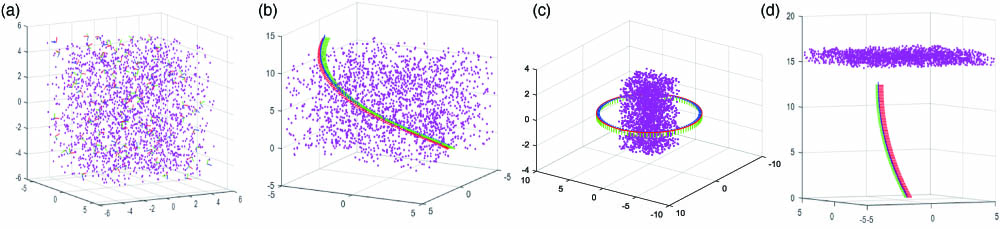
Fig. 2. Four types of synthetic triangulation instances. (a) Type A: cameras and 3D points are randomly distributed; (b) Type B: the camera moves along a curved trajectory around 3D points; (c) Type C: the camera moves on a circle while 3D points are located at the center; (d) Type D: the camera moves along a curved trajectory towards the 3D scene.
Fig. 3. Time and accuracy analysis with different noise levels on Type D synthetic data. (a), (b), and (c) are the results of the time, 3D error, and 2D error when the Gaussian covariance is set as 2 pixels; (d), (e), and (f) are the results of the time, 3D error, and 2D error when the Gaussian covariance is set as 5 pixels; (g), (h), and (i) are the results of the time, 3D error, and 2D error when the Gaussian covariance is set as 8 pixels.
Fig. 4. Overall convergence of INT with different datasets. (a) Convergence curve of Type A dataset; (b) convergence curve of Type B dataset; (c) convergence curve of Type C dataset; (d) convergence curve of Type D dataset.
Fig. 5. INT based on real datasets. (a) Lund Cathedral, (b) Orebro Castle, (c) Ystad Monestary, and (d) Skansen Kronan.
| |||||||||||||||||||||||||||||||||||||||||||||||||||||||||||||||||||||||||||||||
Table 1. Comparisons between Different Incremental Triangulation Performances
| |||||||||||||||||||||||||||||||||||||||||||||||||||||||||||||||||||||||||||||
Table 2. Runtime Comparisons of Different Methods with Real Datasetsa

Set citation alerts for the article
Please enter your email address
© Copyright 2018-2021 | Chinese Laser Press. All Rights Reserved 沪ICP备15018463号-20