• Chinese Optics Letters
  • Vol. 13, Issue 7, 072801 (2015)
Longchao Yao1, Xuecheng Wu1、*, Jing Yang1, Yingchun Wu1、2, Xiang Gao1, Linghong Chen1, Gérard Gréhan2, and Kefa Cen1
Author Affiliations
  • 1State Key Laboratory of Clean Energy Utilization, Zhejiang University, Hangzhou 310027, China
  • 2UMR 6614/CORIA, CNRS, Normandie Université, BP12 76801 Saint Etienne du Rouvray, France
  • show less
    DOI: 10.3788/COL201513.072801 Cite this Article Set citation alerts
    Longchao Yao, Xuecheng Wu, Jing Yang, Yingchun Wu, Xiang Gao, Linghong Chen, Gérard Gréhan, Kefa Cen. Simultaneous 3D temperature and velocity field measurements of micro-flow with laser-induced fluorescence and micro-digital holographic particle tracking velocimetry: Numerical study[J]. Chinese Optics Letters, 2015, 13(7): 072801 Copy Citation Text show less
    Integrated two-color LIF and micro-DHPTV system.
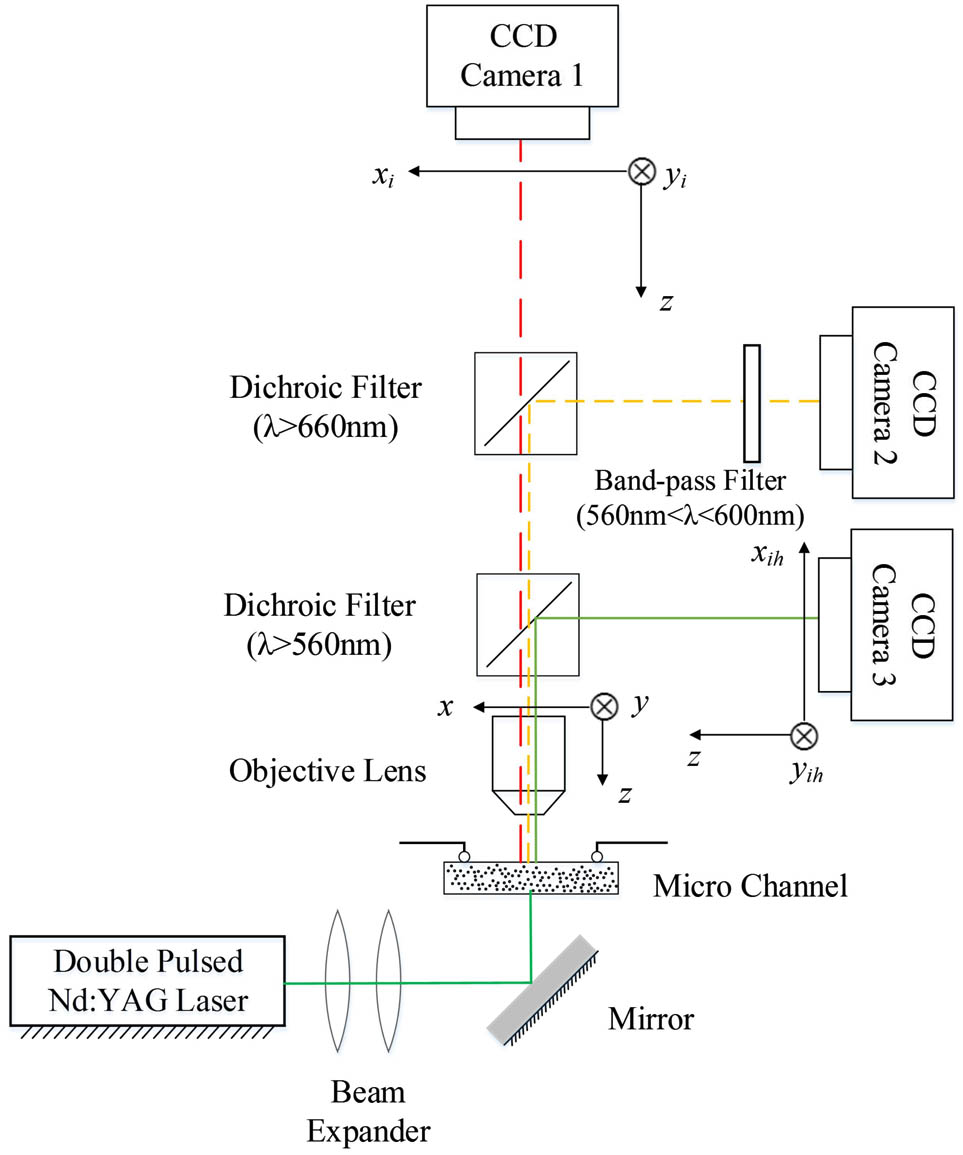
    Fig. 1. Integrated two-color LIF and micro-DHPTV system.
    Defocused fluorescent particle: (a) experimental images, calibrated magnification of 15.1; (b) simulated images; (c) intensity distribution at z=−40 μm; (d) intensity distribution at z=30 μm. Each image is 106 pixels×106 pixels, 6.45 μm/pixel at the imaging plane.
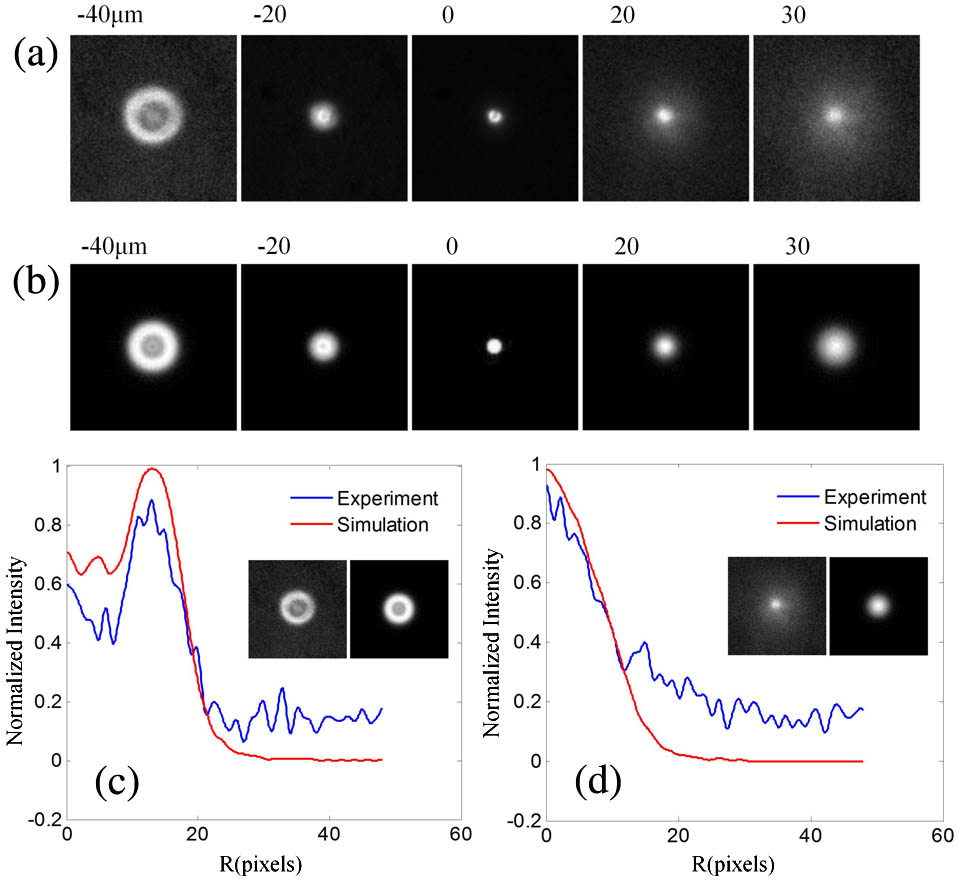
    Fig. 2. Defocused fluorescent particle: (a) experimental images, calibrated magnification of 15.1; (b) simulated images; (c) intensity distribution at z=40μm; (d) intensity distribution at z=30μm. Each image is 106pixels×106pixels, 6.45 μm/pixel at the imaging plane.
    Simulation images of 30 tracer particles: (a) fluorescence image of RhB; (b) fluorescence image of SRh101; (c) hologram of the first frame; (d) hologram of the second frame.
    Fig. 3. Simulation images of 30 tracer particles: (a) fluorescence image of RhB; (b) fluorescence image of SRh101; (c) hologram of the first frame; (d) hologram of the second frame.
    Particle position and displacement errors: (a) position error; (b) displacement error.
    Fig. 4. Particle position and displacement errors: (a) position error; (b) displacement error.
    Intensity ratio at different z positions.
    Fig. 5. Intensity ratio at different z positions.
    Velocity distribution and temperature distribution of the flow field: (a) velocity distribution; (b) temperature distribution.
    Fig. 6. Velocity distribution and temperature distribution of the flow field: (a) velocity distribution; (b) temperature distribution.
    Visualization of 3D temperature and velocity field.
    Fig. 7. Visualization of 3D temperature and velocity field.
    ItemDescriptionParameter
    Velocityux=u0r02(r02y2z2)u0=0.07m/sr0=75μmΔt=100μs
    TemperatureT=T0+axx0T0=40°Cx0=60μma=1/3
    Dye 1RhBTemperature sensitivity 1.5%/°C[7]
    Dye 2SRh101Temperature sensitivity 0.17%/°C[7]
    Table 1. Parameters of the Numerical Test
    Longchao Yao, Xuecheng Wu, Jing Yang, Yingchun Wu, Xiang Gao, Linghong Chen, Gérard Gréhan, Kefa Cen. Simultaneous 3D temperature and velocity field measurements of micro-flow with laser-induced fluorescence and micro-digital holographic particle tracking velocimetry: Numerical study[J]. Chinese Optics Letters, 2015, 13(7): 072801
    Download Citation