• Chinese Optics Letters
  • Vol. 18, Issue 7, 071201 (2020)
Pan Dai1、2, Yu Zhou1、2, Leilei Wang1、2, Shangjing Liu1、2, Xuping Zhang1、2, and Xiangfei Chen1、2、*
Author Affiliations
  • 1Key Laboratory of Intelligent Optical Sensing and Manipulation of the Ministry of Education, Institute of Optical Communication Engineering, Nanjing University, Nanjing 210093, China
  • 2National Laboratory of Solid State Microstructures, College of Engineering and Applied Sciences, Nanjing University, Nanjing 210093, China
  • show less
    DOI: 10.3788/COL202018.071201 Cite this Article Set citation alerts
    Pan Dai, Yu Zhou, Leilei Wang, Shangjing Liu, Xuping Zhang, Xiangfei Chen. Demodulation of the multi-peak fiber Bragg grating sensor based on partial wavelength scan[J]. Chinese Optics Letters, 2020, 18(7): 071201 Copy Citation Text show less
    Schematic structure of the constructed FBG with multiple peaks.
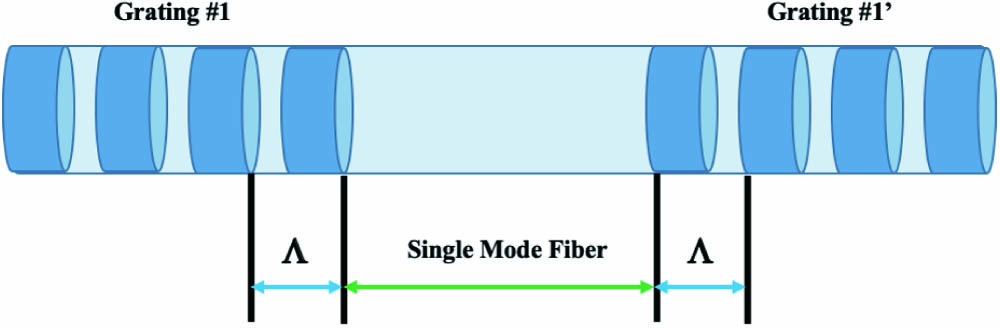
    Fig. 1. Schematic structure of the constructed FBG with multiple peaks.
    Schematic reflection spectrum of the multi-peak FBG at position-0, and the principle of the peak tracking algorithm with a sampling interval that contains three adjacent local peaks at position-1.
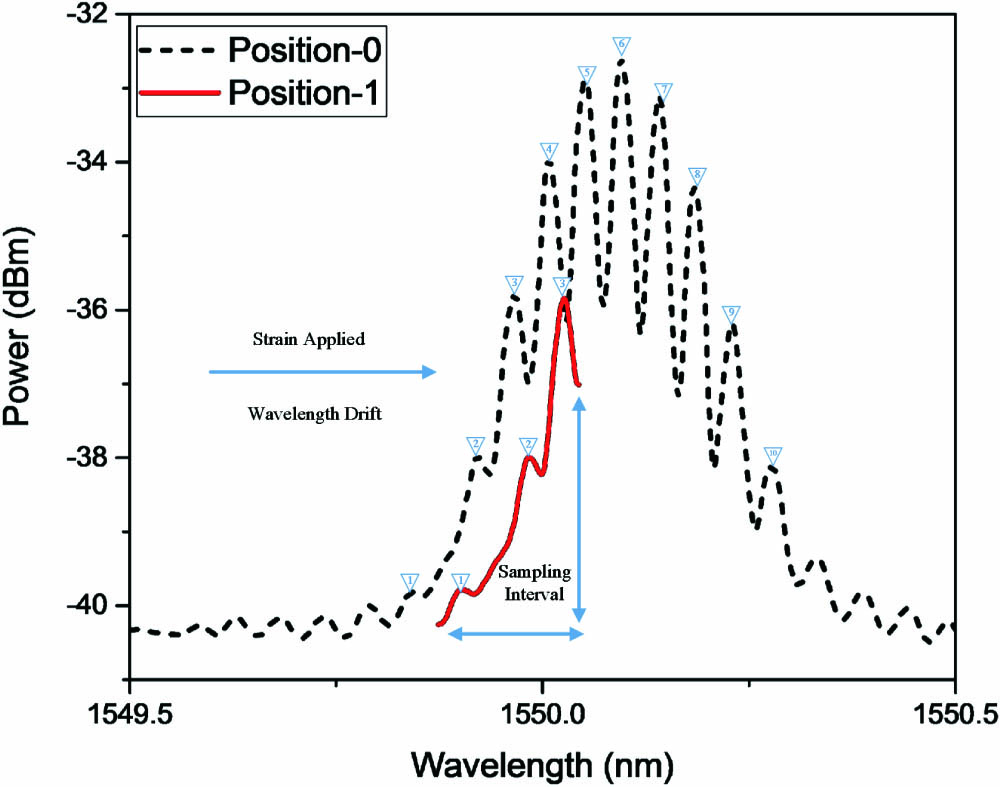
    Fig. 2. Schematic reflection spectrum of the multi-peak FBG at position-0, and the principle of the peak tracking algorithm with a sampling interval that contains three adjacent local peaks at position-1.
    Schematic of the demodulation process of the multi-peak FBG strain sensor.
    Fig. 3. Schematic of the demodulation process of the multi-peak FBG strain sensor.
    (a) Schematic of the multi-peak FBG strain experiment setup and (b) the demodulating relationship between its wavelength and the strain applied.
    Fig. 4. (a) Schematic of the multi-peak FBG strain experiment setup and (b) the demodulating relationship between its wavelength and the strain applied.
    Schematic of constructing the asymmetrical multi-peak FBG through two segments of different gratings.
    Fig. 5. Schematic of constructing the asymmetrical multi-peak FBG through two segments of different gratings.
    Reflection spectrum of the asymmetrical multi-peak FBG at position-0 and two partial scan examples at position-1.
    Fig. 6. Reflection spectrum of the asymmetrical multi-peak FBG at position-0 and two partial scan examples at position-1.
    The multi-peak FBG sensing system’s experimental demodulation (Group-7 & Group-20) relationship between its strain and wavelength using (a) the left dense peaks at the left side of spectrum and (b) the relative sparse peak peaks at the right side of spectrum.
    Fig. 7. The multi-peak FBG sensing system’s experimental demodulation (Group-7 & Group-20) relationship between its strain and wavelength using (a) the left dense peaks at the left side of spectrum and (b) the relative sparse peak peaks at the right side of spectrum.
    Group No.Coordinates ICoordinates IICoordinates III
    GroupR-1(0 nm, 0 dB)(0.080 nm, 1.833 dB)(0.044 nm, 2.179 dB)
    GroupR-2(0 nm, 0 dB)(0.044 nm, 2.179 dB)(0.042 nm, 1.833 dB)
    GroupR-3(0 nm, 0 dB)(0.042 nm, 1.833 dB)(0.044 nm, 1.080 dB)
    GroupR-4(0 nm, 0 dB)(0.044 nm, 1.080 dB)(0.042 nm, 0.276 dB)
    GroupR-5(0 nm, 0 dB)(0.042 nm, 0.276 dB)(0.048 nm, −0.490 dB)
    GroupR-6(0 nm, 0 dB)(0.048 nm, −0.490 dB)(0.042 nm, −1.248 dB)
    GroupR-7(0 nm, 0 dB)(0.042 nm, −1.248 dB)(0.046 nm, −1.836 dB)
    GroupR-8(0 nm, 0 dB)(0.046 nm, −1.836 dB)(0.048 nm, −1.931 dB)
    Table 1. Dataset of 8 Groups’ Relative Coordinates at Position-0
     Sampling Peak1 (με)Sampling Peak2 (με)Sampling Peak3 (με)Actual Strain (με)Average Deviation (%)
    Strain 11571.971575.851572.7616001.65
    Strain 21697.461699.381700.2217281.68
    Strain 32315.112320.952317.8623682.11
    Table 2. Deviation Analysis of this Demodulation System when Extra Unknown Strain is Applied
    Group No.Coordinate IVCoordinate V
    GroupR-1(0.019 nm, −4.097 dB)(0.025 nm, 5.899 dB)
    GroupR-2(0.022 nm, −3.895 dB)(0.022 nm, 5.444 dB)
    GroupR-3(0.019 nm, −4.023 dB)(0.023 nm, 4.975 dB)
    GroupR-4(0.022 nm, −4.273 dB)(0.024 nm, 5.480 dB)
    GroupR-5(0.019 nm, −3.925 dB)(0.026 nm, 6.252 dB)
    GroupR-6(0.020 nm, −3.293 dB)(0.025 nm, 6.128 dB)
    GroupR-7(0.016 nm, −3.078 dB)(0.023 nm, 5.448 dB)
    GroupR-8(0.019 nm, −2.862 dB)(0.025 nm, 4.706 dB)
    GroupR-9(0.017 nm, −2.803 dB)(0.022 nm, 4.298 dB)
    GroupR-10(0.020 nm, −3.081 dB)(0.020 nm, 4.259 dB)
    GroupR-11(0.019 nm, −3.325 dB)(0.022 nm, 4.193 dB)
    GroupR-12(0.019 nm, −3.280 dB)(0.020 nm, 3.767 dB)
    GroupR-13(0.020 nm, −2.874 dB)(0.021 nm, 3.047 dB)
    GroupR-14(0.017 nm, −2.355 dB)(0.020 nm, 2.166 dB)
    GroupR-15(0.022 nm, −1.873 dB)(0.019 nm, 1.340 dB)
    GroupR-16(0.023 nm, −1.614 dB)(0.018 nm, 0.707 dB)
    GroupR-17(0.027 nm, −1.945 dB)(0.012 nm, 0.526 dB)
    GroupR-18(0.027 nm, −2.758 dB)(0.015 nm, 0.610 dB)
    GroupR-19(0.027 nm, −4.042 dB)(0.012 nm, 0.687 dB)
    GroupR-20(0.028 nm, −5.719 dB)(0.011 nm, 0.784 dB)
    GroupR-21(0.027 nm, −7.433 dB)(0.011 nm, 0.947 dB)
    GroupR-22(0.019 nm, −3.656 dB)(0.016 nm, 1.684 dB)
    Table 3. Dataset of 22 Groups’ Relative Coordinates at Position-0
     Peak III (με)Average Strain (με)Actual Strain (με)Average Error (%)
    Strain 11176.6 1174.72 1178 0.28
    Strain 21235.1 1235.51 1240 0.36
    Strain 31415.2 1417.89 1426 0.57
    Table 4. Demodulation Deviation Between Extra Strain Predicted and Actually Applied to the FBG Sensor
    Pan Dai, Yu Zhou, Leilei Wang, Shangjing Liu, Xuping Zhang, Xiangfei Chen. Demodulation of the multi-peak fiber Bragg grating sensor based on partial wavelength scan[J]. Chinese Optics Letters, 2020, 18(7): 071201
    Download Citation