• Chinese Optics Letters
  • Vol. 18, Issue 7, 071201 (2020)
Pan Dai1、2, Yu Zhou1、2, Leilei Wang1、2, Shangjing Liu1、2, Xuping Zhang1、2, and Xiangfei Chen1、2、*
Author Affiliations
  • 1Key Laboratory of Intelligent Optical Sensing and Manipulation of the Ministry of Education, Institute of Optical Communication Engineering, Nanjing University, Nanjing 210093, China
  • 2National Laboratory of Solid State Microstructures, College of Engineering and Applied Sciences, Nanjing University, Nanjing 210093, China
  • show less
    DOI: 10.3788/COL202018.071201 Cite this Article Set citation alerts
    Pan Dai, Yu Zhou, Leilei Wang, Shangjing Liu, Xuping Zhang, Xiangfei Chen. Demodulation of the multi-peak fiber Bragg grating sensor based on partial wavelength scan[J]. Chinese Optics Letters, 2020, 18(7): 071201 Copy Citation Text show less

    Abstract

    Until now, a high-efficiency demodulation method for fiber Bragg grating (FBG) sensors has been a challenge. In this Letter, by employing multi-peak FBGs, an FBG sensor with a partial wavelength scan is proposed and initially demonstrated. By demodulating a near-symmetrical multi-peak FBG and an asymmetrical multi-peak FBG in the strain experiment, sensor sensitivities of 1.02 pm/με and 1.01 pm/με are measured for the interrogation system, respectively. The average demodulation deviations for the two sensors are 1.81% and 0.4%, respectively. The proposed method is expected to realize high-efficiency and low-cost FBG interrogators.

    With the rapid development of modern fiber-optic technology[1], fiber Bragg grating (FBG) sensors have attracted much interest for their merits of high multiplexing capacity[2], light weight, compact size, chemical stability, and electromagnetic interference immunity[3]. Specifically, various FBG-based sensing systems have been widely applied to the fields of aerospace[4], transportation[5], and structural health monitoring of infrastructures (e.g.,  pipelines[6], dams[7], and bridges[8]) for measuring parameters like strain[8,9], temperature[9,10], pressure[10,11], vibration[12], and humidity[13]. Meanwhile, many FBG sensing interrogation approaches have been developed such as edge filtering[14], matching grating[15], tunable Fabry–Perot (F–P) filter[16], and unbalanced Mach–Zehnder (M–Z) interferometer[17]. The accuracy of the edge filtering method is restricted by the stability of the filters. Since the sensing grating and referenced grating cannot have completely consistent characteristics, the matching grating method encounters many uncertainties in actual situations. When increasing the scanning frequency, the tunable F-P filter method can be influenced by its nonlinearity and non-repeatability, which leads to the decrease of demodulation precision and the side-mode suppression ratio (SMSR) of the signal. The unbalanced M–Z interferometer method is only appropriate for measuring dynamic strain instead of static strain since it can be sensitively influenced by the environment. Typically, a full spectrum scan is required to track the peaks of FBGs for sensing, which may lead to low efficiency in demodulation. However, if the peaks can be tracked just based on a partial scan, the efficiency will then be increased. For example, wavelength-swept tunable lasers (TLs) are often used to find the peaks of FBGs because of the high signal-to-noise ratio (SNR). The sweeping speed of TLs has significantly improved in the past years. The New Focus™ Venturi™ TLB-8800 can continuously sweep within the whole C band with the maximum sweeping speed up to 20,000 nm/s. Some fiber wavelength-swept TLs[18,19] with a wide range of ∼180 nm and a fast speed of ∼200 kHz have also been proposed. Unfortunately, there is still not an ideal TL source for FBG sensors at present in terms of compact size and low cost. The fiber TL[20] using a piezoelectric ceramic transducer (PZT)-based tunable filter[21] is limited by its high drive voltage, mechanical stability, and cost. Although the compact semiconductor TL may be a good laser source, the inherent mode hopping may limit its sweep speed, which may be slowed down to the magnitude of seconds for a full scan. Therefore, a high-efficiency FBG interrogation system is still being pursued.

    In the present Letter, a partial-wavelength-scan multi-peak FBG sensor is proposed and initially tested. Compared with conventional wavelength-swept systems, the proposed system can obtain the FBG wavelength shift via scanning a small part of the spectrum, which is expected to improve the scan efficiency. Several proof-of-concept experiments are conducted to prove the accuracy of the measuring system, and experimental results show a good agreement with the theoretical analysis. The proposed method may break the efficiency bottleneck in FBG sensors, which will be very beneficial for high-speed, compact, and low-cost FBG interrogators in the future.

    If the FBG has multiple reflection peaks, then theoretically arbitrary peaks can be used for sensing through measuring the peak wavelength drift. However, in actual systems, the demodulating measurement cannot be performed through tracking only one peak because the same peak’s position under different strains cannot be accurately identified. Therefore, one simple solution is to track several peaks and compare their wavelength intervals as well as power differences.

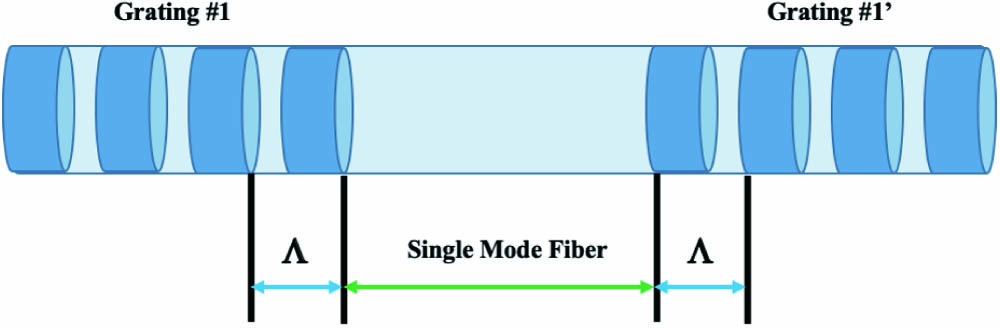
    Since a uniform FBG has only one reflection peak, we use two segments of FBGs and a piece of fiber to form a distributed Bragg reflection (DBR) structure and realize a near-symmetrical multi-peak reflection spectrum in the experiment. As shown in Fig. 1, to fabricate the sensor, we first use the fiber cleaver to cut an FBG with a central wavelength of 1550.094 nm and then use the fiber fusion splicer to connect a single mode fiber (SMF) between the two cleaved gratings. The fiber is about 2.2 cm long, and multiple resonant peaks can occur because of the roundtrip resonance in the DBR cavity[22,23].

    Schematic structure of the constructed FBG with multiple peaks.

    Figure 1.Schematic structure of the constructed FBG with multiple peaks.

    As the dash line shown in Fig. 2, we measure the reflection spectrum of the FBG with no strain and denote it as position-0. By constructing this multi-peak FBG, it is easier for us to accurately identify the positions of different peaks and track the wavelength drifts of the FBG strain sensor since its spectral contour is nearly unchanged under different strains.

    Schematic reflection spectrum of the multi-peak FBG at position-0, and the principle of the peak tracking algorithm with a sampling interval that contains three adjacent local peaks at position-1.

    Figure 2.Schematic reflection spectrum of the multi-peak FBG at position-0, and the principle of the peak tracking algorithm with a sampling interval that contains three adjacent local peaks at position-1.

    Figure 2 shows that ten continuous local peaks of the FBG spectrum are marked from Peak-1 to Peak-N (here N=10). The ten selected peaks are categorized into eight groups that include their relative wavelength-power coordinates from the first peak within each group. Table 1 shows the dataset at position-0 and each group contains three peaks, which are GroupR-1 (Peak1-Peak1, Peak2-Peak1, Peak3-Peak2), GroupR-2 (Peak2-Peak2, Peak3-Peak2, Peak4-Peak3), …, and GroupR-8 (Peak8-Peak8, Peak9-Peak8, Peak10-Peak9). It should be noted that each group’s relative coordinates are unique so that the position of marked peaks can be identified. By tracking the few peaks under strain and comparing with the original positions before shift, the strain can then be obtained.

    Group No.Coordinates ICoordinates IICoordinates III
    GroupR-1(0 nm, 0 dB)(0.080 nm, 1.833 dB)(0.044 nm, 2.179 dB)
    GroupR-2(0 nm, 0 dB)(0.044 nm, 2.179 dB)(0.042 nm, 1.833 dB)
    GroupR-3(0 nm, 0 dB)(0.042 nm, 1.833 dB)(0.044 nm, 1.080 dB)
    GroupR-4(0 nm, 0 dB)(0.044 nm, 1.080 dB)(0.042 nm, 0.276 dB)
    GroupR-5(0 nm, 0 dB)(0.042 nm, 0.276 dB)(0.048 nm, −0.490 dB)
    GroupR-6(0 nm, 0 dB)(0.048 nm, −0.490 dB)(0.042 nm, −1.248 dB)
    GroupR-7(0 nm, 0 dB)(0.042 nm, −1.248 dB)(0.046 nm, −1.836 dB)
    GroupR-8(0 nm, 0 dB)(0.046 nm, −1.836 dB)(0.048 nm, −1.931 dB)

    Table 1. Dataset of 8 Groups’ Relative Coordinates at Position-0

    The following peak relative value (PRV) is defined to identify the peak groups. To be specific, the minimum PRV can be utilized to match the measured groups with their original groups at position-0, where i is the order of peaks in each group, Xmeasure and Ymeasure are the relative coordinates of the sampling interval peaks, and Xreference, Yreference, Y1, and Y2 are related to Table 1 at position-0, respectively. When the minimum PRV is obtained, the spectrum wavelength shift can then be determined.

    In the experiment, a total of 22 different strains are applied to the FBG sensor, and the results are shown in Figs. 3 and 4. The measurement system is configured as Fig. 4(a) in our strain experiment. It comprises a TL, a circulator, a precisely moving stage which contains the multi-peak FBG, a photodetector (PD), and a laptop to execute the multi-peak tracking algorithm. The optical source is first launched into the FBG sensor through the circulator. Subsequently, the external strain applied to the FBG can be adjusted accordingly by controlling the displacement knob. The FBG’s reflection spectral power data is then measured by the PD. Finally, the datasets of the TL wavelength and the corresponding FBG reflection power measured by the PD are sent to the laptop for multi-peak tracking algorithm processing and the related wavelength drift results are then calculated. The strain and FBG wavelength fit well in a linear relationship with the average slope (FBG strain sensitivity) of 1.02 pm/με, which is well consistent with the hypothesis that the spectral profiles are nearly unchanged under different strains. Table 2 shows the measurement result of the deviations from actual strain values, which can demonstrate that the proposed FBG sensor is valid with an average measurement deviation of only 1.81%.

    Schematic of the demodulation process of the multi-peak FBG strain sensor.

    Figure 3.Schematic of the demodulation process of the multi-peak FBG strain sensor.

    (a) Schematic of the multi-peak FBG strain experiment setup and (b) the demodulating relationship between its wavelength and the strain applied.

    Figure 4.(a) Schematic of the multi-peak FBG strain experiment setup and (b) the demodulating relationship between its wavelength and the strain applied.

     Sampling Peak1 (με)Sampling Peak2 (με)Sampling Peak3 (με)Actual Strain (με)Average Deviation (%)
    Strain 11571.971575.851572.7616001.65
    Strain 21697.461699.381700.2217281.68
    Strain 32315.112320.952317.8623682.11

    Table 2. Deviation Analysis of this Demodulation System when Extra Unknown Strain is Applied

    To further increase the accuracy of the proposed sensor system and test its reliability, we then construct and test another multi-peak FBG sensor with different peak densities based on a partial spectral scan and a modified tracking algorithm. Such an asymmetrical multi-peak FBG can be formed by another DBR structure via connecting two different short FBGs (one is an annealed FBG with a central wavelength of 1549.67 nm and the other is a non-annealed FBG with a central wavelength of 1549.812 nm), as shown in Fig. 5.

    Schematic of constructing the asymmetrical multi-peak FBG through two segments of different gratings.

    Figure 5.Schematic of constructing the asymmetrical multi-peak FBG through two segments of different gratings.

    The reflection spectrum of the asymmetrical multi-peak FBG in a natural state is shown in Fig. 6, which is denoted as position-0 in this experiment. The total length of the constructed FBG is 3.23 cm. Specifically, there are totally 24 local peaks (marked as inverted triangles) and 23 local valleys (marked as triangles) within the experimental selected span. Generally, there are plenty of methods to achieve the wavelength shift, and even one peak and one valley can be used for sensing. Here, we define a type of group containing 3 peaks and 2 valleys. The spectrum can be categorized into 22 peak-valley groups, which are Group-1 (Peak1, Valley1, Peak2, Valley2, Peak3), Group-2 (Peak2, Valley2, Peak3, Valley3, Peak4), …, Group-22 (Peak22, Valley22, Peak23, Valley23, Peak24), respectively. The relative distribution of peaks and valleys in each group is nearly identical when the wavelength of the FBG is changed, and it is also unique and different from others. When an unknown group is scanned, it can be identified based on its relative distribution of peaks and valleys. Then we re-define the above Group as GroupR according to the relative distribution of peaks and valleys. For example, GroupR-1 is (Peak1-Peak1, Valley1-Peak1, Peak2-Valley1, Valley2-Peak2, Peak3-Valley2) and GroupR-2 is (Peak2-Peak2, Valley2-Peak2, Peak3-Valley2, Valley3-Peak3, Peak4-Valley3), respectively. All the results are saved in Table 3 after executing the above-mentioned relative coordinates calculations.

    Reflection spectrum of the asymmetrical multi-peak FBG at position-0 and two partial scan examples at position-1.

    Figure 6.Reflection spectrum of the asymmetrical multi-peak FBG at position-0 and two partial scan examples at position-1.

    Group No.Coordinate IVCoordinate V
    GroupR-1(0.019 nm, −4.097 dB)(0.025 nm, 5.899 dB)
    GroupR-2(0.022 nm, −3.895 dB)(0.022 nm, 5.444 dB)
    GroupR-3(0.019 nm, −4.023 dB)(0.023 nm, 4.975 dB)
    GroupR-4(0.022 nm, −4.273 dB)(0.024 nm, 5.480 dB)
    GroupR-5(0.019 nm, −3.925 dB)(0.026 nm, 6.252 dB)
    GroupR-6(0.020 nm, −3.293 dB)(0.025 nm, 6.128 dB)
    GroupR-7(0.016 nm, −3.078 dB)(0.023 nm, 5.448 dB)
    GroupR-8(0.019 nm, −2.862 dB)(0.025 nm, 4.706 dB)
    GroupR-9(0.017 nm, −2.803 dB)(0.022 nm, 4.298 dB)
    GroupR-10(0.020 nm, −3.081 dB)(0.020 nm, 4.259 dB)
    GroupR-11(0.019 nm, −3.325 dB)(0.022 nm, 4.193 dB)
    GroupR-12(0.019 nm, −3.280 dB)(0.020 nm, 3.767 dB)
    GroupR-13(0.020 nm, −2.874 dB)(0.021 nm, 3.047 dB)
    GroupR-14(0.017 nm, −2.355 dB)(0.020 nm, 2.166 dB)
    GroupR-15(0.022 nm, −1.873 dB)(0.019 nm, 1.340 dB)
    GroupR-16(0.023 nm, −1.614 dB)(0.018 nm, 0.707 dB)
    GroupR-17(0.027 nm, −1.945 dB)(0.012 nm, 0.526 dB)
    GroupR-18(0.027 nm, −2.758 dB)(0.015 nm, 0.610 dB)
    GroupR-19(0.027 nm, −4.042 dB)(0.012 nm, 0.687 dB)
    GroupR-20(0.028 nm, −5.719 dB)(0.011 nm, 0.784 dB)
    GroupR-21(0.027 nm, −7.433 dB)(0.011 nm, 0.947 dB)
    GroupR-22(0.019 nm, −3.656 dB)(0.016 nm, 1.684 dB)

    Table 3. Dataset of 22 Groups’ Relative Coordinates at Position-0

    In order to locate the corresponding position of the partial-scan spectrum at position-0, we use Table 3 as the reference dataset to compute the PRV between the measurement data with strain and the reference data without strain. The modified PRV is defined as where i is the order of five characteristic relative coordinates, Xmeasure and Ymeasure are the relative coordinates of the sample group (SG), and Xreference and Yreference are related to the reference dataset in Table 3, respectively. Then, when the PRV is minimum, the wavelength shift can be determined. Based on the measurement of GroupR-x (x=1,2,,22), we can find the minimum PRV and determine the corresponding value of x. The wavelength shift is then obtained. In Fig. 6, for the left side of the reflection peaks the peaks are dense, and for the right side the peaks are sparse. Figure 7 shows the calculation results and it shows that the results of both sides are all accurate enough for demodulation.

    The multi-peak FBG sensing system’s experimental demodulation (Group-7 & Group-20) relationship between its strain and wavelength using (a) the left dense peaks at the left side of spectrum and (b) the relative sparse peak peaks at the right side of spectrum.

    Figure 7.The multi-peak FBG sensing system’s experimental demodulation (Group-7 & Group-20) relationship between its strain and wavelength using (a) the left dense peaks at the left side of spectrum and (b) the relative sparse peak peaks at the right side of spectrum.

    As the numerical results show in Table 4, the proposed system has a good performance to demodulate the wavelength shift when the extra strain is also applied to the sensor.

     Peak III (με)Average Strain (με)Actual Strain (με)Average Error (%)
    Strain 11176.6 1174.72 1178 0.28
    Strain 21235.1 1235.51 1240 0.36
    Strain 31415.2 1417.89 1426 0.57

    Table 4. Demodulation Deviation Between Extra Strain Predicted and Actually Applied to the FBG Sensor

    Generally, in actual measurement, one of the solutions using multi-peak FBG sensors is that first a coarse scan is done quickly to find the range of high refection parts, and then a conventional fine scan is performed to track the reflection peaks within the range. Thus, the total scan efficiency can be increased significantly.

    It is considered good for FBG interrogation to use TLs. However, the existing TLs still have limitations in cost and performance. To solve these problems, one effort is to use multi-peak FBG sensors to reduce the scanning range, which may lead to having more freedom in the selection of TLs. Compared with traditional interrogation systems, the proposed demodulation system is more simplified and has significant potential applications in low-cost and compact-size commercial fields. However, it still has much room for improvement in its present form, and the demodulation accuracy needs to be more accurate. From the strain experimental results, the proposed demodulation method is promising for improving the demodulation efficiency. The initial positive result provides the possibility for a compact and low-cost FBG interrogator based on integrated tunable DFB-laser array[24,25] in the future.

    In summary, a novel wavelength-swept laser-based FBG sensor is proposed and initially examined. Through employing multi-peak FBGs, the wavelength shift can be demodulated by only partially scanning the FBG reflection spectrum, which will shorten the scanning time and reduce the demodulation cost. For conventional simple FBG[26,27] demodulation, which utilizes the fast-scanning TL, it requires the sweep of a relatively broad wavelength range (typically ∼2 nm for an FBG sensor). Compared with the traditional simple FBG, our proposed multi-peak FBG scheme has a similar sensitivity (∼1 pm/με for strain sensing) while it can be efficiently demodulated within a shorter wavelength scan range. Thus, the efficiency can be increased significantly, which may lead to a reliable, compact, rapid, and stable FBG interrogation system in the future.

    References

    [1] T. Nagatsuma, G. Ducournau, C. C. Renaud. Nat. Photonics, 10, 371(2016).

    [2] Y. Ou, C. Zhou, L. Qian, D. Fan, C. Cheng, H. Guo. Opt. Express, 23, 31484(2015).

    [3] J. R. Zhao, X. G. Huang, W. X. He, J. H. Chen. J. Lightwave Technol., 28, 2799(2010).

    [4] G. C. Kahandawa, J. Epaarachchi, H. Wang, K. T. Lau. Photonic Sens., 2, 203(2012).

    [5] D. Kang, W. Chung. NDT E. Int., 42, 260(2009).

    [6] L. Ren, Z. G. Jia, H. N. Li, G. Song. Opt. Fiber Technol., 20, 15(2014).

    [7] S. J. Xin. J. Wuhan Univ. Technol., 26, 35(2004).

    [8] K. Zhang, S. Zhang, X. Zhao, Y. Wang, Y. Chen. Opt. Instrum., 36, 15(2014).

    [9] B. O. Guan, H. Y. Tam, X. M. Tao, X. Y. Dong. IEEE Photonics Technol. Lett, 12, 675(2000).

    [10] H. Li, Q. Zhao, S. Jiang, J. Ni, C. Wang. Chin. Opt. Lett., 17, 040603(2019).

    [11] F. Zhang, C. Wang, X. Zhang, S. Jiang, J. Ni, G. Peng. Chin. Opt. Lett., 17, 010601(2019).

    [12] Y. Weng, X. Qiao, T. Guo, M. Hu, Z. Feng, R. Wang, J. Zhang. IEEE Sens. J., 12, 800(2012).

    [13] X. F. Huang, D. R. Sheng, K. F. Cen, H. Zhou. Sens. Actuators B, 127, 518(2007).

    [14] U. Tiwari, K. Thyagarajan, M. R. Shenoy, S. C. Jain. IEEE Sens. J., 13, 1315(2013).

    [15] M. Song, S. Yin, P. B. Ruffin. Appl. Opt., 39, 1106(2000).

    [16] W. R. Allan, Z. W. Graham, J. R. Zayas, D. P. Roach, D. A. Horsley. IEEE Sens. J., 9, 936(2009).

    [17] L. A. Ferreira, J. L. Santos, F. Farahi. IEEE Photonics Technol. Lett, 9, 487(1997).

    [18] S. Yamashita, M. Nishihara. IEEE J. Sel. Top. Quantum Electron, 7, 41(2001).

    [19] S. Yamashita, M. Asano. Opt. Express, 14, 9299(2006).

    [20] Y. Nakazaki, S. Yamashita. Opt. Express, 17, 8310(2009).

    [21] K. Liu, W. C. Jing, G. D. Peng, J. Z. Zhang, D. G. Jia, H. X. Zhang, Y. M. Zhang. Opt. Commun., 281, 3286(2008).

    [22] Q. Ji, X. Ma, J. Sun, H. Zhang, Y. Yao. Chin. Opt. Lett., 8, 398(2010).

    [23] S. V. Miridonov, M. G. Shlyagin, D. Tentori. Opt. Commun., 191, 253(2001).

    [24] L. Li, S. Tang, J. Lu, Y. Shi, B. Cao, X. Chen. Opt. Commun., 352, 70(2015).

    [25] Y. Zhao, Y. Shi, J. Li, S. Liu, R. Xiao, L. Li, J. Lu, X. Chen. IEEE J. Quantum Electron., 54, 2200111(2018).

    [26] A. D. Kersey, M. A. Davis, H. J. Patrick, M. LeBlanc, K. P. Koo, C. G. Askins, M. A. Putnam, E. J. Friebele. J. Lightwave Technol., 15, 1442(1997).

    [27] Y. Li, W. Guo, Y. Xie. International Conference on Measuring Technology and Mechatronics Automation, 734(2010).

    Pan Dai, Yu Zhou, Leilei Wang, Shangjing Liu, Xuping Zhang, Xiangfei Chen. Demodulation of the multi-peak fiber Bragg grating sensor based on partial wavelength scan[J]. Chinese Optics Letters, 2020, 18(7): 071201
    Download Citation