
Yuanlu Li, Xiangke Shi, Kun Li. Adaptive Feature Recombination Recalibration Algorithm for Hepatic Vascular Segmentation[J]. Laser & Optoelectronics Progress, 2022, 59(18): 1817003
- Laser & Optoelectronics Progress
- Vol. 59, Issue 18, 1817003 (2022)
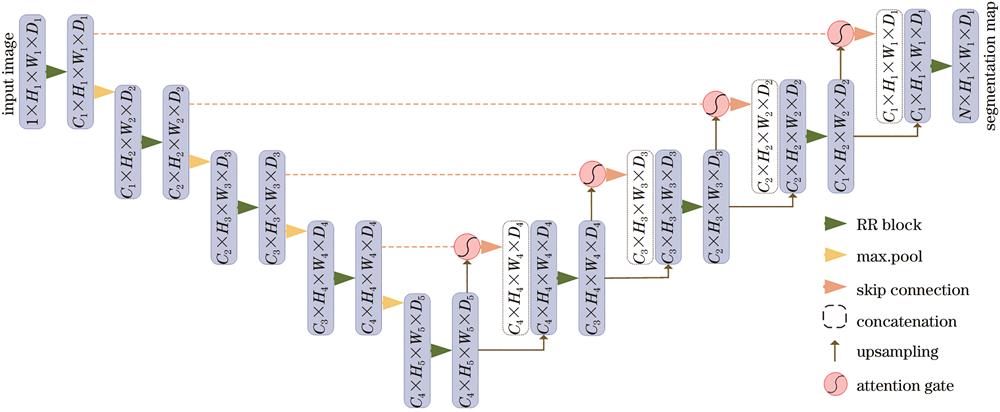
Fig. 1. Overall structure of the improved model
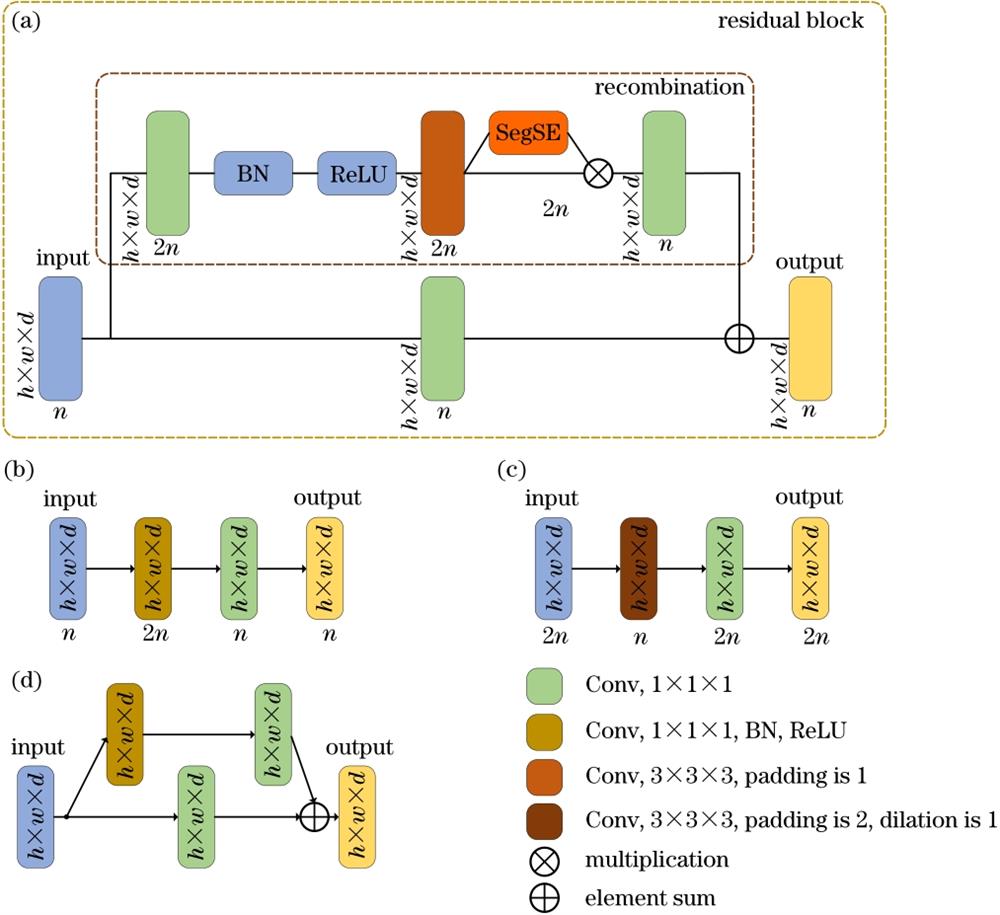
Fig. 2. RR block. (a) Overall structure, the residual block is nested with the recombination block, and the recombination block is nested within the SegSE block; (b) structure of the recombination block; (c) structure of the recalibration block; (d) structure of the residual block
Fig. 3. Module structure. (a) SE module; (b) recalibration module
Fig. 4. Attention mechanism structure
Fig. 5. Flow chart of pretreatment
Fig. 6. Broken line diagram of the influence of RR block on the model. (a) Dice Score; (b) Sensitivity
Fig. 7. Segmentation results. (a) CT original image; (b) gold standard; (c) prediction result; (d) comparison between gold standard and prediction result
Fig. 8. Three-dimensional diagram of segmentation results, the left side of each image is the prediction result, and the right side is the comparison between the segmentation result and the real annotation. (a) MPUNet; (b) nnU-Net; (c) Spider UNet; (d) proposed method
|
Table 1. Quantitative analysis of the influence of the RR block on the model
|
Table 2. Influence of each block and loss function on the model
|
Table 3. Segmentation effect of different models

Set citation alerts for the article
Please enter your email address
© Copyright 2018-2021 | Chinese Laser Press. All Rights Reserved 沪ICP备15018463号-20