• Opto-Electronic Advances
  • Vol. 3, Issue 2, 190037-1 (2020)
Athanasia Papanikolaou1、2, George J. Tserevelakis1, Kristalia Melessanaki1, Costas Fotakis1、2, Giannis Zacharakis1、*, and Paraskevi Pouli1
Author Affiliations
  • 1Foundation for Research and Technology Hellas, Institute of Electronic Structure and Laser, N. Plastira 100, Heraklion, Crete 70013, Greece
  • 2Department of Physics, University of Crete, Voutes University Campus, Crete 71003, Greece
  • show less
    DOI: 10.29026/oea.2020.190037 Cite this Article
    Athanasia Papanikolaou, George J. Tserevelakis, Kristalia Melessanaki, Costas Fotakis, Giannis Zacharakis, Paraskevi Pouli. Development of a hybrid photoacoustic and optical monitoring system for the study of laser ablation processes upon the removal of encrustation from stonework[J]. Opto-Electronic Advances, 2020, 3(2): 190037-1 Copy Citation Text show less
    Schematic representation of the hybrid photoacoustic and optical experimental apparatus.
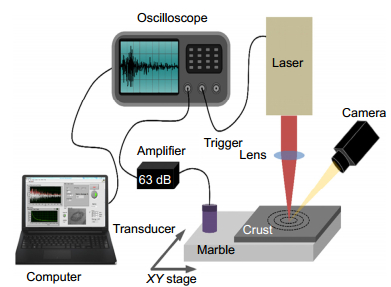
    Fig. 1. Schematic representation of the hybrid photoacoustic and optical experimental apparatus.
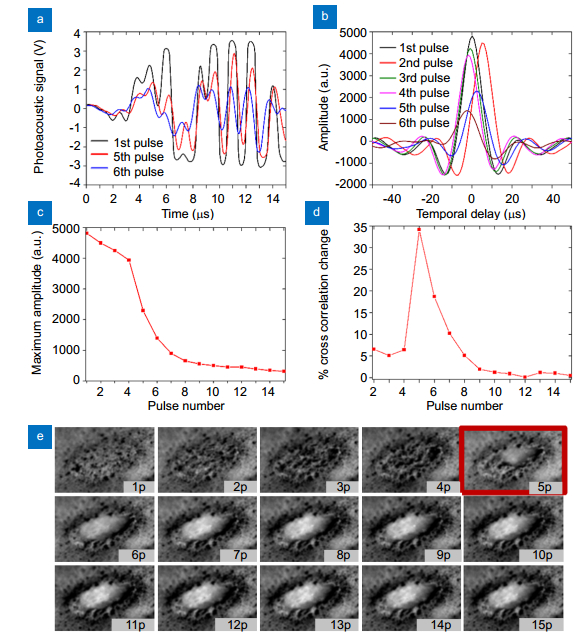
    (a) Recorded PA waveform for FIR=0.8 J/cm2 at 1st, 5th and 6th laser pulse respectively. (b) Cross correlation of PA waveforms generated after the incidence of Nth and 1st pulse. (c) Maximum amplitude of cross correlation operation calculated for the first 15 laser pulses. (d) Percentage change of cross correlation maximum amplitude. The peak indicates the pulse at which the marble substrate has been reached. (e) Optical images recorded for the first 15 laser pulses. Red margin indicates the point where the maximum change has been observed according to Fig. 2(d).
    Fig. 2. (a) Recorded PA waveform for FIR=0.8 J/cm2 at 1st, 5th and 6th laser pulse respectively. (b) Cross correlation of PA waveforms generated after the incidence of Nth and 1st pulse. (c) Maximum amplitude of cross correlation operation calculated for the first 15 laser pulses. (d) Percentage change of cross correlation maximum amplitude. The peak indicates the pulse at which the marble substrate has been reached. (e) Optical images recorded for the first 15 laser pulses. Red margin indicates the point where the maximum change has been observed according to Fig. 2(d).
    (a) Maximum amplitude of cross correlation product for three different fluence values as a function of pulse number. (b) Maximum amplitude percentage change. (c) Optical image corresponding to the 8th laser pulse. (d) Optical image corresponding to the 11th laser pulse. For both cases, irradiation fluence has been equal to 1.0 J/cm2.
    Fig. 3. (a) Maximum amplitude of cross correlation product for three different fluence values as a function of pulse number. (b) Maximum amplitude percentage change. (c) Optical image corresponding to the 8th laser pulse. (d) Optical image corresponding to the 11th laser pulse. For both cases, irradiation fluence has been equal to 1.0 J/cm2.
    (a) Maximum amplitude and (b) Cross correlation maximum amplitude percentage change for irradiation with 355 nm and the simultaneous use of two wavelengths in fluence ratio FIR/FUV =4/1.
    Fig. 4. (a) Maximum amplitude and (b) Cross correlation maximum amplitude percentage change for irradiation with 355 nm and the simultaneous use of two wavelengths in fluence ratio FIR/FUV =4/1.
    Mean PA signal for varying fluence values for the 1064 nm (a) and 355 nm (b) laser beam. The black line corresponds to the polynomial fit of the data, while the blue/red one to the linear fit in the low fluence regime. The error bars represent the standard deviation of five measurements.
    Fig. 5. Mean PA signal for varying fluence values for the 1064 nm (a) and 355 nm (b) laser beam. The black line corresponds to the polynomial fit of the data, while the blue/red one to the linear fit in the low fluence regime. The error bars represent the standard deviation of five measurements.
    (a) Mean PA signal recorded from 26 spots irradiated with FUV = FIR = 0.5 J/cm2 along with (b) Characteristic optical images corresponding to 10 incident laser pulses of IR (red margin) and UV (blue margin) radiation.
    Fig. 6. (a) Mean PA signal recorded from 26 spots irradiated with FUV = FIR = 0.5 J/cm2 along with (b) Characteristic optical images corresponding to 10 incident laser pulses of IR (red margin) and UV (blue margin) radiation.
    Mean normalized PA signal for 10 incident laser pulses of: FIR = 0.5 J/cm2 (red), FUV = 0.5 J/cm2 (blue), simultaneous FIR = 0.4 J/cm2 and FUV = 0.1 J/cm2 (purple), simultaneous FIR = FUV = 0.25 J/cm2 (green).
    Fig. 7. Mean normalized PA signal for 10 incident laser pulses of: FIR = 0.5 J/cm2 (red), FUV = 0.5 J/cm2 (blue), simultaneous FIR = 0.4 J/cm2 and FUV = 0.1 J/cm2 (purple), simultaneous FIR = FUV = 0.25 J/cm2 (green).
    Fitting model: y=ax-bFIRFUVFIR/FUV=4/1FIR/FUV=1/1
    b0.88 ±0.140.57 ±0.050.72 ±0.090.65 ±0.07
    a1.10 ±0.240.54 ±0.070.49 ±0.070.45 ±0.06
    R2> 0.99> 0.98> 0.98> 0.98
    Table 1. Empirical fitting of PA data for different fluence ratios.
    FIRFUVFIR/FUV=4/1FIR/FUV=1/1
    PA amplitude of 1st pulse1.07 ±0.06 V0.53 ±0.05V0.54 ±0.050.48 ±0.04
    %Δ(1st–2nd pulse)45.5%±4.9%26.8%±5.0%43.2%±3.1%38.4%±5.1%
    1st pulse PIR/PUV2.05 ±0.21-
    Table 2. 1st pulse PA amplitude values for various irradiation conditions.
    Athanasia Papanikolaou, George J. Tserevelakis, Kristalia Melessanaki, Costas Fotakis, Giannis Zacharakis, Paraskevi Pouli. Development of a hybrid photoacoustic and optical monitoring system for the study of laser ablation processes upon the removal of encrustation from stonework[J]. Opto-Electronic Advances, 2020, 3(2): 190037-1
    Download Citation