Author Affiliations
Fujian Key Laboratory of Light Propagation and Transformation, College of Information Science and Engineering, Huaqiao University, Xiamen, Fujian 361021, Chinashow less
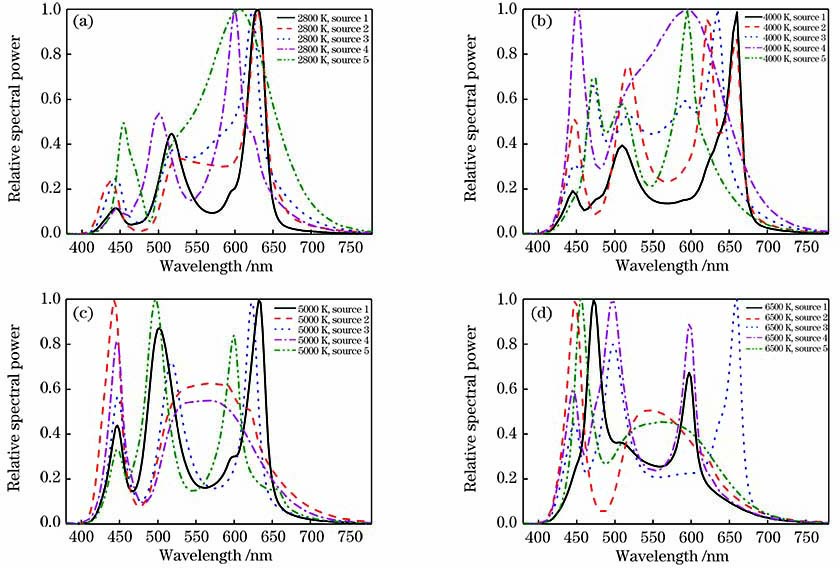
Fig. 1. Spectral power distribution of sample sources. (a) 2800K light sources; (b) 4000K light sources; (c) 5000K light sources; (d) 6500K light sources
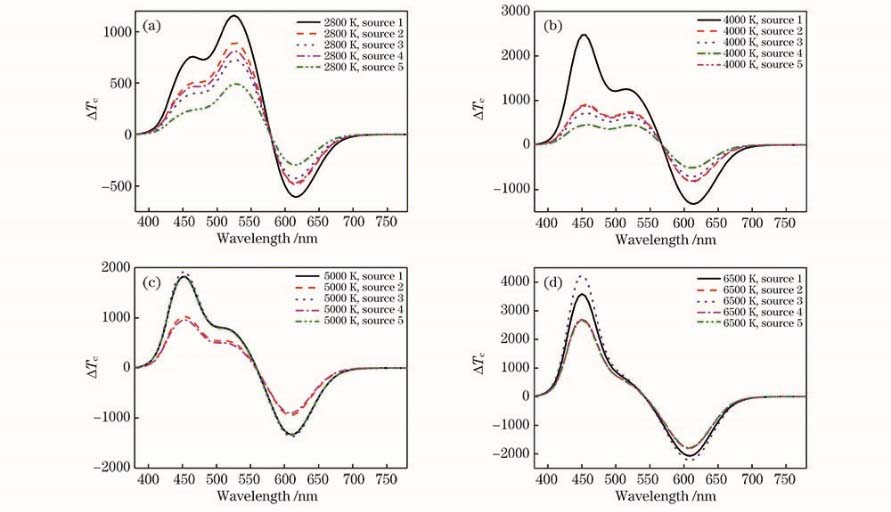
Fig. 2. Change of color temperature after monochromatic light is superimposed on light sources. (a) 2800K light sources; (b) 4000K light sources; (c) 5000K light sources; (d) 6500K light sources
Fig. 3. Change of gamut area after monochromatic light is superimposed on light sources. (a) 2800K light sources; (b) 4000K light sources; (c) 5000K light sources; (d) 6500K light sources
Fig. 4. Spectrum tristimulus curve of CIE1931-RGB system
Fig. 5. Color gamuts of 2800K source 3, superposition of 425nm and 630 nm monochromatic light on 2800K source 3
Fig. 6. Color gamuts of 2800K source 3, superposition of 505nm and 590nm monochromatic light on 2800K source 3
Fig. 7. Visual experiment
Fig. 8. Statistical results of visual experiment
Fig. 9. Change of gamut area of 2800K source 5 after superposition of double monochromatic light. (a) 420nm and 635nm; (b) 420nm and 660nm; (c) 435nm and 635nm; (d) 435nm and 660nm; (e) 450nm and 635nm; (f) 450nm and 660nm
Fig. 10. Results after superposition of double monochromatic light. (a) 2800K light sources; (b) 4000K light sources; (c) 5000K light sources; (d) 6500K light sources
Colortemperature/K | Number of samplesin source 1 | Number of samplesin source 2 | Number of samplesin source 3 | Number of samplesin source 4 | Number of samplesin source 5 |
---|
2800 | 111 | 114 | 105 | 80 | 96 | 4000 | 109 | 115 | 96 | 96 | 80 | 5000 | 105 | 99 | 116 | 95 | 84 | 6500 | 80 | 95 | 104 | 90 | 92 |
|
Table 1. Gamut area index of sample sources
Colortemperature/K | Number of samplesin source 1 | Number of samplesin source 2 | Number of samplesin source 3 | Number of samplesin source 4 | Number of samplesin source 5 |
---|
2800 | 2780 | 2867 | 2829 | 2842 | 2796 | 4000 | 4015 | 4005 | 4002 | 4012 | 4043 | 5000 | 4969 | 4996 | 5035 | 5089 | 5002 | 6500 | 6537 | 6742 | 6524 | 6543 | 6481 |
|
Table 2. Color temperature of sample sources unit: K
Parameter | Source 1 | Source 2 | Source 3 | Source 4 | Source 5 |
---|
λ/nm | 425 | 630 | | 505 | 590 | Rf | 60.4 | 70.5 | 86.3 | 83.3 | 78.2 | Rg | 121.4 | 119.6 | 103.5 | 98.1 | 97.8 | Tc/K | 2934 | 2339 | 2797 | 3312 | 2582 |
|
Table 3. Light source parameters matched by light box
Content | 1 | 2 | 3 | 4 | 5 | 6 | 7 |
---|
Color clarity | Verycolorful | Colorful | Slightlycolorful | Slightlycolorless | Colorless | Verycolorless | | Colorpreference | Likevery much | Like | Generallylike | Neutral | Generallydislike | Dislike | Dislikevery much |
|
Table 4. Quantitative scoring of visual experiment
Colortemperature/K | | | k1 | k2 | Tc | Rg | Rf | DRf | DRg | Duv |
---|
2800,source 5 | 420 | 635 | 0.2 | 0.1 | 2771 | 99 | 80 | -2.6 | 3 | 0.0052 | 420 | 660 | 0.2 | 0.4 | 2749 | 101 | 80 | -1.6 | 4 | 0.0055 | 435 | 635 | 0.1 | 0.1 | 2772 | 100 | 81 | -2.4 | 3 | -0.0050 | 435 | 660 | 0.1 | 0.4 | 2750 | 100 | 81 | -1.4 | 4 | 0.0053 | 450 | 635 | 0.1 | 0.1 | 2783 | 98 | 80 | -2.4 | 2 | 0.0053 | 450 | 660 | 0.1 | 0.4 | 2760 | 99 | 81 | -1.4 | 3 | 0.0056 | Colortemperature/K | | | k1 | k2 | Tc | Rg | Rf | DRf | DRg | Duv | 4000,source 3 | 420 | 635 | 0.3 | 0.1 | 4026 | 101 | 91 | 4.5 | 5 | 0.0059 | 420 | 660 | 0.2 | 0.2 | 4015 | 99 | 90 | 3.0 | 3 | 0.0066 | 435 | 635 | 0.1 | 0.1 | 3983 | 99 | 88 | 1.5 | 3 | 0.0042 | 435 | 660 | 0.1 | 0.3 | 3974 | 99 | 86 | -0.5 | 3 | 0.0044 | 450 | 635 | 0.1 | 0.1 | 4007 | 98 | 88 | 1.5 | 2 | 0.0044 | 450 | 660 | 0.1 | 0.3 | 3998 | 99 | 87 | 0.5 | 3 | 0.0046 | 5000,source 4 | 420 | 635 | 0.7 | 0.3 | 5130 | 103 | 69 | -5.3 | 8 | 0.0049 | 420 | 660 | 0.7 | 0.9 | 5104 | 105 | 69 | -4.9 | 10 | 0.0054 | 435 | 635 | 0.3 | 0.3 | 5059 | 103 | 72 | -2.6 | 8 | 0.0033 | 435 | 660 | 0.3 | 0.8 | 5084 | 104 | 72 | -2.4 | 9 | 0.0031 | 450 | 635 | 0.2 | 0.2 | 5130 | 100 | 73 | -1.3 | 5 | 0.0004 | 450 | 660 | 0.3 | 1.0 | 5075 | 104 | 74 | -0.3 | 9 | 0.0046 | 6500,source 2 | 420 | 635 | 0.2 | 0.1 | 6508 | 98 | 66 | -3.5 | 3 | 0.0025 | 420 | 660 | 0.2 | 0.3 | 6495 | 99 | 66 | -3.1 | 4 | 0.0028 | 435 | 635 | 0.1 | 0.1 | 6502 | 98 | 66 | -3.5 | 3 | 0.0023 | 435 | 660 | 0.1 | 0.3 | 6489 | 99 | 67 | -2.5 | 4 | 0.0026 | 450 | 660 | 0.1 | 0.4 | 6453 | 100 | 68 | -1.5 | 5 | 0.0036 |
|
Table 5. Result of constant color temperature and increased color gamut after double monochromatic light superimposing