• Acta Optica Sinica
  • Vol. 43, Issue 19, 1912002 (2023)
Yuansong Yang, Xi Wang, and Mingjun Ren*
Author Affiliations
  • School of Mechanical Engineering, Shanghai Jiao Tong University, Shanghai 200240, China
  • show less
    DOI: 10.3788/AOS230497 Cite this Article Set citation alerts
    Yuansong Yang, Xi Wang, Mingjun Ren. Multilayer Perceptron-Based Fusion Method for Metal Surface Measurement Data by Multi-Sensors Incorporating Photometric Stereo and Structured Light[J]. Acta Optica Sinica, 2023, 43(19): 1912002 Copy Citation Text show less
    Schematic of fringe projection system
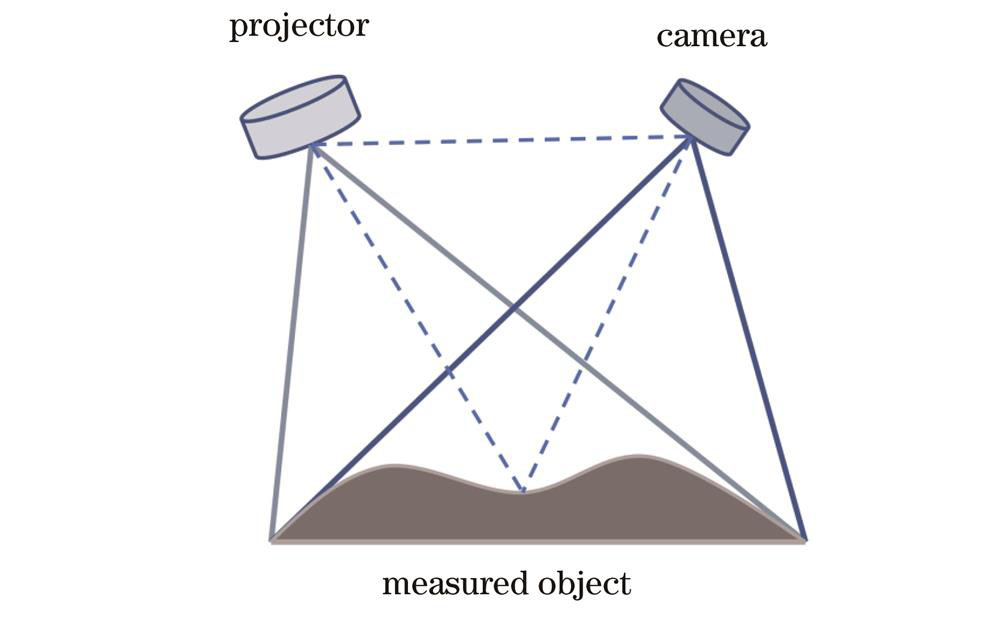
    Fig. 1. Schematic of fringe projection system
    Schematic of photometric stereo vision network
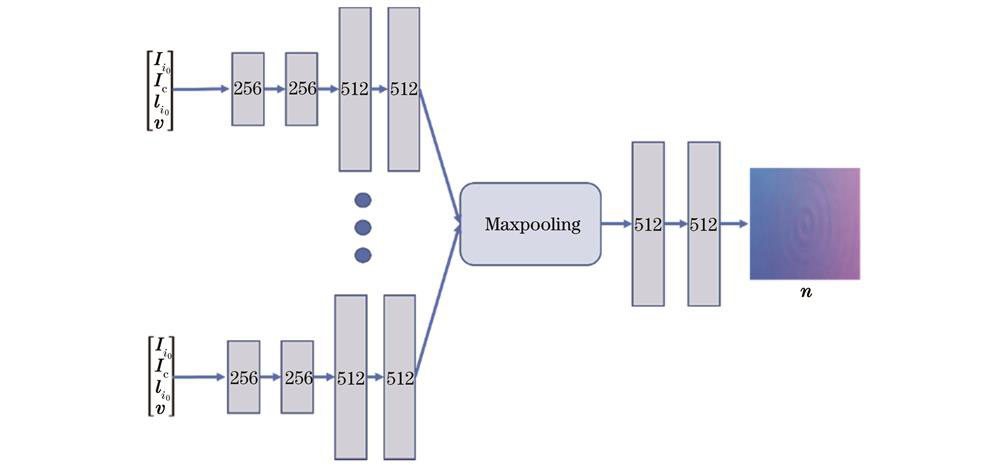
    Fig. 2. Schematic of photometric stereo vision network
    Flowchart of multimodal data fusion
    Fig. 3. Flowchart of multimodal data fusion
    Schematic of depth gradient
    Fig. 4. Schematic of depth gradient
    Schematic of proposed network structure
    Fig. 5. Schematic of proposed network structure
    Schematic of network sampling policy
    Fig. 6. Schematic of network sampling policy
    Overall diagram of experiment equipment
    Fig. 7. Overall diagram of experiment equipment
    Simulation results. (a) Simulation normal image; (b) simulation depth image; (c) result of fusion algorithm; (d) result of normal integrity algorithm
    Fig. 8. Simulation results. (a) Simulation normal image; (b) simulation depth image; (c) result of fusion algorithm; (d) result of normal integrity algorithm
    Mean error results along Z-axis of different algorithms. (a) (b) 3D distribution; (c) (d) 2D distribution
    Fig. 9. Mean error results along Z-axis of different algorithms. (a) (b) 3D distribution; (c) (d) 2D distribution
    Mean error results along Z-axis of different algorithms under different noise levels. (a) Fusion algorithm; (b) normal integrity algorithm
    Fig. 10. Mean error results along Z-axis of different algorithms under different noise levels. (a) Fusion algorithm; (b) normal integrity algorithm
    Comparison of mean error along Z-axis by different noise level
    Fig. 11. Comparison of mean error along Z-axis by different noise level
    Experiment parts
    Fig. 12. Experiment parts
    Normal vector results. (a) Result of part 1 by deep learning method; (b) result of part 1 by least square method; (c) result of part 2 by deep learning method; (d) result of part 2 by least square method
    Fig. 13. Normal vector results. (a) Result of part 1 by deep learning method; (b) result of part 1 by least square method; (c) result of part 2 by deep learning method; (d) result of part 2 by least square method
    Experimental results of part 1 and part 2. (a)(b) Structured light reconstruction results; (c)(d) fusion reconstruction results by least square normal vector; (e)(f) integration algorithm reconstruction results; (g)(h) reconstruction results by proposed method
    Fig. 14. Experimental results of part 1 and part 2. (a)(b) Structured light reconstruction results; (c)(d) fusion reconstruction results by least square normal vector; (e)(f) integration algorithm reconstruction results; (g)(h) reconstruction results by proposed method
    Error distribution results. (a) Structured light method result of part 1; (b) fusion algorithm result of part 1; (c) structured light method result of part 2; (d) fusion algorithm result of part 2
    Fig. 15. Error distribution results. (a) Structured light method result of part 1; (b) fusion algorithm result of part 1; (c) structured light method result of part 2; (d) fusion algorithm result of part 2
    μ0.010.030.050.10
    Normal noise /(°2347.5
    Table 1. Relationship between μ and measurement error of normal vector angle
    μ00.010.030.050.10
    Fusion algorithm0.00250.00620.01930.03360.1288
    Integrity algorithm0.00230.18510.54450.88841.6980
    Table 2. Comparison of mean error along Z-axis under different noise levels
    No.123456789
    Cylinder2.02.31.22.12.43.72.92.93.4
    Quadric1.41.40.61.00.70.71.41.00.9
    Table 3. Repetitive measurement accuracy (RMS) of fusion point clouds
    SurfaceCMMStructured light methodFusion algorithm
    Cylinder35156113
    Quadric75188131
    Table 4. RMS error of different methods
    Yuansong Yang, Xi Wang, Mingjun Ren. Multilayer Perceptron-Based Fusion Method for Metal Surface Measurement Data by Multi-Sensors Incorporating Photometric Stereo and Structured Light[J]. Acta Optica Sinica, 2023, 43(19): 1912002
    Download Citation