• Chinese Optics Letters
  • Vol. 19, Issue 12, 123701 (2021)
Dayong Wang1、2, Xiaoyu Jin1, Jie Zhao1、2、*, Yunxin Wang1、2, Lu Rong1、2, and John J. Healy3
Author Affiliations
  • 1College of Physics and Optoelectronics, Faculty of Science, Beijing University of Technology, Beijing 100124, China
  • 2Beijing Engineering Research Center of Precision Measurement Technology and Instruments, Beijing 100124, China
  • 3Beijing-Dublin International College, Beijing University of Technology, Beijing 100124, China
  • show less
    DOI: 10.3788/COL202119.123701 Cite this Article Set citation alerts
    Dayong Wang, Xiaoyu Jin, Jie Zhao, Yunxin Wang, Lu Rong, John J. Healy. Continuous-wave terahertz diffraction tomography for measuring three-dimensional refractive index maps[J]. Chinese Optics Letters, 2021, 19(12): 123701 Copy Citation Text show less

    Abstract

    Three-dimensional (3D) refractive index (RI) distribution is important to reveal the object’s inner structure. We implemented terahertz (THz) diffraction tomography with a continuous-wave single-frequency THz source for measuring 3D RI maps. The off-axis holographic interference configuration was employed to obtain the quantitative scattered field of the object under each rotation angle. The 3D reconstruction algorithm adopted the filtered backpropagation method, which can theoretically calculate the exact scattering potential from the measured scattered field. Based on the Rytov approximation, the 3D RI distribution of polystyrene foam spheres was achieved with high fidelity, which verified the feasibility of the proposed method.

    1. Introduction

    Terahertz (THz) waves have high penetration through non-metallic and non-polar materials, and they have low photon energy, so are safer for biological targets and human operators. Because of these special properties, both the two-dimensional (2D) and three-dimensional (3D) THz imaging techniques have gained widespread attention in biomedical fields[1] and nondestructive testing[2], among others[37]. The 3D THz imaging can reveal the inner structures of the object, and, especially, the refractive index (RI) distributions usually offer higher contrast and more plentiful information.

    A number of methods for 3D imaging with THz radiation have also been proposed and demonstrated. One of main modalities is the THz computed tomography (CT)[5], which reconstructs the 3D absorption coefficient and RI distributions of the sample from the measured intensity and phase distributions of various projection angles. THz CT is based on a geometrical straight-line model of the propagation of radiation, which assumes that diffraction effects and Fresnel losses can be neglected. The Fourier slice theorem is the central theorem, which leads to the well-known 3D reconstruction algorithm, the filtered backprojection algorithm (FBPJ). The other iterative reconstruction algorithms, such as the simultaneous algebraic reconstruction technique (SART)[6], were developed. The improved THz CT systems with high scanning speed design, extended depth of field[7], and RI matching method[8] have been proposed. However, the THz CT is not proper for 3D imaging of the sample with a fine structure, like high-accuracy 3D RI measurement, and the 3D reconstruction results would be seriously degraded[9,10] because of the diffraction effect caused by the large wavelength of the THz wave. For conventional CT systems, the resolution is related to the size of the focused beam, which is larger than 1 mm in THz waves. Also, it is hard to improve the imaging lateral resolution.

    Diffraction tomography (DT) is one of the common tomography methods that accounts for the diffraction effect[11,12] and can determine simultaneously the 3D absorption coefficient and RI distributions of the sample with high accuracy by using the measurement of the diffracted wave field. In the visible light domain, presently, the optical DT (ODT) has become an important 3D imaging method for non-invasive observation of biomedical samples[13,14] and structural inspection of micro-optical elements[15,16]. In the THz domain, Wang et al.[17,18] in 2003 reported the first implementation of DT by employing a THz time domain spectroscopy (TDS) system. In their work, the sample was an object composed of three rectangular polyethylene cylinders. The 2D THz pattern was formed on an electro-optic ZnTe crystal, which was transferred by the visible probe light and then recorded by a CCD detector. The Fourier diffraction theorem (FDT) and interpolation in the spatial frequency domain were used to reconstruct the spatial object function. This 3D reconstruction algorithm is denoted as a frequency domain interpolation (FDI) algorithm, which is often used. However, the signal complex interpolation for the 3D spatial spectrum data led to artifacts in the reconstructed RI distributions. Thus, the reconstructed results were not very good with noise background. Besides, the system was rather complicated, and it needed to precisely control the CCD image acquisition and THz beam on–off time sequence. Moreover, the above work also assumes that the object is dispersionless. Therefore, in order to meet the practical requirements for 3D imaging, the optimized THz DT with a simple configuration still needs further development, including the direct intensity recording of a THz wave by the 2D array detectors, the use of single-frequency continuous-wave (CW) THz sources, and more effective 3D reconstruction algorithms. Recently, the progress on the wide-field THz coherent imaging techniques makes the exploration very possible, such as THz digital holography[19,20] and ptychography[21], which can give, simultaneously, the 2D quantitative amplitude and phase distributions of the sample.

    In this Letter, we proposed a CW-THz DT system by using a coherent single-frequency THz laser and the array detector to directly record the off-axis digital hologram. The setup is simple and easy to operate. By rotating the object, the 2D scattered fields of the object at each rotation angle can be obtained by the digital holographic reconstruction method. With regard to the 3D reconstruction algorithm of the THz DT, to the best of our knowledge, the filtered backpropagation (FBPP) method is first introduced to produce the volume data in the space domain and to achieve high-quality 3D RI measurement. Compared with the regular FDI algorithm, there is no need to do complex interpolation in the Fourier domain, and the experimental results demonstrate the validity of the method with high fidelity.

    2. Principle of the Filtered Backpropagation Method

    On the assumption of the scalar wave diffraction theorem, consider a monochromatic plane wave u0(r)=exp(Km·r) incident upon a scattering object, whose physical quantity is termed the scattering potential f(r). The resultant total field u(r) [incident field u0(r) plus scattered field us(r)] satisfies the inhomogeneous Helmholtz equation as[11](2+k02)u2(r)=f(r)u(r),and the scattering potential f(r) is defined byf(r)=k02[(n(r)n0)21],where r=(x,y,z) is the 3D spatial vector at the object space, Km=(kmx,kmy,kmz) is the spatial frequency vector of the incident fields, k0=|Km| is the wave number in a vacuum, n01 is the RI value of air, and n(r) is the RI distributions of the object.

    In order to solve Eq. (1), we can make use of Green’s function and apply the Rytov approximation, so the scattered field can be obtained as[22]us(r)uRytov(r)=u0(r)ln[u(r)/u0(r)].

    Then, a direct relation between the Fourier transform (FT) of the scattered field and the FT of the scattering potential of the object can be deduced, which is commonly called the FDT[23]:F˜(KDKm)=2πikDzU˜s(kDx,kDy;ϕ0),where F˜(KDKm) is the 3D FT of the scattering potential f(r), U˜s(kDx,kDy;ϕ0) is the 2D FT of the scattered wave us(x,y;ϕ0) with the rotation angle ϕ0, and KD=(kDx,kDy,kDz) is the spatial frequency vector of scattered field, here, kDx2+kDy2+kDz2=k02. It states that the 2D FT of the filtered data function is equal to the 3D FT of f(r) evaluated over a semispherical surface oriented at an angle ϕ0 in the 3D Fourier space of f(r).

    To reconstruct exact f(r) directly in the space domain[2325], Devaney developed the FBPP algorithm based on Eq. (4) when the frequency domain is represented, by the polar coordinate, and the rotation coordinate transformation is performed. For simplicity, we only consider the rotation of the sample along one axis, which is denoted as the y axis here. The scattering potential can be reconstructed asf(r)=ik04π202πk0k0k0k0|kDx|U˜s(kDx,kDy;ϕ0)×exp[izϕ0(k02kDx2kDy2k0)]×exp[i(kDxxϕ0+kDyyϕ0)]dkDxdkDydϕ0,where xϕ0=xcosϕ0+zsinϕ0,yϕ0=y,and zϕ0=xsinϕ0+zcosϕ0.

    In Eq. (5), there are two exponential terms inside the integral formula. The first one is a transfer function, which is depth-dependent due to the parameter zϕ0. The second one is a factor to make the whole integral form a 2D inverse FT over kDx and kDy. The whole integral formula can be interpreted as propagating the scattered field along the zϕ0 direction, which is similar to the diffraction propagation. In order to implement the numerical calculation of Eq. (5), the scattered field can be propagated into N sections in the space containing the object, and the interval between adjacent sections is denoted as Δzϕ0, which can be flexibly set. Thus, volume data in the space domain is produced, and the scale of the depth is N·Δzϕ0. Finally, the transformation of coordinates, illustrated as Eq. (6), is performed for 3D volumes, which are then added to the reconstruction volume in the sum over all rotation angles ϕ0. Correspondingly, the lateral and axial resolutions of the DT system are related to the resolution of the complex amplitude distribution of a single projection and the number of projections[26]. Under the proper number of projections, the former factor usually plays an important role.

    It is noted that the FBPP algorithm generally requires scattered data measured from view angles in [0,2π] for exact reconstruction of a complex-valued object function. Compared to the direct linear inversion (the FDI algorithm) based on Eq. (4), there is no need to do the complex interpolation processing in the frequency domain, which will cause large computational errors and produce artifacts. The error-prone frequency interpolation can be avoided by applying the FBPP algorithm, which is theoretically equivalent to the FDI.

    Practically, in order to achieve the complex diffracted fields (including the amplitude and phase distributions) of the object for one illumination angle ϕ0, the off-axis digital holographic or the phase-shifting interferometry method can be employed. The off-axis digital holographic method is used in this Letter. The filtering frequency spectrum is applied to the digital holograms to obtain u(x,y;ϕ0) and u0(x,y;ϕ0), which are with and without the object. The scattered field can be calculated by Eq. (3).

    3. Experimental Setup and Results

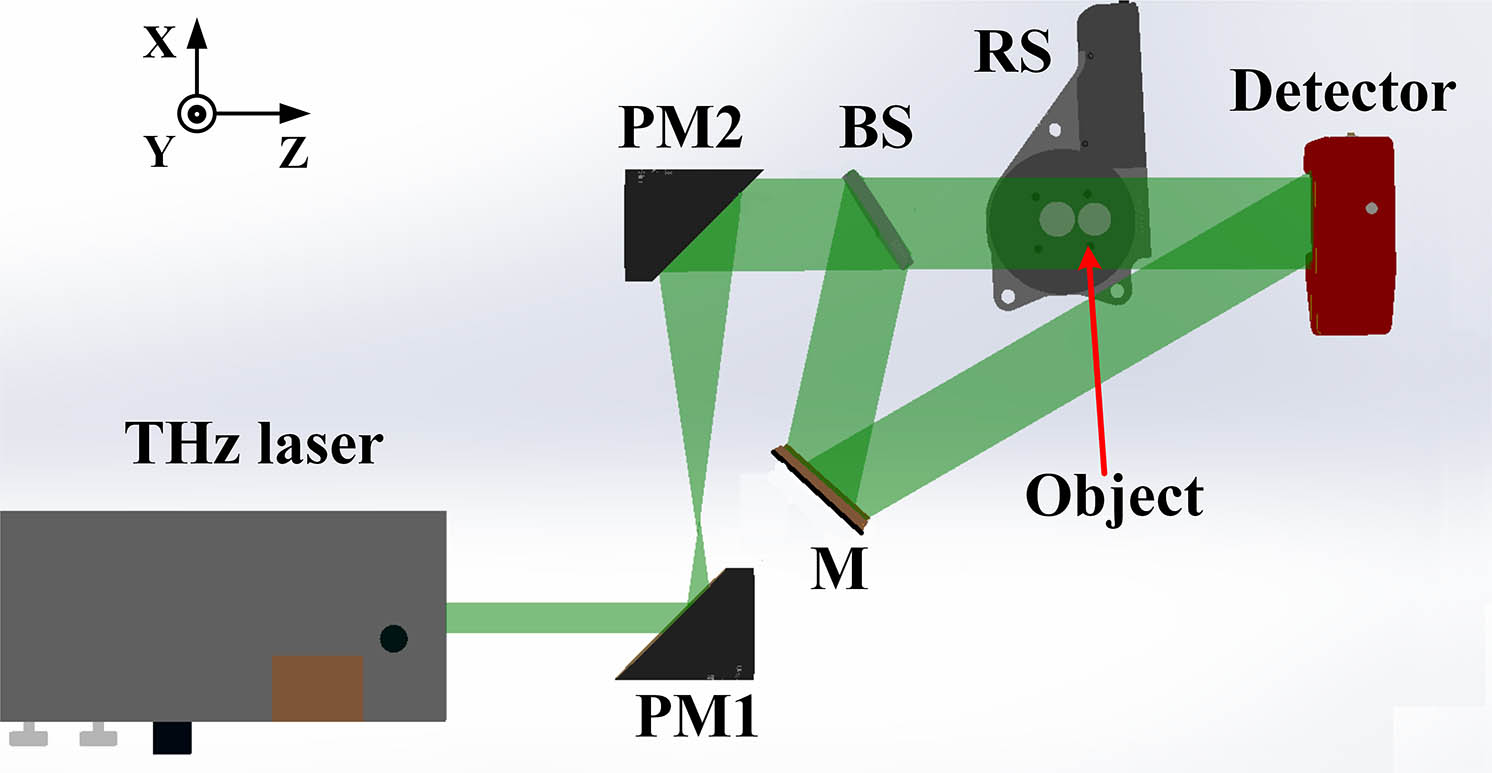
    An experimental CW THz DT system based on off-axis Fresnel digital holography was built as depicted in Fig. 1 to collect the scattered field of the sample with different rotation angles. The THz source was an optically pumped far-IR gas laser (295-FIRL; Edinburgh Instruments Ltd., UK) with a central wavelength of 118.83 µm (2.52 THz) and a maximum power of 500 mW. The emitted THz beam was expanded and collimated by two off-axis parabolic mirrors (PM1, f1=50.8mm; PM2, f2=152.4mm) and then divided into the object beam and the reference beam by a beam splitter (BS). The object was attached to a metal holder for fixing on a rotational stage (PRMTZ8/M; Thorlabs Inc., USA). The interference fringes generated by the two beams formed the hologram, which was recorded by a pyroelectric detector (Pyrocam IV, pixel size 320×320, pixel pitch 80µm×80µm). The distance from the object to the detector was d=62.9mm. To enhance the contrast of the interference fringes, 500 frames were recorded at a chopping frequency of 50 Hz and accumulated via Gaussian fitting. In this experimental setup, the theoretical resolutions are about 0.3 mm.

    Schematic of the experimental configuration of continuous-wave terahertz diffraction tomography (CW THz DT). PM1 and PM2, off-axis parabolic mirrors; BS, THz beam splitter; M, gold-coated mirror; RS, rotational stage.

    Figure 1.Schematic of the experimental configuration of continuous-wave terahertz diffraction tomography (CW THz DT). PM1 and PM2, off-axis parabolic mirrors; BS, THz beam splitter; M, gold-coated mirror; RS, rotational stage.

    To validate the proposed method, we first used a single polystyrene (PS) foam sphere with a diameter of 7.44 mm. The RI of the PS foam was 1.0169 at 2.52 THz, as measured by the THz-TDS system (TAS7400SU; Advantest, Japan). In the experiments, the sample was rotated gradually by 360° at angular intervals of 3°, and thus 120 holograms with the object were recorded successively, followed by one background hologram without the object. Figures 2(a1) and 2(b1) show the holograms with and without the object, respectively, at the rotation angle of 0°, and Figs. 2(c1) and 2(d1) show the reconstructed amplitude and wrapped phase images of Fig. 2(a1). The least-squares method is used to obtain the unwrapped phase image[27], then a double exposure is used to compensate for phase aberration[28], and the result is shown in Fig. 2(a2). Figures 2(a2)2(d2) show the reconstructed phase images at 0°, 45°, 90°, and 180°, respectively, and Fig. 2(e1) shows the phase profiles of the dotted lines in Figs. 2(a2)2(d2). As can be seen, the maximum phase values of the different angles are shifted along the X axis. This misalignment exists because it is difficult to precisely adjust the gravity center of the sample to the rotational axis of the stage. To compensate for this mechanical error, a cross-correlation coefficient was used to align the phase profiles. After alignment, the maximum phase values are nearly in the same position along the X axis, as shown in Fig. 2(e2). The mechanical error mentioned above also results in axial shifting of the sample when rotating, so the reconstructed complex images of digital holography are defocused to different extents. To improve this, the auto-focusing method based on the Brenner function as the criterion function is applied to make them with a sharp boundary at each rotation angle[29].

    Reconstructed results of digital holography for single polystyrene (PS) foam sphere: (a1), (b1) holograms with and without the object at 0°; (c1), (d1) reconstructed amplitude and wrapped phase images of (a1); (a2)–(d2) reconstructed phase images at 0°, 45°, 90°, and 180°; (e1) phase profiles of the black dotted line in (a2)–(d2); (e2) result of (e1) after alignment.

    Figure 2.Reconstructed results of digital holography for single polystyrene (PS) foam sphere: (a1), (b1) holograms with and without the object at 0°; (c1), (d1) reconstructed amplitude and wrapped phase images of (a1); (a2)–(d2) reconstructed phase images at 0°, 45°, 90°, and 180°; (e1) phase profiles of the black dotted line in (a2)–(d2); (e2) result of (e1) after alignment.

    The reconstructed complex amplitudes by digital holography with various angles were then processed to obtain the scattered field. The scattering potential distributions of the sample were reconstructed by using Eq. (5), where Δzϕ0 is set to be 80 µm, and N is equal to 320. The RI distributions were finally achieved by using Eq. (2). In our experiment, the sample was supported by a metal rod whose large RI led to incorrect reconstructed values in these areas, so the support-rod part has been removed from the reconstructed 3D RI results below.

    Figures 3(a1)3(c1) are the reconstructed results by the FDI method, showing the obtained RI distributions at cross sections xy, yz, and xz, respectively. It is seen that there is some artifacts error inside, especially in the background region, and the fluctuation of the value is relatively serious. The reconstructed RI distributions by the FBPP method are shown in Figs. 3(a2)3(c2), which show much-improved fidelity of the reconstructed RI tomograms. Figure 3(d) shows the differences of the RI profiles of the PS foam sphere between the results obtained by the FBPP method and the FDI method. The red line represents the ideal RI value of the PS foam material, which is measured by the THz-TDS system. As can be seen, the RI value obtained by the FBPP method is more accurate, where the average value is 1.0153, and the error is only 0.16%, thereby verifying the effectiveness of the proposed method. Furthermore, the average diameter of the reconstructed foam sphere is 7.44mm, which corresponds to a reconstruction error of 0.6% compared with the true value. We can also analyze the reconstruction quality of the FBPP and FDI methods from the view of 3D Fourier space, as shown in Fig. 4. Figures 4(a) and 4(b) are the amplitude of the spectrum distribution of FDI and FBPP on the logarithmic scale along the fxfy,fxfz, and fyfz cross sections, respectively. For the FDI method, the number of missing spectrum points produced by the reconstruction algorithm is more than that of FBPP, as indicated by the green arrows. It leads to the reconstructed RI distribution being worse, as shown in Figs. 3(a1)3(c1). Meanwhile, both FBPP and FDI have the same missing spectrum points caused by the “missing apple core” problem, as indicated by the red arrows.

    Reconstructed refractive index (RI) profiles of DT for a single foam sphere: (a1)–(c1), (a2)–(c2) 3D RI profiles at cross sections x–y, y–z, and x–z by FDI and FBPP algorithm, respectively; (d) RI profiles of the red dotted line in (c1) and (c2), and ideal values obtained by the THz-TDS system.

    Figure 3.Reconstructed refractive index (RI) profiles of DT for a single foam sphere: (a1)–(c1), (a2)–(c2) 3D RI profiles at cross sections x–y, y–z, and x–z by FDI and FBPP algorithm, respectively; (d) RI profiles of the red dotted line in (c1) and (c2), and ideal values obtained by the THz-TDS system.

    Amplitude of the spectrum distribution of (a) FDI and (b) FBPP on the logarithmic scale along the fx–fy, fx–fz, and fy–fz cross sections, respectively.

    Figure 4.Amplitude of the spectrum distribution of (a) FDI and (b) FBPP on the logarithmic scale along the fx–fy, fx–fz, and fy–fz cross sections, respectively.

    To demonstrate further the applicability of THz DT on non-axisymmetric samples, two glued PS foam spheres were placed horizontally on the rotary stage, and then the sample was rotated around the gravity center of one sphere to obtain the scattered field with various rotation angles. The reconstructed RI distributions of the foam spheres at cross sections xy,yz, and xz and the 3D distributions are shown in Figs. 5(a)5(d), respectively. From Visualization 1, the 3D RI distributions are presented visually. The average RI value of the two reconstructed foam spheres is 1.0126, and the difference is 0.42% compared with the value obtained by the THz-TDS system. Note that the RI distributions are not as uniform compared with the previous single foam sphere. There are some fringe patterns. Because multiple scattering exists when the THz beam propagates through the two foam spheres, the Rytov approximation is not well satisfied, and the reconstruction error is increased. To solve this, one possible way is to build the forward propagation model including the multiple scattering effects and apply an iterative DT reconstruction algorithm to improve the quality of 3D reconstructed RI distributions[30,31].

    RI distributions of DT for two foam spheres: (a)–(c) 3D RI profiles at cross sections x–y, y–z, and x–z; (d) volume rendering of 3D RI profiles (see Visualization 1).

    Figure 5.RI distributions of DT for two foam spheres: (a)–(c) 3D RI profiles at cross sections x–y, y–z, and x–z; (d) volume rendering of 3D RI profiles (see Visualization 1).

    4. Summary and Discussion

    In summary, we have realized CW THz DT combined with digital holography, and the digital holograms are recorded directly by the array detector at various angles through rotating the samples. The configuration is simple and easy to operate. With regard to the 3D reconstruction algorithm, the FBPP algorithm is adopted to achieve 3D RI distributions of the PS foam spheres. The average RI value has only 0.16% difference from the RI value measured by the THz-TDS system. The reconstructed results have high fidelity compared with results obtained by the FDI algorithm. It verifies the feasibility of the proposed method.

    Note that in the reconstructed RI tomograms in Figs. 3 and 5, some values are quite different from their surroundings along the Y axis, which is the result of the “missing apple core” problem. It can be improved by the iterative algorithm with non-negative constraints. Furthermore, to promote THz DT further, RI matching or the multiple scattering non-linear model must be applied to reconstruct high-RI samples. Our view is that THz DT can be an effective method for non-destructive testing and quantitative measurement of the complex RI of complex samples in the future, which can be combined with other THz wide-field phase-contrast imaging methods.

    References

    [1] D. A. Lima, J. Song, X. R. Li, A. Portieri, Y. C. Shen, J. A. Zeitler, H. Lin. Review of terahertz pulsed imaging for pharmaceutical film coating analysis. Sensors, 20, 1441(2020).

    [2] L. Valzania, Y. Zhao, L. Rong, D. Wang, M. Georges. THz coherent lensless imaging. Appl. Opt., 58, G256(2019).

    [3] D. M. Mittleman. Twenty years of terahertz imaging. Opt. Express, 26, 9417(2018).

    [4] X. Xu, Y. Wu, T. He, Y. Li, F. Hu, H. Liang, C. Yang, H. Zhong. Metamaterials-based terahertz sensor for quick diagnosis of early lung cancer. Chin. Opt. Lett., 15, 111703(2017).

    [5] J. P. Guillet, B. Recur, L. Frederique, B. Bousquet, L. Canioni, I. Manek-Hönninger, P. Desbarats, P. Mounaix. Review of terahertz tomograph techniques. J. Infrared Milli. THz Waves, 35, 382(2014).

    [6] J. B. Perraud, A. Chopard, J. P. Guillet, P. Gellie, A. Vuillot, P. Mounaix. A versatile illumination system for real-time terahertz imaging. Sensors, 20, 3993(2020).

    [7] F. Xing, D. Liu, L. Xing, S. Shen, Z. Yang, J. Li, K. Wang. Generation of a meter-scale THz diffraction-free beam based on multiple cascaded lens-axicon doublets: detailed analysis and experimental demonstration. Opt. Express, 28, 36873(2020).

    [8] J. B. Perraud, J. Bou Sleiman, B. Recur, H. Balacey, F. Simoens, J. P. Guillet, P. Mounaix. Liquid index matching for 2D and 3D terahertz imaging. Appl. Opt., 55, 9185(2016).

    [9] L. Chen, Y. Wang, D. Xu, Y. Ren, Y. He, C. Li, C. Zhang, L. Tang, C. Yan, J. Yao. Terahertz computed tomography of high-refractive-index objects based on refractive index matching. IEEE Photon. J., 10, 5900813(2018).

    [10] A. Brahm, A. Wilms, M. Tymoshchuk, C. Grossmann, G. Notni, A. Tünnermann. Optical effects at projection measurements for terahertz tomography. Opt. Las. Technol., 62, 49(2014).

    [11] M. Born, E. WolfPrinciple of Optics(1999).

    [12] W. Gorski, W. Osten. Tomographic imaging of photonic crystal fibers. Opt. Lett., 32, 1977(2007).

    [13] C. Liu, M. Malek, I. Poon, L. Jiang, A. Siddiquee, C. Sheppard, A. Roberts, H. Quiney, D. G. Zhang, X. Yuan, J. Lin, C. Depeursinge, P. Marquet, S. S. Kou. Simultaneous dual-contrast three-dimensional imaging in live cells via optical diffraction tomography and fluorescence. Photon. Res., 7, 1042(2019).

    [14] J. Oh, J. S. Ryu, M. Lee, J. Jung, S. Han, H. J. Chung, Y. Park. Three-dimensional label-free observation of individual bacteria upon antibiotic treatment using optical diffraction tomography. Biomed. Opt. Express, 11, 1257(2020).

    [15] K. Kim, J. Yoon, Y. Park. Large-scale optical diffraction tomography for inspection of optical plastic lenses. Opt. Lett., 41, 934(2016).

    [16] V. Balasubramani, A. Kus, H. Y. Tu, C. J. Cheng, M. Baczewska, W. Krauze, M. Kujawińska. Holographic tomography: techniques and biomedical application. Appl. Opt., 60, B65(2021).

    [17] S. Wang, B. Ferguson, D. Abbott, X. Zhang. T-ray imaging and tomography. J. Bio. Phys., 29, 247(2003).

    [18] S. Wang, X. Zhang. Pulsed terahertz tomograhy. J. Phys. D, 37, R1(2004).

    [19] S. H. Ding, Q. Li, Y. D. Li, Wang Qi. Cotinuous-wave terahertz digital holography by use of a pyroelectric array camera. Opt. Lett., 36, 1993(2010).

    [20] M. S. Heimbeck, H. O. Everitt. Terahertz digital holographic imaging. Adv. Opt. Photon., 12, 1(2020).

    [21] L. Valzania, T. Feurer, P. Zolliker, E. Hack. Terahertz ptychograpy. Opt. Lett., 43, 543(2018).

    [22] A. J. Devaney. Inverse-scattering theory within the Rytov approximation. Opt. Lett., 6, 374(1981).

    [23] P. Müller, M. Schürmann, J. Guck. The theory of diffraction tomography(2015).

    [24] A. J. Devaney. A filtered backpropagation algorithm for diffraction tomography. Ultrason. Imaging, 4, 336(1982).

    [25] J. Kostencka, T. Kozacki, A. Kuś, B. Kemper, M. Kujawińska. Holographic tomography with scanning of illumination: space-domain reconstruction for spatially invariant accuracy. Biomed. Opt. Express, 7, 4086(2016).

    [26] K. Kim, J. Yoon, S. Shin, S. Lee, S. Yang, Y. Park. Optical diffraction tomography techniques for the study of cell pathophysiology. J. Biomed. Photon. Eng., 2, 020201(2016).

    [27] Z. Zhao, H. Zhang, C. Ma, C. Fan, H. Zhao. Comparative study of phase unwrapping algorithms based on solving the Poisson equation. Meas. Sci. Technol., 31, 065004(2020).

    [28] P. Zhang, D. Liu, A. Yang, J. Zhu. Optimization of compensation for high spatial frequency in distorted wavefront using optical phase conjugation. Chin. Opt. Lett., 17, 070901(2019).

    [29] B. Zhong, Y. Zhang, J. Hu, Z. Jin, Z. Wang, L. Sun. Improved autofocus method for human red blood cell images. Appl. Opt., 58, 8031(2019).

    [30] J. Lim, A. Goy, M. H. Shoreh, M. Unser, D. Psaltis. Learning tomography assessed using Mie theory. Phys. Rev. Appl., 9, 034027(2018).

    [31] J. Cheng, J. Luo. Tikhonov-regularization-based projecting sparsity pursuit method for fluorescence molecular tomography reconstruction. Chin. Opt. Lett., 18, 011701(2020).

    Dayong Wang, Xiaoyu Jin, Jie Zhao, Yunxin Wang, Lu Rong, John J. Healy. Continuous-wave terahertz diffraction tomography for measuring three-dimensional refractive index maps[J]. Chinese Optics Letters, 2021, 19(12): 123701
    Download Citation