
Jian Zou, Hongjun Liu, Yuhui Zhao, Jibin Zhao, Chen He, Zhiguo Wang. Study on Process Parameters for Preparing a High-Strength Al-Mg-Sc-Zr Alloy by Laser Melting Deposition[J]. Laser & Optoelectronics Progress, 2023, 60(9): 0914003
- Laser & Optoelectronics Progress
- Vol. 60, Issue 9, 0914003 (2023)
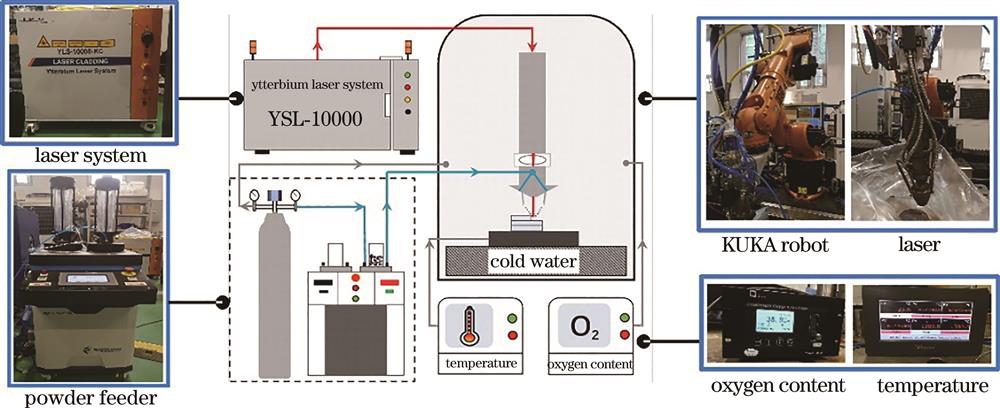
Fig. 1. Laser melting deposition additive manufacturing system

Fig. 2. Sampling position and size of deposited sample and tensile sample. (a) Deposited samples; (b) sampling position of tensile specimen; (c) tensile specimen size
Fig. 3. Microstructure and defect images of deposited samples with different conditions. (a) Pore defect; (b) lack of fusion defect
Fig. 4. Effect of process parameters on the density of Al-Mg-Sc-Zr alloy
Fig. 5. Mass fraction statistics of main element of alloy under different processes
Fig. 6. SEM images of deposited samples with different energy densities. (a) (e) 50 J/mm2; (b) (f) 75 J/mm2; (c) (g) 100 J/mm2; (d) (h) 150 J/mm2
Fig. 7. Map scanning and EDS analysis of Sc/Zr rich phase
Fig. 8. Effect of process parameters on the hardness of deposited Al-Mg-Sc-Zr alloy
Fig. 9. Stress-strain curve and performance comparison of deposited samples. (a) (b) Tensile specimen, powder feeding rate of 2.5 g/min, energy density of 100 J/mm2; (c) strength and elongation; (d) 2.5 g/min; (e) 4.5 g/min; (f) 5.5 g/min
Fig. 10. Fracture morphology of specimen at 2.5 g/min powder feeding rate with different energy densities. (a) 50 J/mm2; (b) 75 J/mm2; (c) 100 J/mm2; (d) 150 J/mm2
| |||||||||||||||||||||||||||||||||||||||
Table 1. Chemical composition of Al-Mg-Sc-Zr alloy powder and substrate
| |||||||||||||||||||||||||||||||||||||||||||||||||||||||||||||||||||||||||||||
Table 2. Process parameters of deposited samples under different conditions
|
Table 3. Statistics of average grain size

Set citation alerts for the article
Please enter your email address
© Copyright 2018-2021 | Chinese Laser Press. All Rights Reserved 沪ICP备15018463号-20