
Haifeng Duan, Kaiyu Luo, Jinzhong Lu. Friction and Wear Properties of H62 Brass Subjected to Laser Shock Peening[J]. Acta Optica Sinica, 2018, 38(10): 1014002
- Acta Optica Sinica
- Vol. 38, Issue 10, 1014002 (2018)
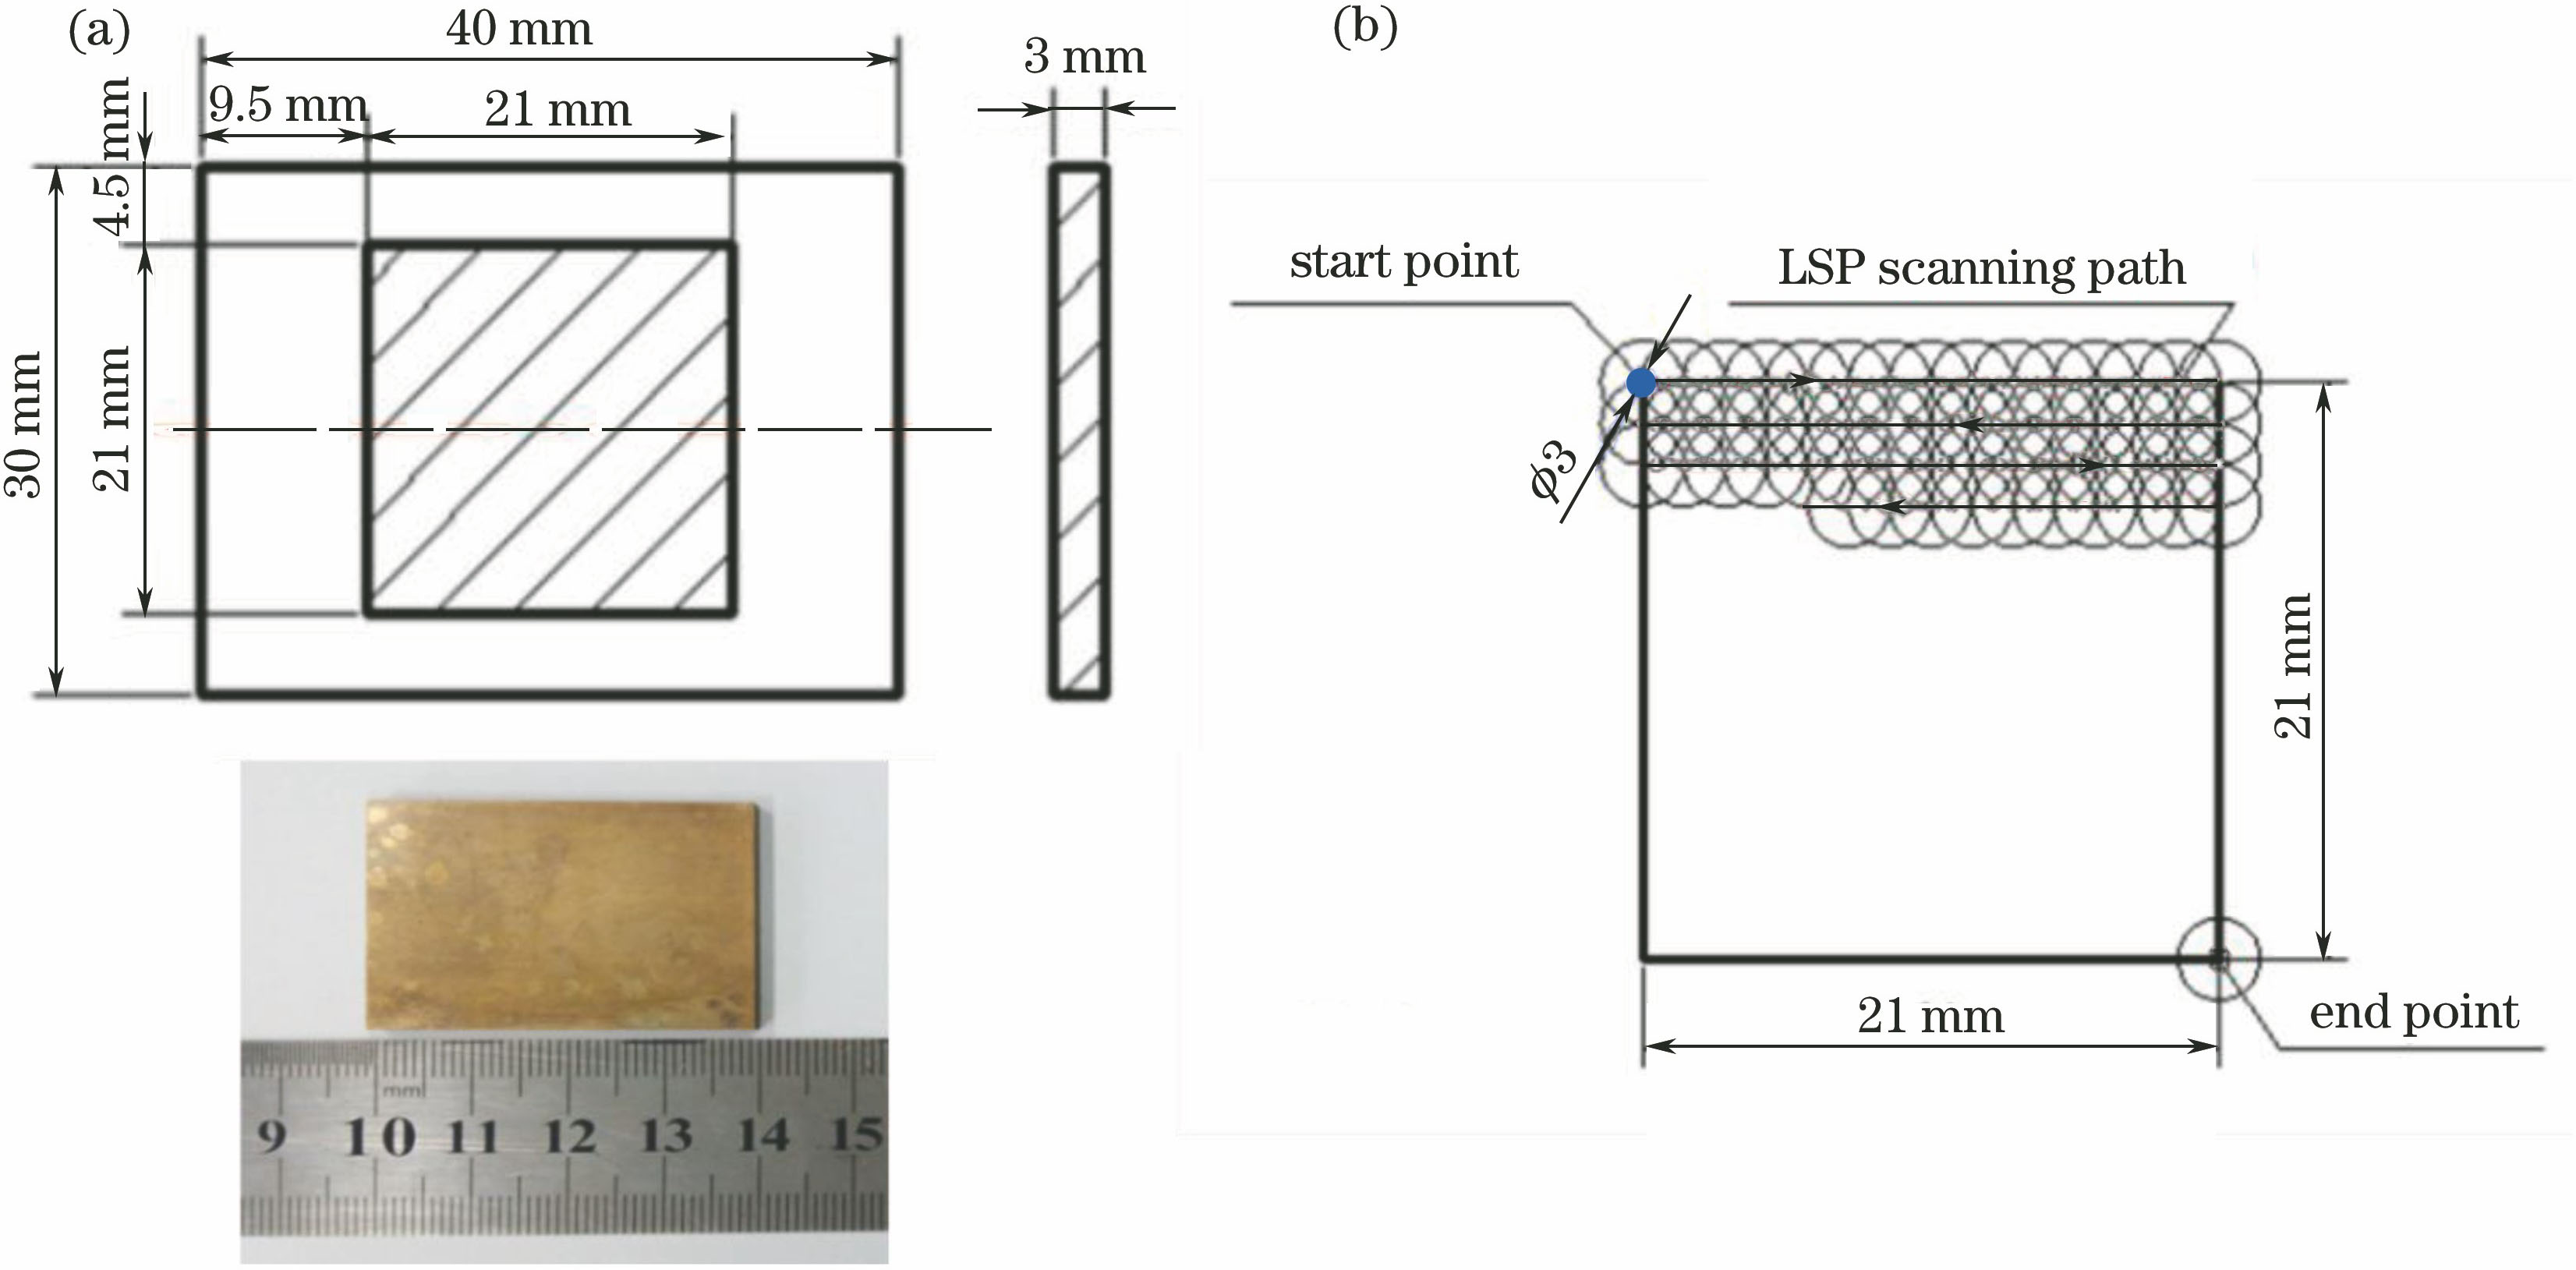
Fig. 1. LSP sample. (a) Dimension; (b) laser scanning path for impact area
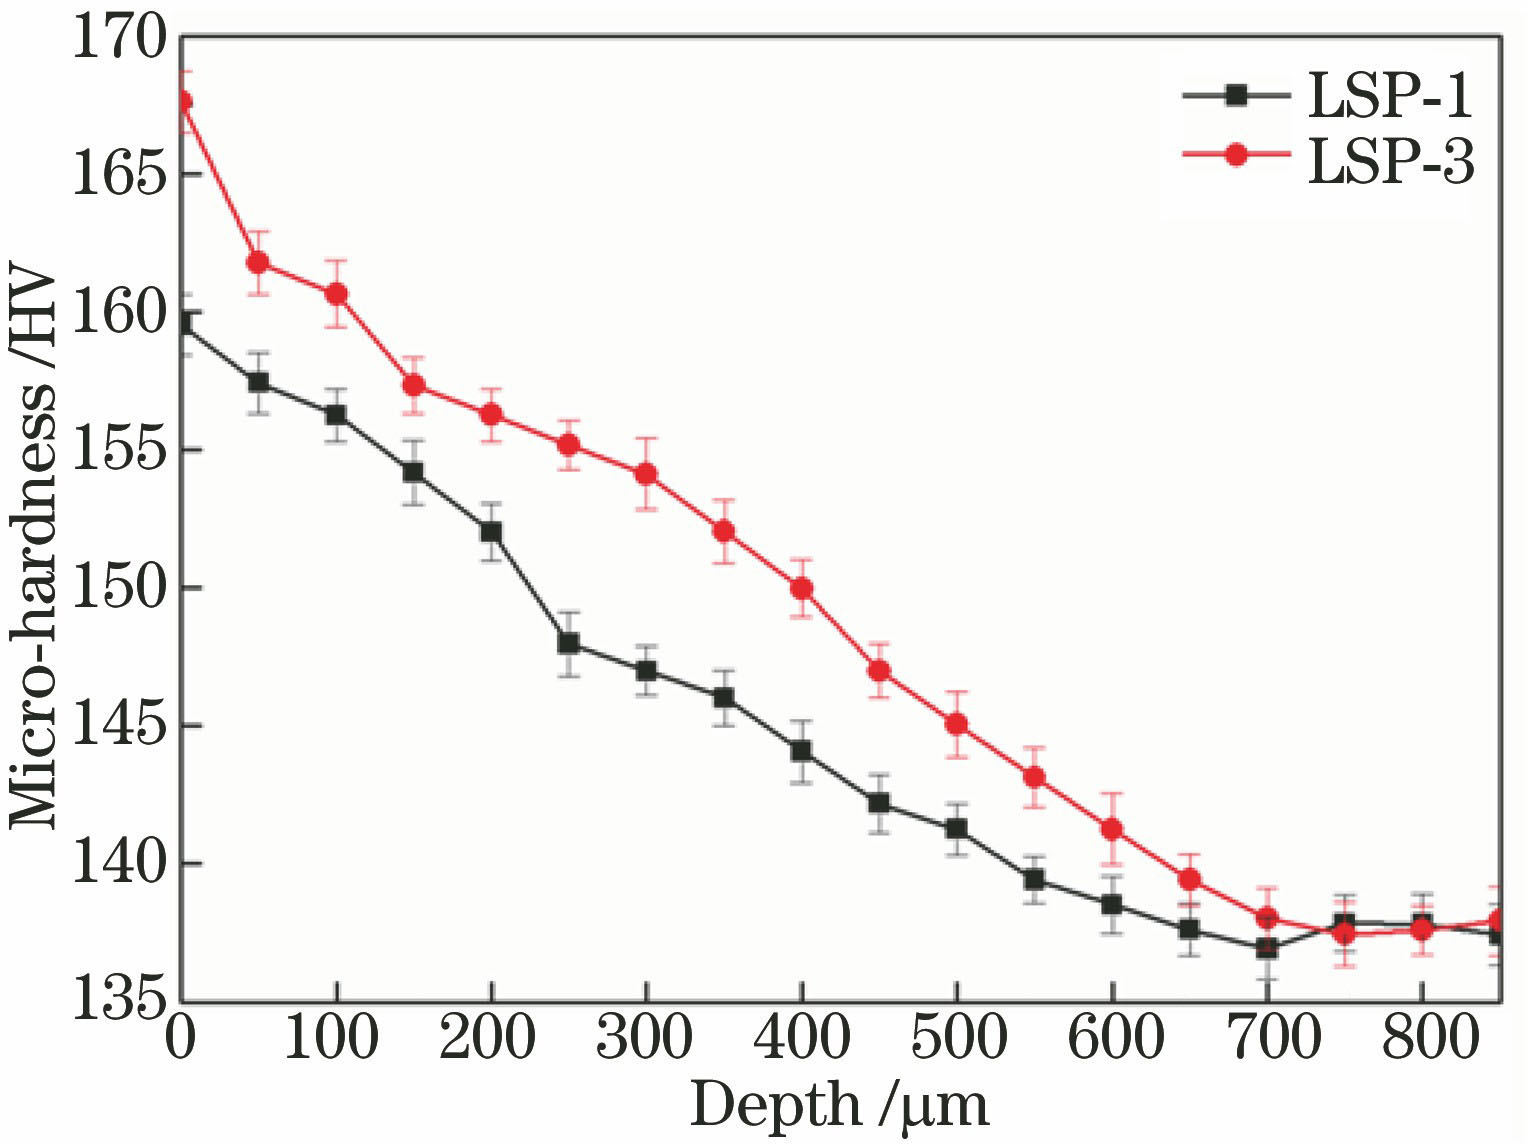
Fig. 2. Micro-hardness curves of cross-section in the samples subjected to LSP with different coverage layers
Fig. 3. Three-dimensional and two-dimensional micro-structure topographies. (a) Three-dimensional topographies of as-received sample; (b) three-dimensional topographies of LSP-1 sample; (c) three-dimensional topographies of LSP-3 sample; (d) two-dimensional topographies of as-received sample; (e) two-dimensional topographies of LSP-1 sample; (f) two-dimensional topographies of LSP-3 sample
Fig. 4. Curves of friction coefficients of as-received sample and LSPed samples varied with time
Fig. 5. Wear rate of as-received sample and LSPed samples with same load and sliding velocity
Fig. 6. Typical SEM micrographs of wear surface in different samples. (a), (b) As-received sample; (c), (d) LSP-1 sample; (e), (f) LSP-3 sample
Fig. 7. Analysis of EDS of wear surface in different samples. (a) As-received sample; (b) LSP-1 sample; (c) LSP-3 sample
Fig. 8. Effect of coverage layer number on the surface roughness of H62 brass. (a) One coverage layer; (b) three coverage layers
Fig. 9. TEM images of microstructure in the top surface of H62 brass before and after LSP. (a) As-received sample; (b) LSP-1 sample; (c) LSP-3 sample
|
Table 1. Chemical composition of H62 brass

Set citation alerts for the article
Please enter your email address
© Copyright 2018-2021 | Chinese Laser Press. All Rights Reserved 沪ICP备15018463号-20