
Feinan Chen, Yizhe Fan, Jin Hong, Chan Huang, Shuang Li, Benyong Yang, Bihai Tu, Lin Han, Bin Sun. In-Flight Radiation Calibration of a Directional Polarimetric Camera at Visible Bands Onboard GF-5[J]. Acta Optica Sinica, 2020, 40(23): 2328001
- Acta Optica Sinica
- Vol. 40, Issue 23, 2328001 (2020)
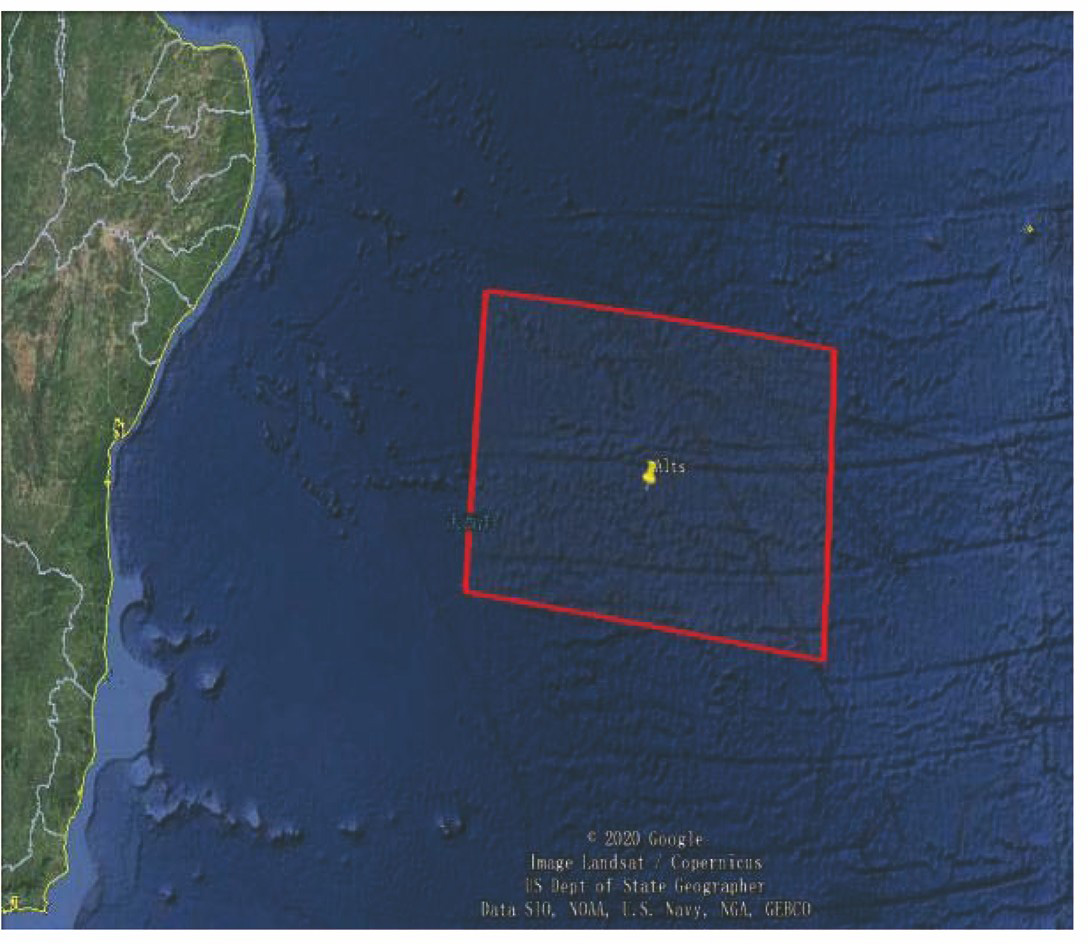
Fig. 1. Location of AltS site on Google Earth
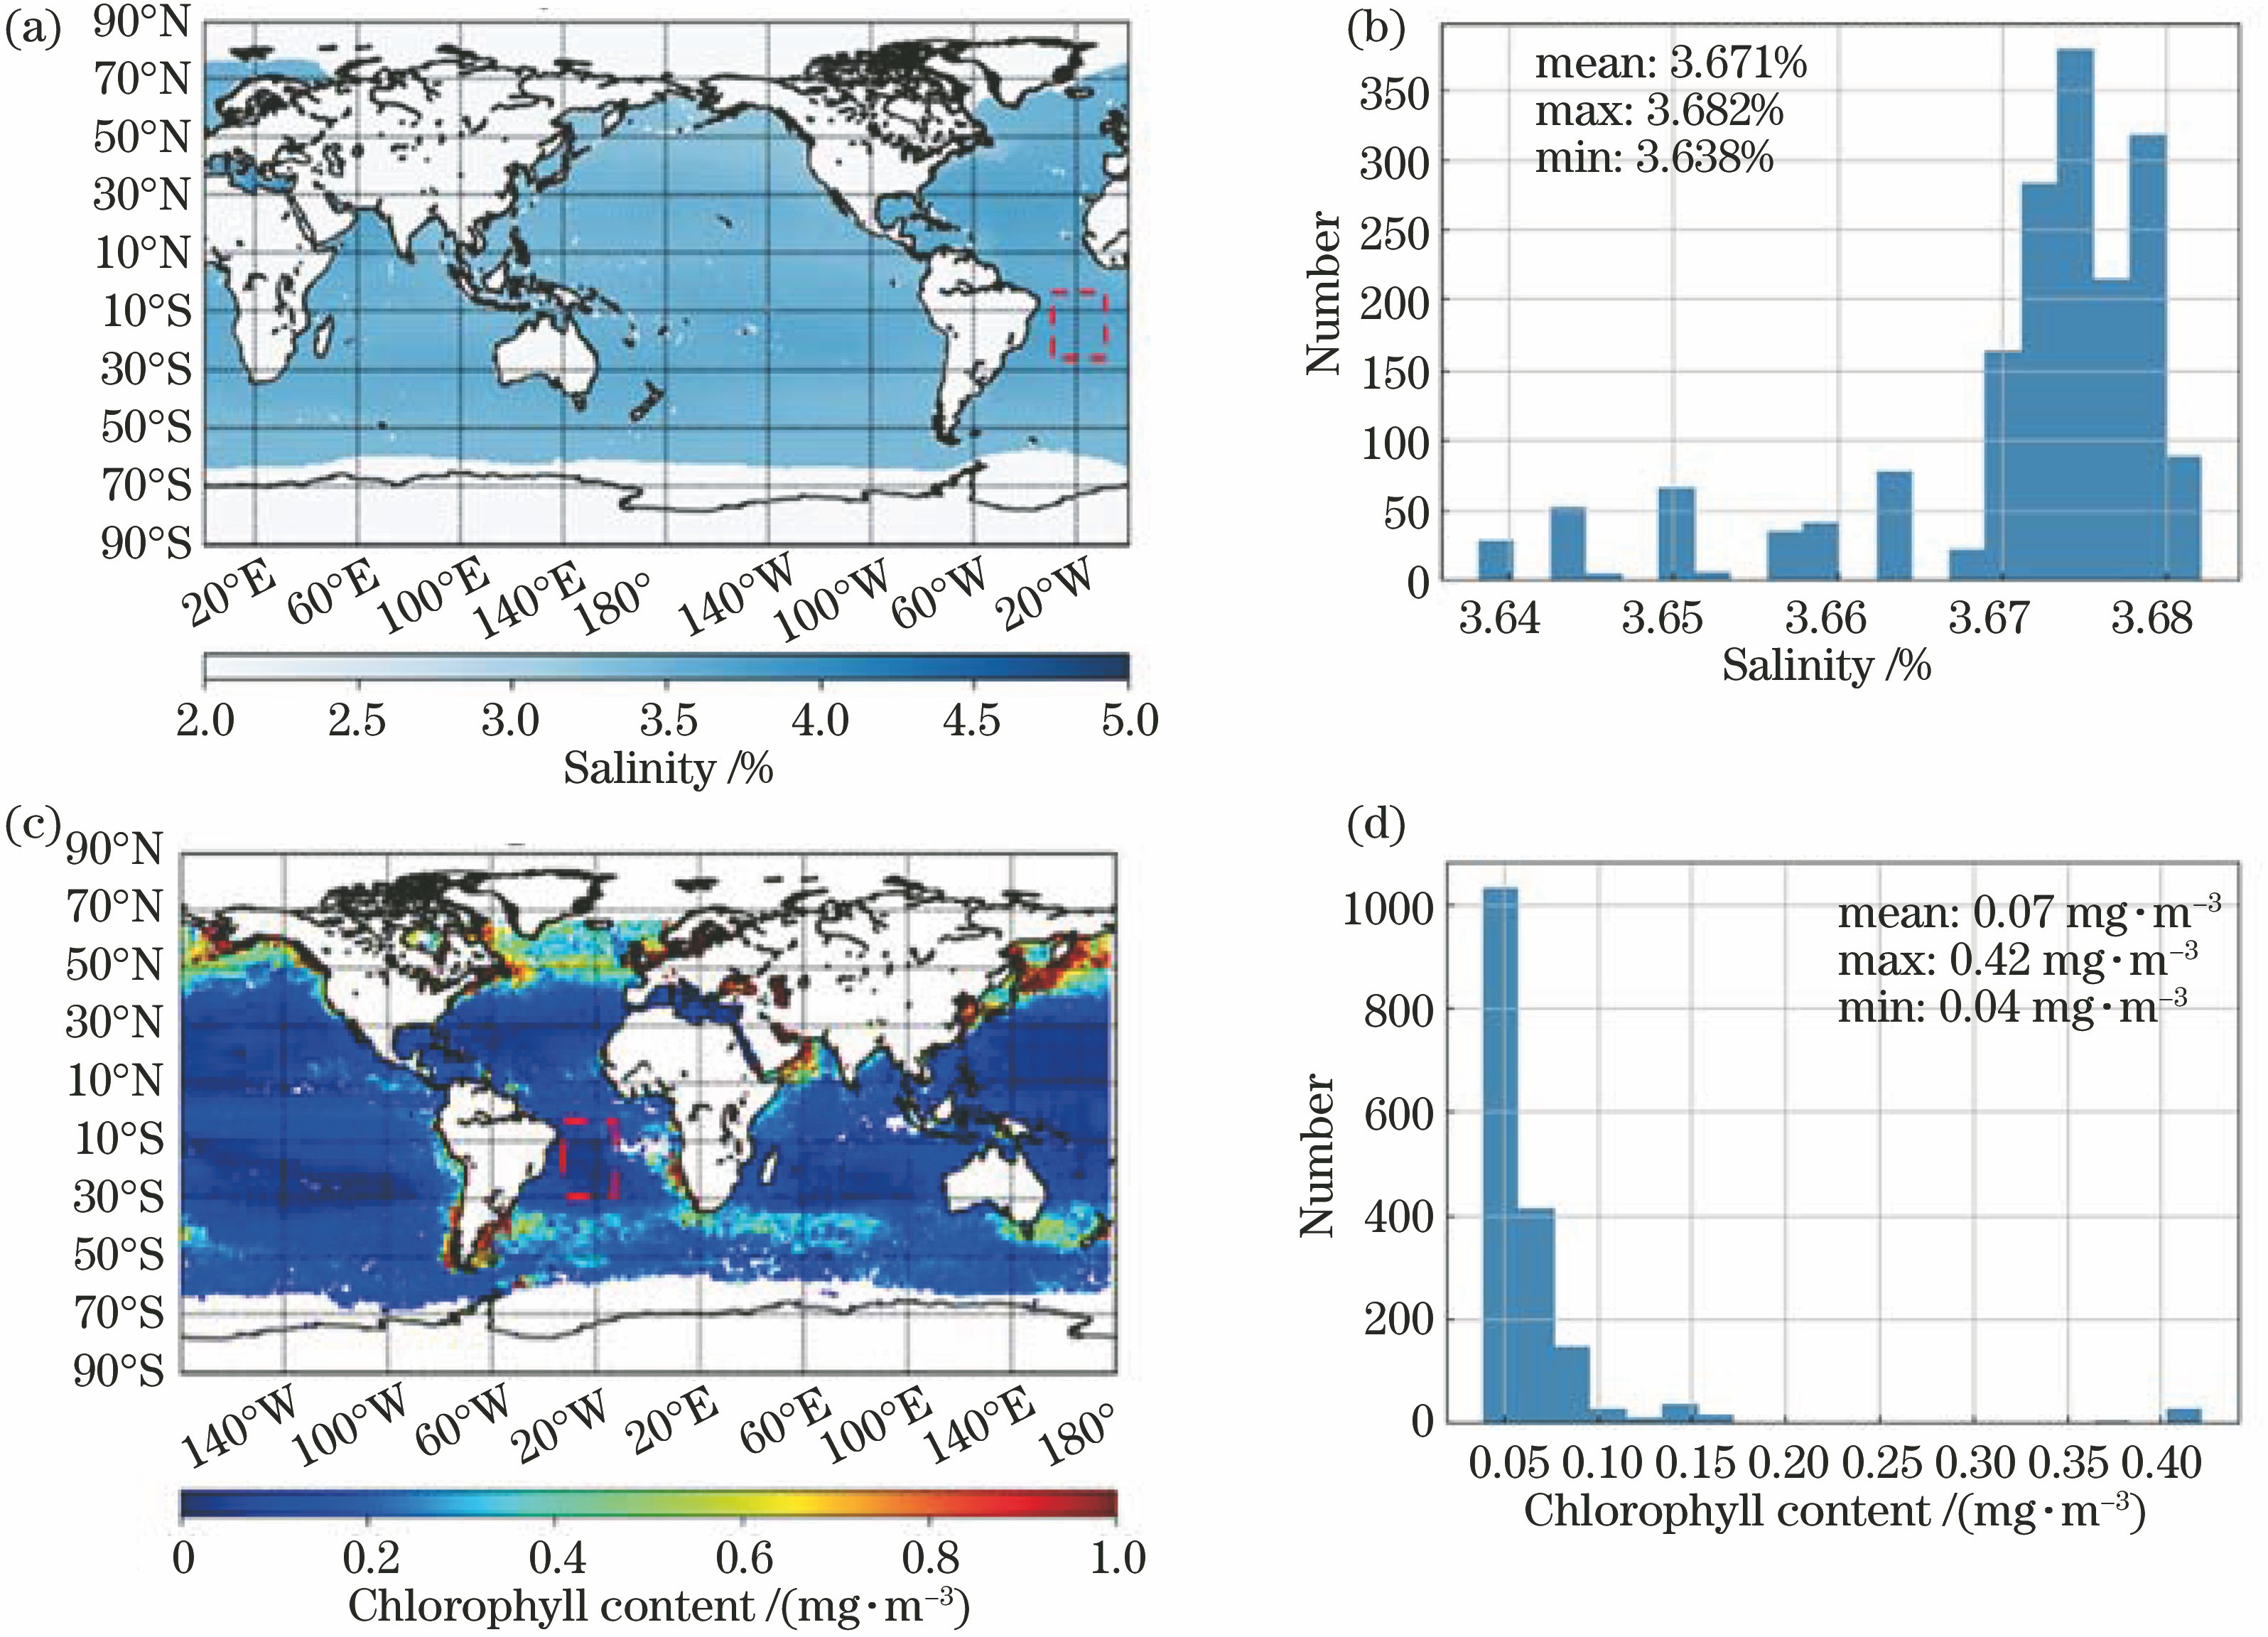
Fig. 2. Statistics of sea water impurity content. (a) Global monthly distribution of seawater salinity;(b) statistical histogram of salinity of AltS site;(c) global monthly distribution of seawater chlorophyll content; (d) statistical histogram of chlorophyll content of AltS site
Fig. 3. Statistical results of atmosphere parameters of AltS site on May 27, 2018. (a) Wind vector rose statistical diagram; (b) ozone content statistical histogram; (c) water vapor content statistical histogram
Fig. 4. Simulation results. (a) Variations of components' reflectances vary with relative azimuth angle in the case of fixed solar zenith angle and view zenith angle;(b) variations of components' reflectances vary with view zenith angle in the case of fixed solar zenith angle and relative azimuth angle
Fig. 5. Flow chart of in-flight radiation calibration
Fig. 6. Imaging data of AltS site of DPC on May 27, 2018. (a) Real color band fusion image; (b) cloud mask image
Fig. 7. Distribution of AOT550 at AltS site on May 27, 2018. (a) Distribution of AOT550 of MODIS at AltS site; (b) histogram of AOT550 difference between MODIS and DPC
Fig. 8. Spectral response functions of DPC at visible bands
Fig. 9. Statistical results of in-flight radiation calibration. (a) Band 443 nm; (b) band 490 nm; (c) band 565 nm; (d) band 670 nm
Fig. 10. TOA reflectance difference induced by the deviation of wind speed and wind azimuth. (a) TOA reflectance difference induced by the deviation of wind speed difference of 1 m/s; (b) TOA reflectance difference induced by the deviation of wind azimuth difference of 30°
Fig. 11. TOA reflectance difference induced by the deviation of chlorophyll content
Fig. 12. TOA reflectance difference induced by the deviation of AOT550 data
Fig. 13. TOA reflectance difference induced by the deviation of water vapor concentration
| ||||||||||||||||||||||||||||||||||||||||||||||||
Table 1. Band parameters and missions of DPC
|
Table 2. Error analysis of the source of in-flight calibration of DPC at visible wavelength bands
|
Table 3. Error budget of in-flight calibration of DPC at visible wavelength bands

Set citation alerts for the article
Please enter your email address
© Copyright 2018-2021 | Chinese Laser Press. All Rights Reserved 沪ICP备15018463号-20