Author Affiliations
1School of Artificial Intelligence, Henan University, Kaifeng 475004, Henan , China2Henan Key Laboratory of Big Data Analysis and Processing, Henan University, Kaifeng 475004, Henan , China3School of Computer Science and Engineering, Beihang University, Beijing 100191, Chinashow less
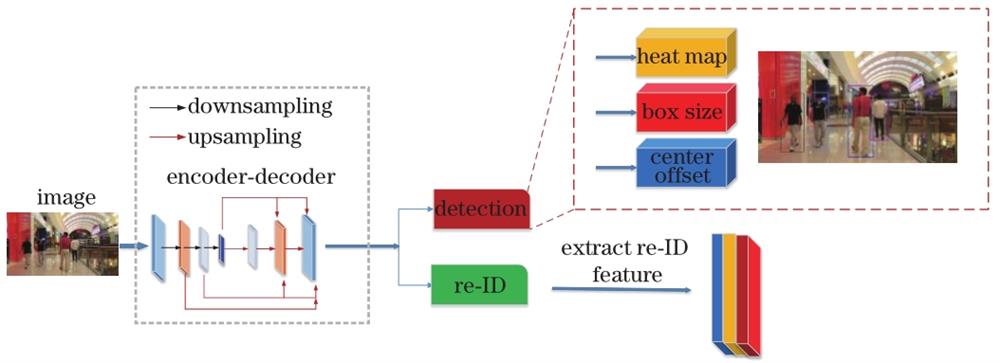
Fig. 1. Joint network architecture
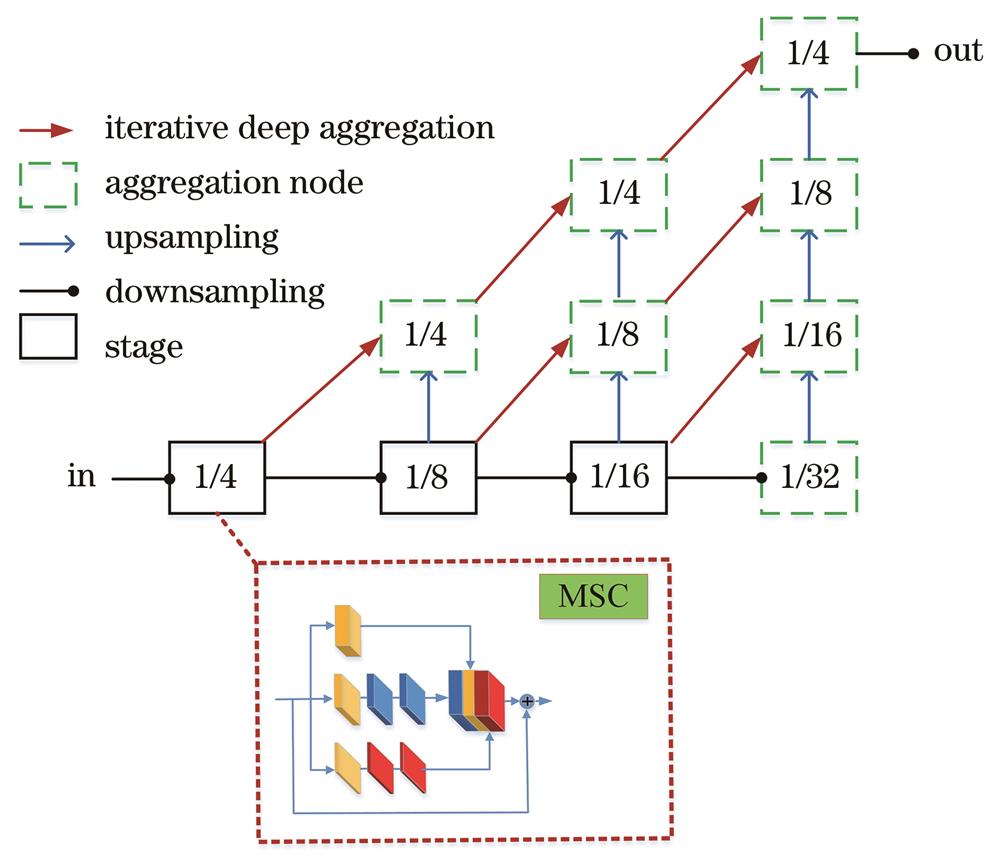
Fig. 2. Encoder-decoder network
Fig. 3. Detection branch outputing the heat map, center offset, and box size to determine the information of the bounding box and the re-identify branch outputing the classification probability of each ID
Fig. 4. Tracking result comparison between the MSC network and the original ResNet-34 network. (a) Detection result of the original ResNet-34 network; (b) detection result of the MSC network; (c) structure diagram of the original ResNet-34 network; (d) structure diagram of the MSC network
Fig. 5. Candidate box selection based on unified scoring mechanism
Fig. 6. Output results of the proposed method on MOT17 test set
Fig. 7. Reasoning time of MSC network and ResNet-34 network on three data sets
Configuration | Parameter |
---|
Operating system | Ubuntu 16.04 | RAM(random processing unit) | 128 G | CPU(central processing unit) | 2.50 GHz E5-2678 v3 | GPU(graphics processing unit) | Tesla T4 16 G | Software platform | Pytorch 1.1 Python 3.6 |
|
Table 1. Experimental platform parameters
Dimension | MOTA | IDF1 | IDs | Time /s |
---|
512 | 68.5 | 73.7 | 312 | 24.1 | 256 | 68.5 | 72.8 | 337 | 26.1 | 128 | 69.1 | 72.5 | 299 | 26.6 | 64 | 69.2 | 72.3 | 283 | 26.8 |
|
Table 2. Recognition feature dimensions evaluated on the MOT17 validation set
Box IoU | re-ID Features | Kalman Filter | MOTA | IDF1 | IDs |
---|
√ | | | 67.8 | 67.2 | 648 | | √ | | 68.1 | 70.3 | 435 | | √ | √ | 68.9 | 71.8 | 342 | √ | √ | √ | 69.1 | 72.8 | 299 |
|
Table 3. Evaluation of the three elements associated with the evaluation data on the MOT17 validation set
Network | MOTA | IDF1 | IDs |
---|
ResNet-34 | 63.6 | 67.2 | 435 | MSC | 69.1 | 72.8 | 299 |
|
Table 4. Comparison between MSC network and ResNet-34 network on MOT17 validation set
Dataset | Number of images | Number of boxes | Number of identities | MOTA | IDF1 | IDs |
---|
MOT17 | 5×10³ | 112×103 | 0.5×10³ | 69.1 | 72.8 | 299 | MIX | 54×103 | 270×103 | 8.7×10³ | 73.7 | 80.1 | 209 |
|
Table 5. Result using different datasets for training
Dataset | Tracker | MOTA | IDF1 | MT /% | ML /% | IDs | Time /s |
---|
MOT16 | EAMTT[23] | 52.5 | 53.3 | 19.9 | 34.9 | 910 | <5.5 | SORTwHPD16[24] | 59.8 | 53.8 | 25.4 | 22.7 | 1423 | <8.6 | DeepSORT_2[25] | 61.4 | 62.2 | 32.8 | 18.2 | 781 | <6.4 | RAR16wVGG[26] | 63.0 | 63.8 | 39.9 | 22.1 | 482 | <1.4 | VMaxx[27] | 62.6 | 49.2 | 32.7 | 21.1 | 1389 | <3.9 | TubeTK[28] | 64.0 | 59.4 | 33.5 | 19.4 | 1117 | 1.0 | JDE[3] | 64.4 | 55.8 | 35.4 | 20.0 | 1544 | 18.5 | TAP[29] | 64.8 | 73.5 | 38.5 | 21.6 | 571 | <8.0 | CNNMTT[30] | 65.2 | 62.2 | 32.4 | 21.3 | 946 | <5.3 | POI[31] | 66.1 | 65.1 | 34.0 | 20.8 | 805 | <5.0 | CTackerVI[32] | 67.6 | 57.2 | 32.9 | 23.1 | 1897 | 6.8 | Proposed method | 74.7 | 80.2 | 38.10 | 21.47 | 210 | 13.3 | MOT17 | SST[33] | 52.4 | 49.5 | 21.4 | 30.7 | 8431 | <3.96 | TubeTK[28] | 63.0 | 58.6 | 31.2 | 19.9 | 4137 | 3.0 | CTackerVI[32] | 66.6 | 57.4 | 32.2 | 24.2 | 5529 | 6.8 | CenterTack[34] | 67.3 | 59.9 | 34.6 | 24.6 | 2898 | 22.0 | Proposed method | 73.7 | 80.1 | 36.99 | 22.89 | 209 | 12.70 | MOT20 | ArTIST-T[35] | 53.6 | 51.0 | 31.6 | 28.1 | 1531 | | MPNTrack[36] | 57.6 | 59.1 | 38.2 | 22.5 | 1210 | | Proposed method | 66.4 | 72.8 | 46.87 | 14.84 | 1403 | 12.0 |
|
Table 6. Comparison of results of different methods