• Photonics Research
  • Vol. 5, Issue 6, 623 (2017)
Zhenzhong Hao1, Jie Wang1, Shuqiong Ma1, Wenbo Mao1, Fang Bo1、2、*, Feng Gao1、2, Guoquan Zhang1、2、3, and Jingjun Xu1、2、4
Author Affiliations
  • 1The MOE Key Laboratory of Weak Light Nonlinear Photonics, TEDA Institute of Applied Physics and School of Physics, Nankai University, Tianjin 300457, China
  • 2The Collaborative Innovation Center of Extreme Optics, Shanxi University, Taiyuan, Shanxi 030006, China
  • 3e-mail: zhanggq@nankai.edu.cn
  • 4e-mail: jjxu@nankai.edu.cn
  • show less
    DOI: 10.1364/PRJ.5.000623 Cite this Article Set citation alerts
    Zhenzhong Hao, Jie Wang, Shuqiong Ma, Wenbo Mao, Fang Bo, Feng Gao, Guoquan Zhang, Jingjun Xu. Sum-frequency generation in on-chip lithium niobate microdisk resonators[J]. Photonics Research, 2017, 5(6): 623 Copy Citation Text show less
    Illustration of the experimental setup for investigation of nonlinear effects in LN microdisks. AFG, arbitrary function generator; PD, photodetector.
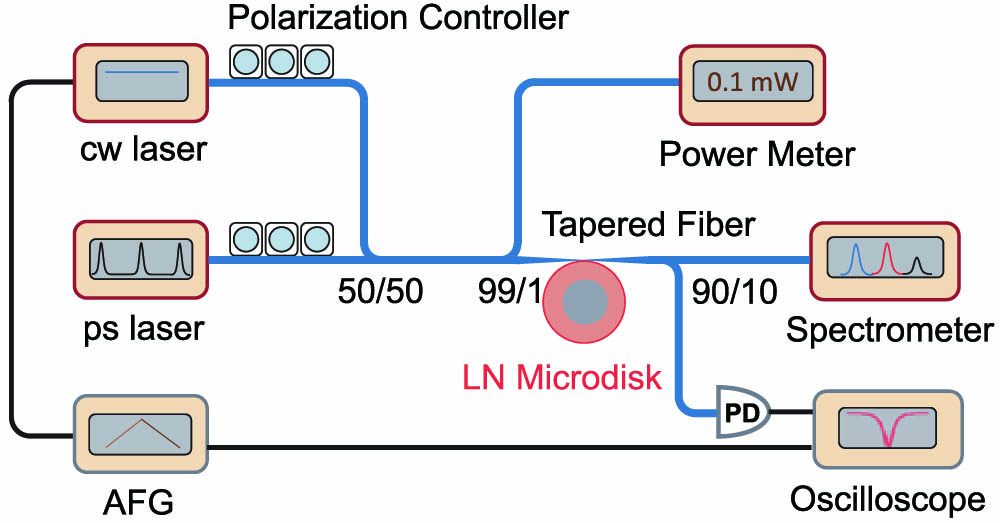
    Fig. 1. Illustration of the experimental setup for investigation of nonlinear effects in LN microdisks. AFG, arbitrary function generator; PD, photodetector.
    Spectra of nonlinear optical signals and the corresponding transmission of the pump. SHG signals of (a) pulsed and (b) cw pumps, respectively. (c) SFG (red bold line) and SHG signals (blue and black lines) obtained when both cw and pulsed pump lasers were coupled into the LN resonator. (d)–(f) Typical transmission of the pump correspond to (a)–(c), respectively. The wavelengths (input power) of the cw and pulsed lasers were 1547.0 and 1554.6 nm (8.02 and 0.52 mW), respectively.
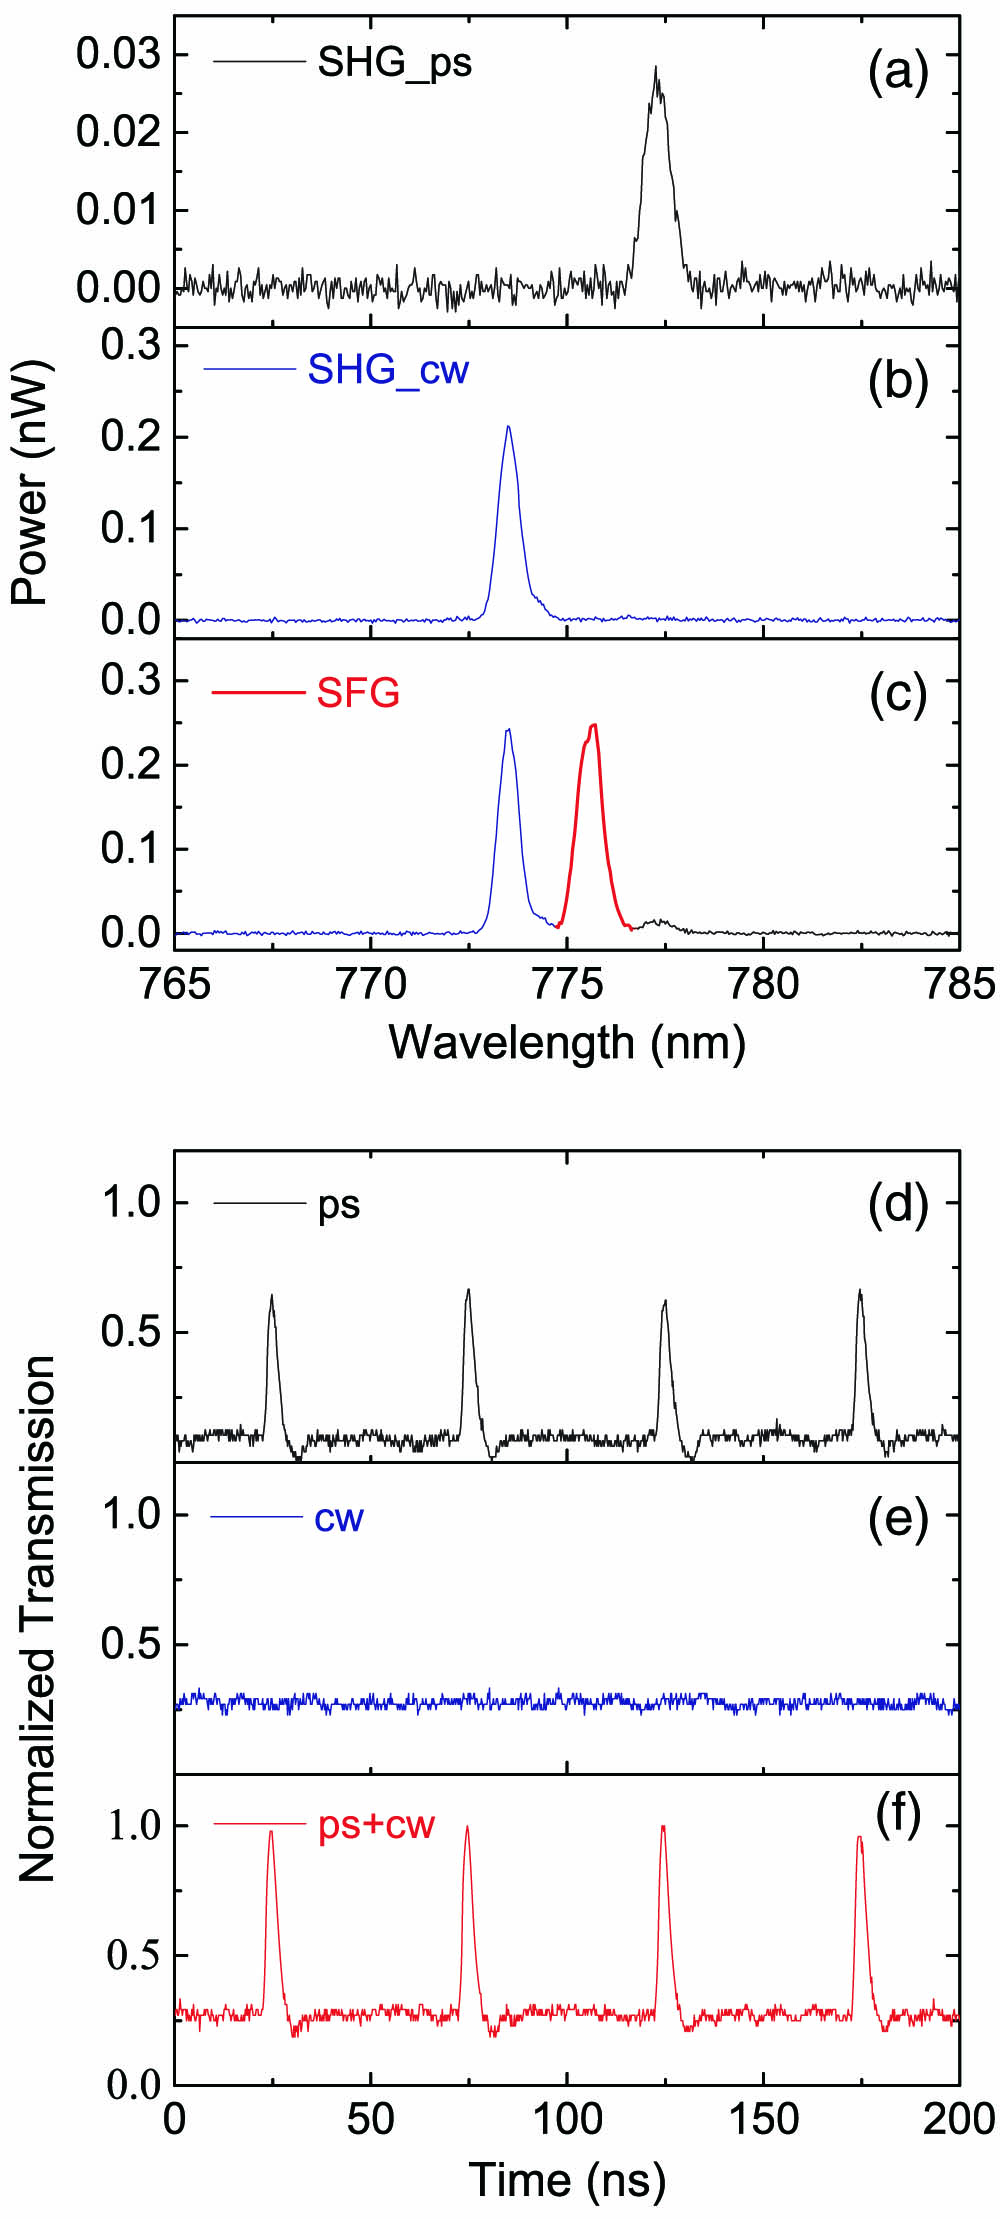
    Fig. 2. Spectra of nonlinear optical signals and the corresponding transmission of the pump. SHG signals of (a) pulsed and (b) cw pumps, respectively. (c) SFG (red bold line) and SHG signals (blue and black lines) obtained when both cw and pulsed pump lasers were coupled into the LN resonator. (d)–(f) Typical transmission of the pump correspond to (a)–(c), respectively. The wavelengths (input power) of the cw and pulsed lasers were 1547.0 and 1554.6 nm (8.02 and 0.52 mW), respectively.
    Spectra showing nonlinear optical signals for various cw laser wavelengths. The red, blue, and black peaks represent the SFG, SHG of cw laser, and SHG of pulsed laser, respectively. For demonstration, the vertical coordinate for each spectrum is shifted by 10 pW with respect to its preceding one. The wavelength of the pulsed pump was fixed at 1549.7 nm. The input power of the cw and pulsed pumps were set to be 7.81 and 0.51 mW, respectively.
    Fig. 3. Spectra showing nonlinear optical signals for various cw laser wavelengths. The red, blue, and black peaks represent the SFG, SHG of cw laser, and SHG of pulsed laser, respectively. For demonstration, the vertical coordinate for each spectrum is shifted by 10 pW with respect to its preceding one. The wavelength of the pulsed pump was fixed at 1549.7 nm. The input power of the cw and pulsed pumps were set to be 7.81 and 0.51 mW, respectively.
    Dependence of the SFG and SHG intensities on the wavelength of the cw pump and transmission spectra of the cw pump. (a)–(c) Nonlinear signals measured by scanning the wavelength of the cw laser near 1547.0 nm. The wavelength of the pulsed pump was fixed at 1554.6 nm. The input power of the cw and pulsed pumps were set to be 10.92 and 0.71 mW, respectively. (d) Sawtooth voltage for cw laser wavelength scan. Transmission spectra of the cw laser around 1543.0 nm under (e) strong and (f) weak pump, respectively.
    Fig. 4. Dependence of the SFG and SHG intensities on the wavelength of the cw pump and transmission spectra of the cw pump. (a)–(c) Nonlinear signals measured by scanning the wavelength of the cw laser near 1547.0 nm. The wavelength of the pulsed pump was fixed at 1554.6 nm. The input power of the cw and pulsed pumps were set to be 10.92 and 0.71 mW, respectively. (d) Sawtooth voltage for cw laser wavelength scan. Transmission spectra of the cw laser around 1543.0 nm under (e) strong and (f) weak pump, respectively.
    Dependence of nonlinear signals on pump power and the deduced SFG conversion efficiency. (a)–(c) Power of SHG signals of the cw and pulsed lasers and SFG signal with respect to the total pump power. (d) SFG conversion efficiency deduced from (c). The central wavelengths of the cw and ps lasers were set as 1547.0 and 1554.6 nm, respectively. The power ratio of the continuous laser and the pulsed laser was kept as 15.4:1.
    Fig. 5. Dependence of nonlinear signals on pump power and the deduced SFG conversion efficiency. (a)–(c) Power of SHG signals of the cw and pulsed lasers and SFG signal with respect to the total pump power. (d) SFG conversion efficiency deduced from (c). The central wavelengths of the cw and ps lasers were set as 1547.0 and 1554.6 nm, respectively. The power ratio of the continuous laser and the pulsed laser was kept as 15.4:1.
    Zhenzhong Hao, Jie Wang, Shuqiong Ma, Wenbo Mao, Fang Bo, Feng Gao, Guoquan Zhang, Jingjun Xu. Sum-frequency generation in on-chip lithium niobate microdisk resonators[J]. Photonics Research, 2017, 5(6): 623
    Download Citation