• Acta Optica Sinica
  • Vol. 41, Issue 10, 1012002 (2021)
Shuhang Li1、**, Xu Gao1、*, Zhaowu Liu2, and Wenhao Hu1
Author Affiliations
  • 1School of Opto-Electronic Engineering, Changchun University of Science and Technology, Changchun, Jilin 130022, China
  • 2Changchun Institute of Optics, Fine Mechanics and Physics, Chinese Academy of Sciences, Changchun, Jilin 130033, China
  • show less
    DOI: 10.3788/AOS202141.1012002 Cite this Article Set citation alerts
    Shuhang Li, Xu Gao, Zhaowu Liu, Wenhao Hu. Algorithm for Sub-Pixel Detection of Fringe Image Displacement Based on Gray-Level Interpolation[J]. Acta Optica Sinica, 2021, 41(10): 1012002 Copy Citation Text show less
    Principle diagram of displacement measurement system
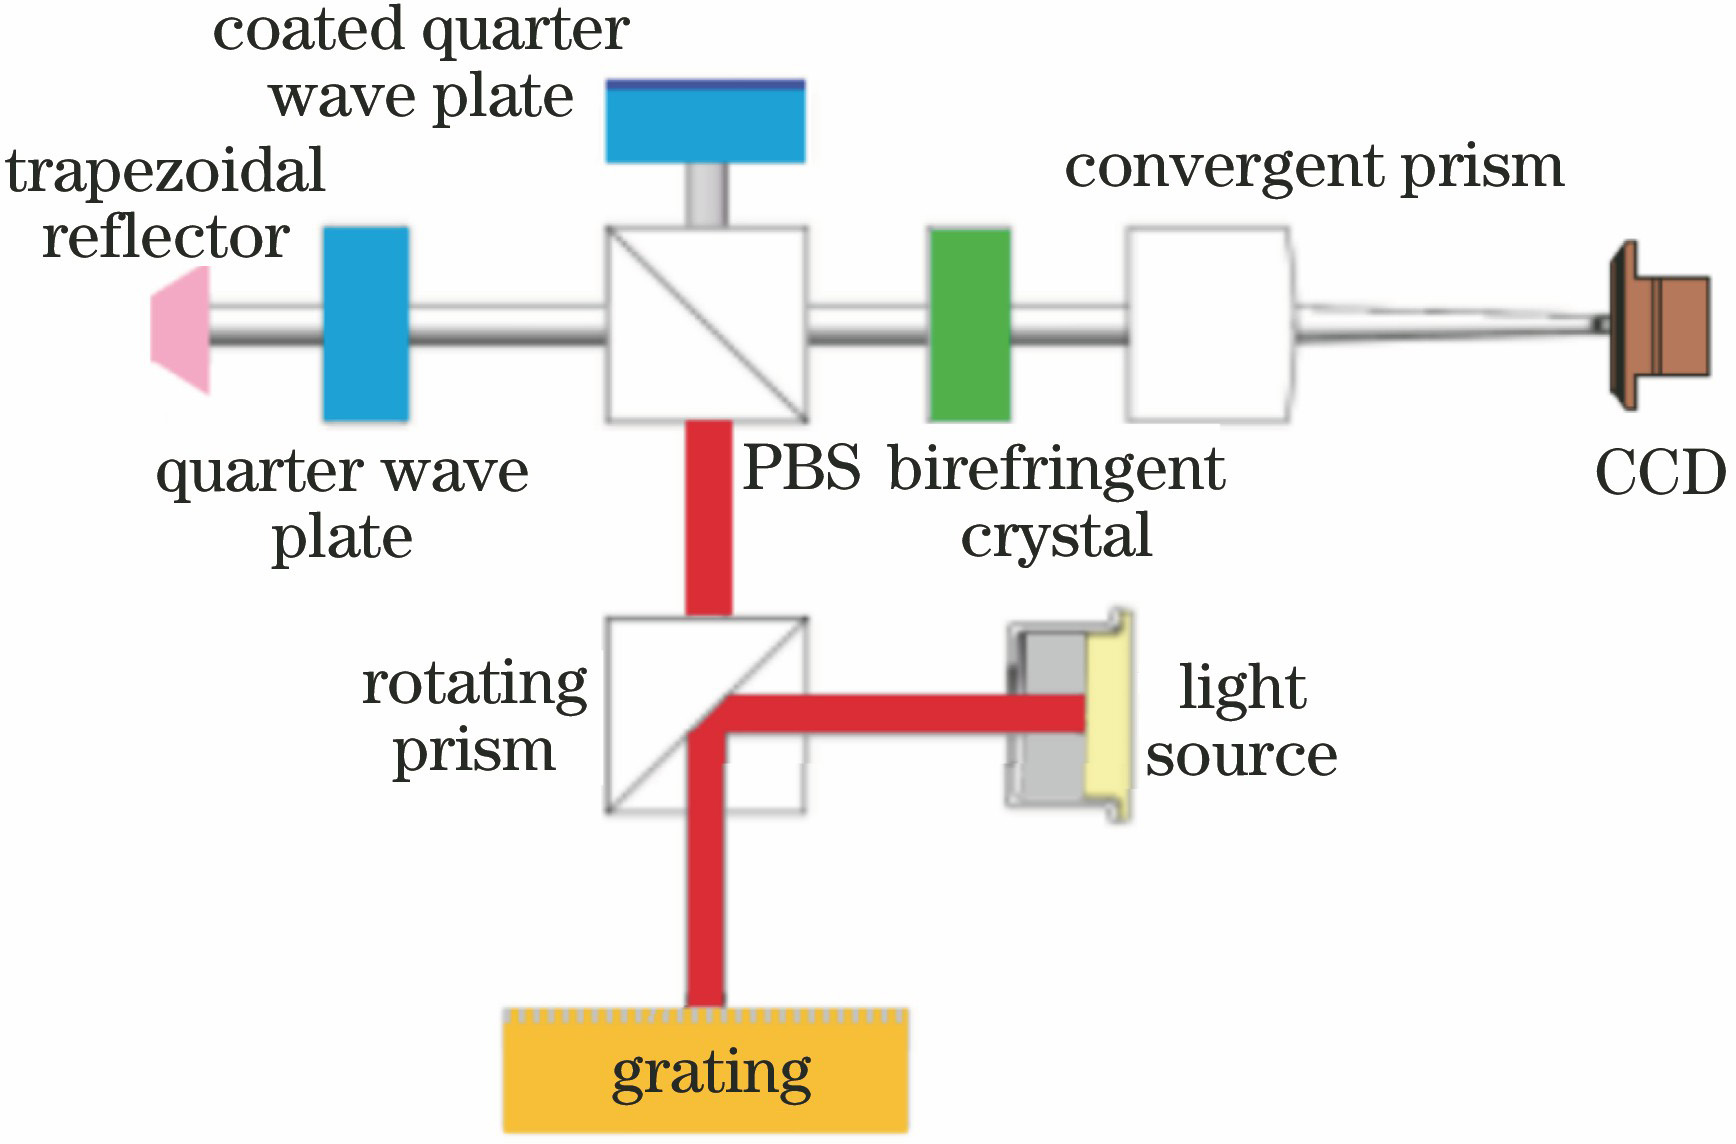
    Fig. 1. Principle diagram of displacement measurement system
    Simulated image of virtual moire fringe
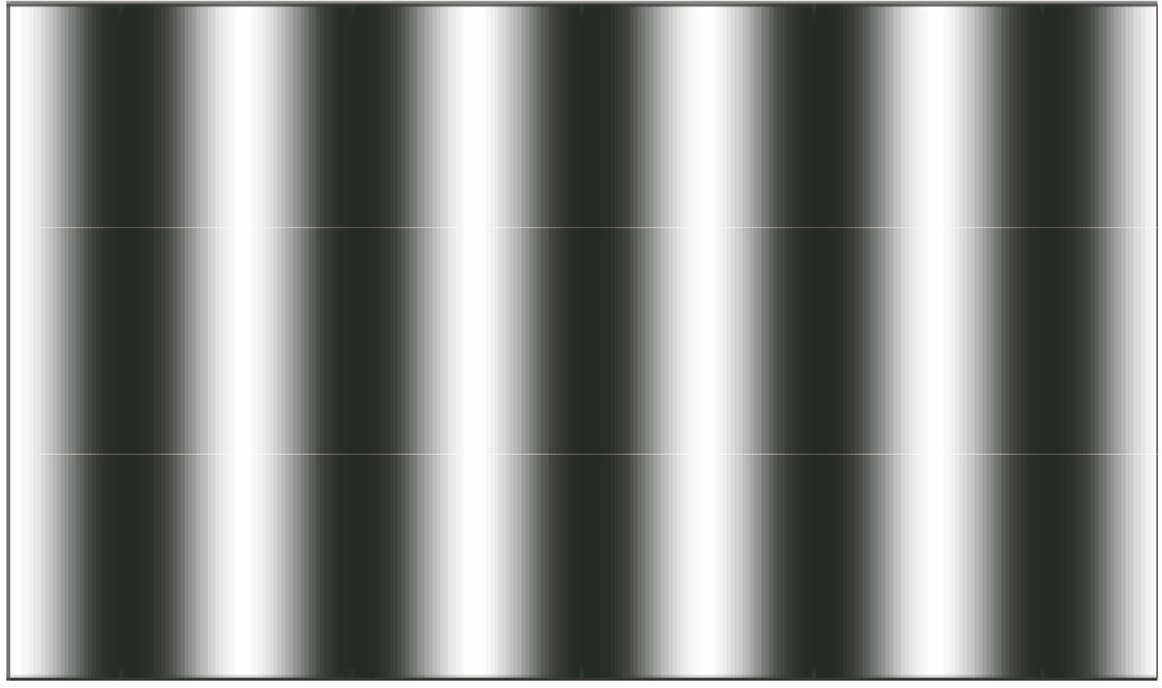
    Fig. 2. Simulated image of virtual moire fringe
    Flow chart of grayscale extreme value algorithm
    Fig. 3. Flow chart of grayscale extreme value algorithm
    Simulation experiment. (a) Interference fringe; (b) gray three-dimensional model; (c) gray interpolation fitting curve; (d) bright fringe sub-pixel center line
    Fig. 4. Simulation experiment. (a) Interference fringe; (b) gray three-dimensional model; (c) gray interpolation fitting curve; (d) bright fringe sub-pixel center line
    28 fringe images with phase step of π/50
    Fig. 5. 28 fringe images with phase step of π/50
    Grayscale image and relative error versus phase under different algorithms. (a) Three-dimensional grayscale image; (b) grayscale extreme value method; (c) image correlation method; (d) L-K optical flow method
    Fig. 6. Grayscale image and relative error versus phase under different algorithms. (a) Three-dimensional grayscale image; (b) grayscale extreme value method; (c) image correlation method; (d) L-K optical flow method
    Relative calculation time
    Fig. 7. Relative calculation time
    Experimental device for interference displacement measurement
    Fig. 8. Experimental device for interference displacement measurement
    Experimental data graphs. (a) Step-displacement graph; (b) scatter plot of measured values; (c) residual diagram; (d) relative error-displacement needle plot
    Fig. 9. Experimental data graphs. (a) Step-displacement graph; (b) scatter plot of measured values; (c) residual diagram; (d) relative error-displacement needle plot
    Shuhang Li, Xu Gao, Zhaowu Liu, Wenhao Hu. Algorithm for Sub-Pixel Detection of Fringe Image Displacement Based on Gray-Level Interpolation[J]. Acta Optica Sinica, 2021, 41(10): 1012002
    Download Citation