
Xue Han, Viet Giang Truong, Prince Sunil Thomas, Síle Nic Chormaic. Sequential trapping of single nanoparticles using a gold plasmonic nanohole array[J]. Photonics Research, 2018, 6(10): 981
- Photonics Research
- Vol. 6, Issue 10, 981 (2018)
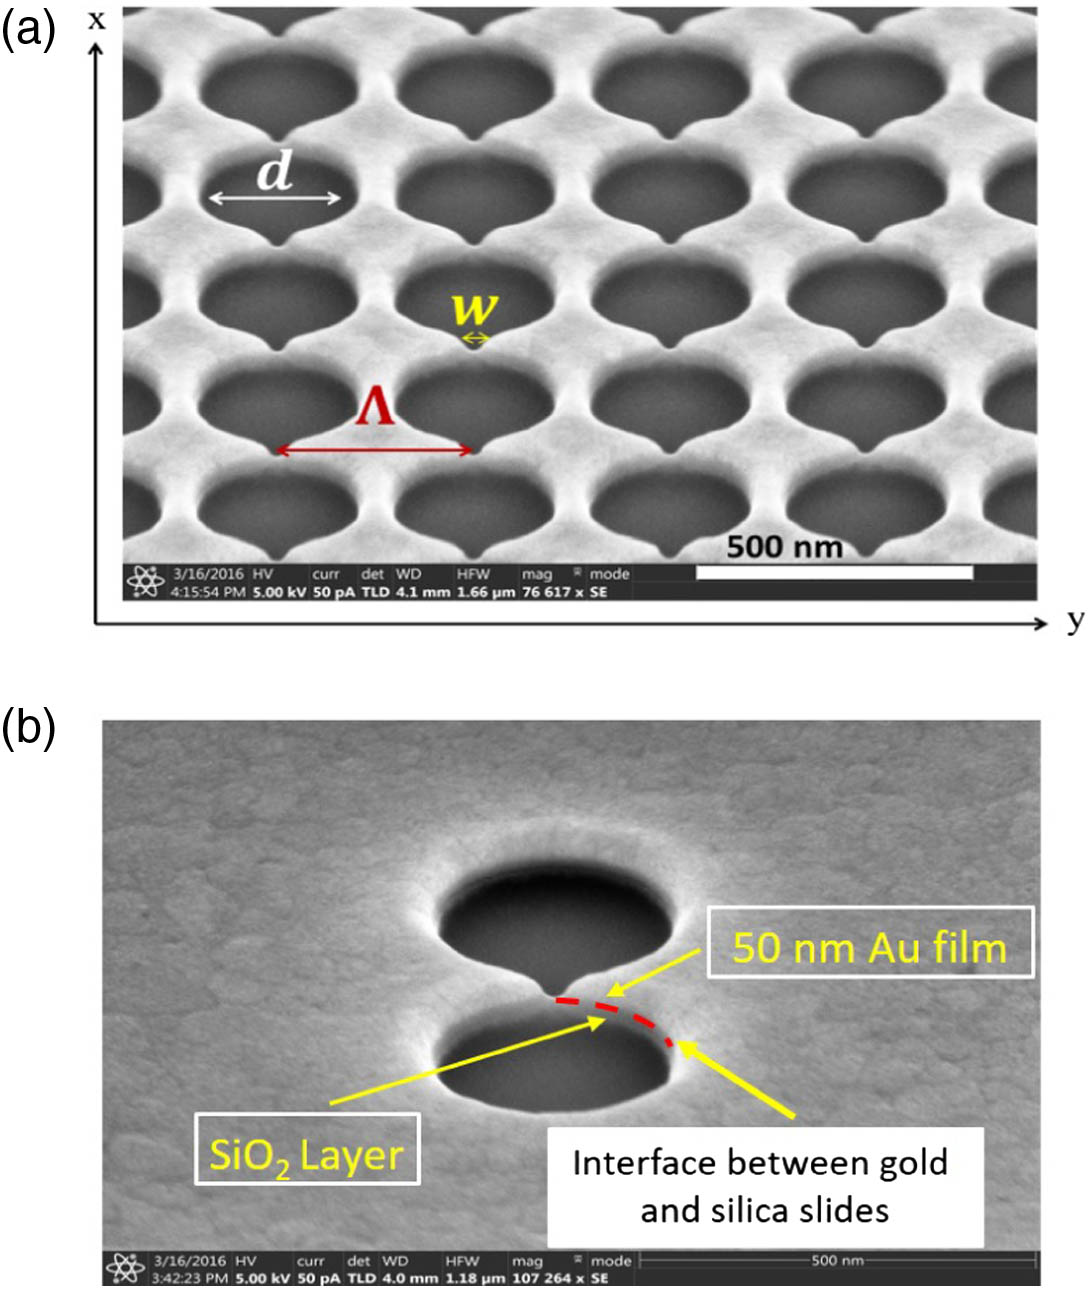
Fig. 1. (a) SEM image of a fabricated nanohole array. The nanoslot is designed to connect the nanoholes of diameter d x w Λ x y z
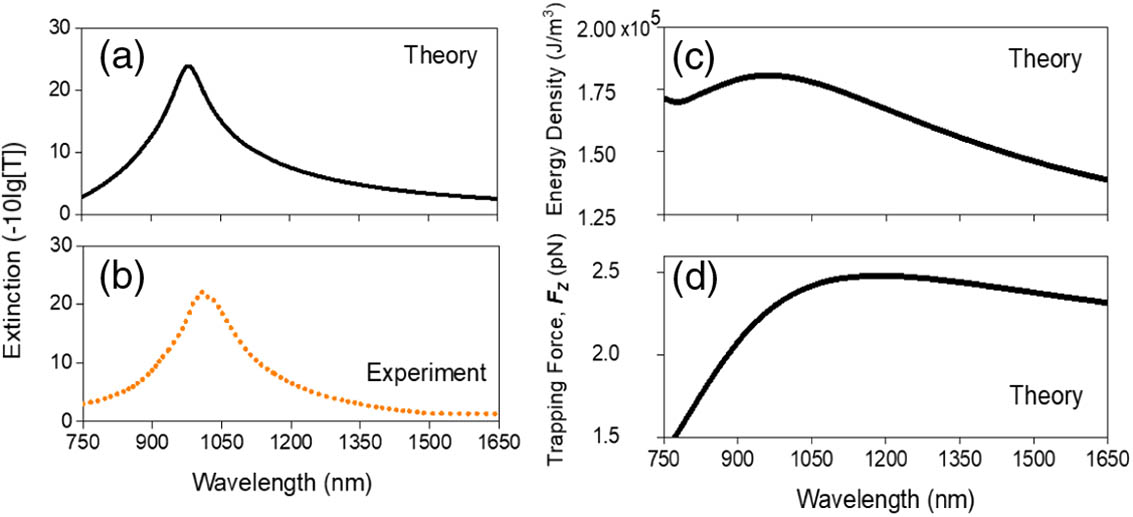
Fig. 2. (a) Simulated and (b) experimental extinction curves extracted from the transmission spectra; (c) energy density from the highest near-field confined area and (d) trapping force along the z
Fig. 3. (a) Electric field distribution for the y = 0 z x = 0 nm y = 0 nm
Fig. 4. Electric field distribution on the (a) z = 18 nm x = 0 nm x y
Fig. 5. Raw data trace of transmission signal against time. A zoomed in step increase around the time point of 147.7 s is shown in the inset, which represents a time interval of 0.003 s.
Fig. 6. (a) Trap stiffness for a single 30 nm PS sphere in a near-field trap as a function of wavelength. The experiment was done for an incident laser intensity of 0.57 mW / μm 2 1 mW / μm 2
|
Table 1. Simulated and Experimental Trap Stiffnessa

Set citation alerts for the article
Please enter your email address
© Copyright 2018-2021 | Chinese Laser Press. All Rights Reserved 沪ICP备15018463号-20