• Journal of Resources and Ecology
  • Vol. 11, Issue 3, 272 (2020)
Yanan CAO1, Jianshuang WU2, Xianzhou ZHANG3、4、*, Ben NIU3, and Yongtao HE3、4
Author Affiliations
  • 1School of Earth Science and Engineering, Hebei University of Engineering, Handan 056038, Hebei, China
  • 2Institute of Environment and Sustainable Development in Agriculture, Chinese Academy of Agricultural Sciences, Beijing 100081, China
  • 3Lhasa Plateau Ecosystem Research Station, Key Laboratory of Ecosystem Network Observation and Modelling, Institute of Geographic Sciences and Natural Resources Research, Chinese Academy of Sciences, Beijing 100101, China
  • 4College of Resources and Environment, University of Chinese Academy of Sciences, Beijing 100049, China
  • show less
    DOI: 10.5814/j.issn.1674-764X.2020.03.004 Cite this Article
    Yanan CAO, Jianshuang WU, Xianzhou ZHANG, Ben NIU, Yongtao HE. Comparison of Methods for Evaluating the Forage-livestock Balance of Alpine Grasslands on the Northern Tibetan Plateau[J]. Journal of Resources and Ecology, 2020, 11(3): 272 Copy Citation Text show less
    Basic information for the study area. Panel (a) shows the grassland types on the NTP and sampling sites used in this study. Panel (b) shows the spatial distribution of precipitation amounts and Panel (c) shows the change trend of total precipitation during the growing season (GSP). Panel (d) shows the spatial distribution of average temperatures and Panel (e) shows the change trend of the average temperature during the growing season (GSMT).
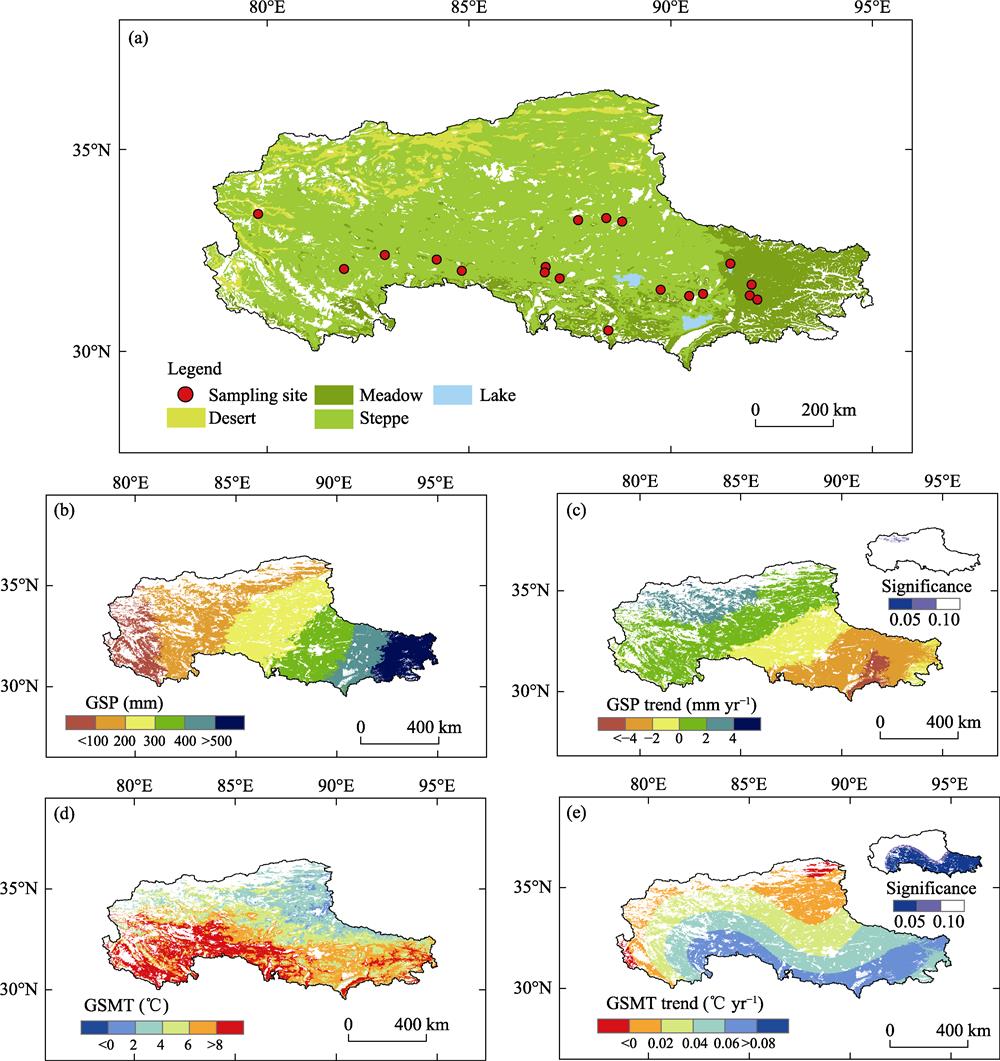
    Fig. 1. Basic information for the study area. Panel (a) shows the grassland types on the NTP and sampling sites used in this study. Panel (b) shows the spatial distribution of precipitation amounts and Panel (c) shows the change trend of total precipitation during the growing season (GSP). Panel (d) shows the spatial distribution of average temperatures and Panel (e) shows the change trend of the average temperature during the growing season (GSMT).
    The correlations between the model simulation and field observations of aboveground biomass (AGB). (a) is for aboveground biomass of fenced grasslands (AGBF) and (b) is for aboveground biomass of open grasslands under grazing (AGBG)
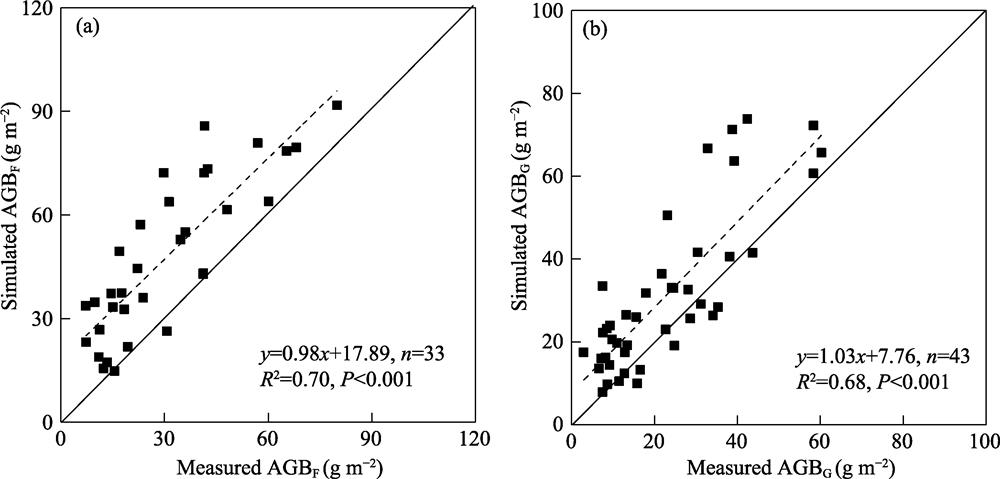
    Fig. 2. The correlations between the model simulation and field observations of aboveground biomass (AGB). (a) is for aboveground biomass of fenced grasslands (AGBF) and (b) is for aboveground biomass of open grasslands under grazing (AGBG)
    Inter-annual variations of aboveground biomass (AGB) in alpine grassland on the northern Tibetan Plateau. (a) is for aboveground biomass of fenced grasslands (AGBF), (b) is for aboveground biomass at open grasslands under grazing (AGBG), and (c) is for human-induced aboveground biomass (AGBH).
    Fig. 3. Inter-annual variations of aboveground biomass (AGB) in alpine grassland on the northern Tibetan Plateau. (a) is for aboveground biomass of fenced grasslands (AGBF), (b) is for aboveground biomass at open grasslands under grazing (AGBG), and (c) is for human-induced aboveground biomass (AGBH).
    Spatial distribution and change trends for aboveground biomass from 2000 and 2016 on the northern Tibetan Plateau. (a), (c) and (e) show the spatial distribution of aboveground biomass for fenced grasslands (AGBF), for open grasslands under grazing (AGBG) and for human-induced aboveground biomass (AGBH), respectively. (b), (d) and (f) show the change trends for aboveground biomass for fenced grasslands (AGBF), for open grasslands under grazing (AGBG) and for human-induced aboveground biomass (AGBH), respectively.
    Fig. 4. Spatial distribution and change trends for aboveground biomass from 2000 and 2016 on the northern Tibetan Plateau. (a), (c) and (e) show the spatial distribution of aboveground biomass for fenced grasslands (AGBF), for open grasslands under grazing (AGBG) and for human-induced aboveground biomass (AGBH), respectively. (b), (d) and (f) show the change trends for aboveground biomass for fenced grasslands (AGBF), for open grasslands under grazing (AGBG) and for human-induced aboveground biomass (AGBH), respectively.
    Inter-annual variations of carrying capacity of alpine grasslands on the northern Tibetan Plateau.
    Fig. 5. Inter-annual variations of carrying capacity of alpine grasslands on the northern Tibetan Plateau.
    The carrying capacity of alpine grasslands from 2000 and 2016 for each county of the northern Tibetan Plateau
    Fig. 6. The carrying capacity of alpine grasslands from 2000 and 2016 for each county of the northern Tibetan Plateau
    Inter-annual variations of the grazing pressure index on the northern Tibetan Plateau. (a) shows the grazing pressure index obtained by the statical method and (b) shows the grazing pressure index obtained by the dynamic method.
    Fig. 7. Inter-annual variations of the grazing pressure index on the northern Tibetan Plateau. (a) shows the grazing pressure index obtained by the statical method and (b) shows the grazing pressure index obtained by the dynamic method.
    The grazing pressure index in each county of the northern Tibetan Plateau between 2000 and 2016. (a) shows the grazing pressure index obtained by the statical method and (b) shows the grazing pressure index obtained by the dynamic method.
    Fig. 8. The grazing pressure index in each county of the northern Tibetan Plateau between 2000 and 2016. (a) shows the grazing pressure index obtained by the statical method and (b) shows the grazing pressure index obtained by the dynamic method.
    Yanan CAO, Jianshuang WU, Xianzhou ZHANG, Ben NIU, Yongtao HE. Comparison of Methods for Evaluating the Forage-livestock Balance of Alpine Grasslands on the Northern Tibetan Plateau[J]. Journal of Resources and Ecology, 2020, 11(3): 272
    Download Citation