• Journal of Resources and Ecology
  • Vol. 11, Issue 3, 272 (2020)
Yanan CAO1, Jianshuang WU2, Xianzhou ZHANG3、4、*, Ben NIU3, and Yongtao HE3、4
Author Affiliations
  • 1School of Earth Science and Engineering, Hebei University of Engineering, Handan 056038, Hebei, China
  • 2Institute of Environment and Sustainable Development in Agriculture, Chinese Academy of Agricultural Sciences, Beijing 100081, China
  • 3Lhasa Plateau Ecosystem Research Station, Key Laboratory of Ecosystem Network Observation and Modelling, Institute of Geographic Sciences and Natural Resources Research, Chinese Academy of Sciences, Beijing 100101, China
  • 4College of Resources and Environment, University of Chinese Academy of Sciences, Beijing 100049, China
  • show less
    DOI: 10.5814/j.issn.1674-764X.2020.03.004 Cite this Article
    Yanan CAO, Jianshuang WU, Xianzhou ZHANG, Ben NIU, Yongtao HE. Comparison of Methods for Evaluating the Forage-livestock Balance of Alpine Grasslands on the Northern Tibetan Plateau[J]. Journal of Resources and Ecology, 2020, 11(3): 272 Copy Citation Text show less

    Abstract

    Livestock grazing is one of primary way to use grasslands throughout the world, and the forage-livestock balance of grasslands is a core issue determining animal husbandry sustainability. However, there are few methods for assessing the forage-livestock balance and none of those consider the dynamics of external abiotic factors that influence forage yields. In this study, we combine long-term field observations with remote sensing data and meteorological records of temperature and precipitation to quantify the impacts of climate change and human activities on the forage-livestock balance of alpine grasslands on the northern Tibetan Plateau for the years 2000 to 2016. We developed two methods: one is statical method based on equilibrium theory and the other is dynamic method based on non-equilibrium theory. We also examined the uncertainties and shortcomings of using these two methods as a basis for formulating policies for sustainable grassland management. Our results from the statical method showed severe overgrazing in the grasslands of all counties observed except Nyima (including Shuanghu) for the entire period from 2000 to 2016. In contrast, the results from the dynamic method showed overgrazing in only eight years of the study period 2000-2016, while in the other nine years alpine grasslands throughout the northern Tibetan Plateau were less grazed and had forage surpluses. Additionally, the dynamic method found that the alpine grasslands of counties in the northeastern and southwestern areas of the northern Tibetan Plateau were overgrazed, and that alpine grasslands in the central area of the plateau were less grazed with forage surpluses. The latter finding is consistent with field surveys. Therefore, we suggest that the dynamic method is more appropriate for assessment of forage-livestock management efforts in alpine grasslands on the northern Tibetan Plateau. However, the statical method is still recommended for assessments of alpine grasslands profoundly disturbed by irrational human activities.

    1 Introduction

    Grassland ecosystems that provide multiple ecosystem services and have significant ecological and economic values to human beings are widely distributed in central Asia (Krausmann et al., 2013; Ebrahimi et al., 2016; Schirpke et al., 2017). Climate change and irrational human activities have caused severe grassland degradation with declining ecosystem functions (Gang et al., 2014; Cai et al., 2015). Global warming and changes in precipitation fundamentally impact grassland ecosystems (Xu et al., 2016; Petrie et al., 2018; Zhang et al., 2018). However, anthropogenic impacts are more direct and impact grassland ecosystems more rapidly (Li et al., 2009; Luo et al., 2018). Grassland degradation is likely due to overgrazing that exceeds forage yields with consentaneous declines in soil fertility and uncoverable changes in plant community assembly (Petz et al., 2014; Ren et al., 2016). Therefore, it is essential to assess the status of the forage-livestock balance for sustainable management of alpine grasslands (Fan et al., 2010; Zhang et al., 2014).

    Previous studies have generally based the assessment of forage-livestock balance on a statical method featuring the use of unified and unchanging parameters, for example, daily forage intake per standardized sheep unit. However, the parameters related to forage intake by livestock vary with climate features, livestock types, and forage quality (Jia, 2005; Xu et al., 2014). Field observations and modelling simulations are two methods for forage yield estimation that can determine stocking rates in a given pasture. Field observations are time-consuming and not feasible at a large scale in practice. Vegetation process models that include climate variables and vegetation properties as inputs, and empirical models based on the relationships between remote sensing data and field observations are more widely used for large scale grassland forage estimations (Lieth and Whittaker, 1975; Melillo et al., 1993; Potter et al., 1993). In order to facilitate comparison and evaluation, livestock of different types, sizes, and ages are converted into standard sheep units (SU). In China, an adult sheep of 45 kg is viewed as the SU, and the daily forage intake of a single SU is set at 1.8 kg dry hay per day (NY/T635-2015). However, due to natural conditions and grazing restrictions, the actual daily feed intake by livestock may be a bit more or less than the value set for per SU. The forage utilization rate is a crucial parameter in calculating stocking capacity (Hunt, 2008; Scarnecchia, 1985). The statical method for evaluating the forage-livestock balance usually sets the forage utilization rate at 50%, meaning that half of the aboveground biomass of grassland can be taken in by livestock, while the other half should remain for forage regrowth (Holechek, 1988; Xu et al., 2014). A statical forage-livestock balance aims mainly to maintain the stability of grassland ecosystems, and does not take into consideration the adaptability of both forage plants and livestock animals to environmental changes (Holechek, 1999). The non-equilibrium theory emphasizes the effects of random abiotic drivers on the dynamics of forage yield and livestock quantity, and requires making adjustments to livestock population in semi-arid grasslands, based on the fluctuations of forage yield that are likely due to climate change and land-use change (Cao et al., 2019). Therefore, a dynamic assessment of the forage-livestock balance is required to keep in step with actual climate change at local scales.

    In China, alpine grasslands are distributed mainly on the Qinghai-Tibet Plateau (QTP). The unique geographical regimes and harsh physical conditions of this plateau make its alpine grasslands vulnerable to climate change and human activities (Piao et al., 2013). Climate change and irrational human activities have caused degradation in nearly half of alpine grassland on the QTP (Harris, 2010). Against a background of significant warming and very low humidity on the QTP, the productivity of alpine grasslands has also changed (Chen et al., 2014; Li et al., 2018). Grazing is the primary way people utilize QTP grasslands. Compared with climate change, the impact of human activities on QTP alpine grasslands is more direct and occurs more rapidly (Luo et al., 2018). Overgrazing has resulted in decreased grassland productivity and changes in physical and chemical soil properties (Harris, 2010; Fan et al., 2013). However, the implementation of fence enclosures, ecological projects, and eco-compensation policies on the QTP are likely to have positive effects on the restoration of degrad (Yu et al., 2016; Wu et al., 2017). The alpine grasslands of the QTP are responsible for regional animal husbandry development and are essential to the livelihoods of people who live in these alpine pastoral areas. Therefore, an appropriate method for assessing the forage-livestock balance can help policymakers and stakeholders achieve sustainable management goals for both livestock and forage in alpine grasslands on the QTP.

    In this study, based on long-term field observations, both statical and dynamic methods were used to evaluate the forage-livestock balance. We aim to: 1) establish and validate with actual field observations the relationship between climate data and the normalized difference vegetation index (NDVI), and to quantify the relative impact of climate change and human activities on aboveground biomass (forage) production in alpine grasslands on the northern Tibetan Plateau (NTP); 2) calculate the actual and proper carrying capacities of NTP alpine grasslands using both the statical and dynamic methods; 3) use forage yield estimates produced by the two methods to determine the stocking pressure on the alpine grasslands, and to examine the status of the forage-livestock balance for alpine grasslands at the county level to determine whether they are overgrazed, less-grazed, or forage-livestock balanced; and 4) document the advantages and challenges of both statical and dynamic methods, providing a reference for the scientific evaluation of forage-livestock balance management in practice.

    2 Materials and methods

    2.1 Study area

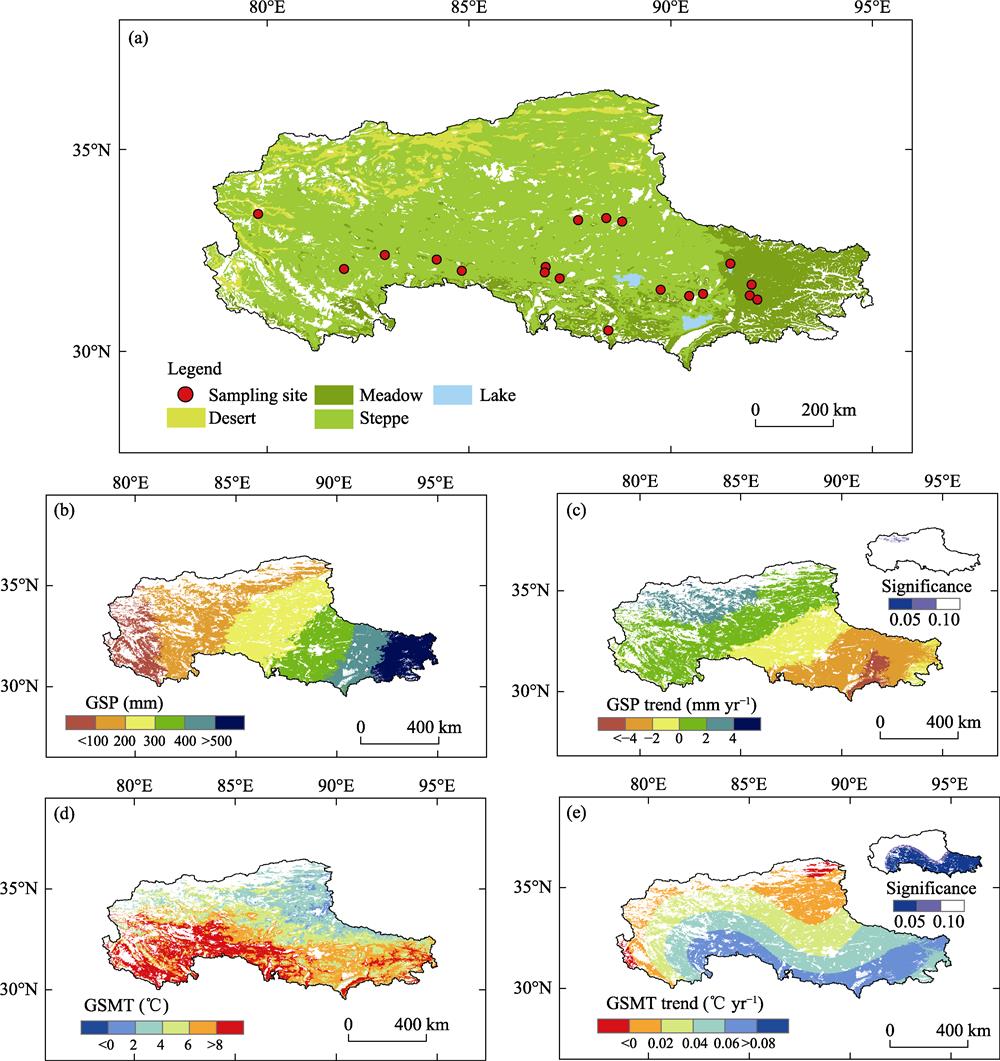
    Locally, the NTP is known as “Changtang” and is located in the northwestern hinterland of the QTP, with an area of about 5.95 × 10⁵ km2 (Fig. 1). The NTP has a typical plateau continental climate with an mean temperature of 【-逻*辑*与-】lt;10 ℃ during the growing season (GSMT) in most areas. Total precipitation during the growing season (GSP) ranges from 50 to 600 mm and shows a decreasing trend from southeast to northwest. There are evident seasonal variations in hydrothermal conditions. It is warm and rainy during the plant growing season from May to September, with 65% to 85% of annual precipitation falling during this period (Wu et al., 2014). The spatial distribution of natural zonal grasslands and aboveground primary productivity is consistent with the general climate pattern, and especially with the amount of precipitation (Zhong et al., 2010). Vegetation types are typical for alpine meadow dominated by Kobresia pygmaea, alpine steppe dominated by Stipa purpurea, and desert steppe dominated by Stipa glareosa and Ceratoides laten (Li et al., 2011). Grazing activities are the primary way local people use grassland resources and animal husbandry is the primary source of their income (Wu et al., 2012). Due to the relatively simple utilization modes for grassland, the NTP provides an ideal area for studying the relationship between forage production and livestock consumption of forage.

    Basic information for the study area. Panel (a) shows the grassland types on the NTP and sampling sites used in this study. Panel (b) shows the spatial distribution of precipitation amounts and Panel (c) shows the change trend of total precipitation during the growing season (GSP). Panel (d) shows the spatial distribution of average temperatures and Panel (e) shows the change trend of the average temperature during the growing season (GSMT).

    Figure 1.Basic information for the study area. Panel (a) shows the grassland types on the NTP and sampling sites used in this study. Panel (b) shows the spatial distribution of precipitation amounts and Panel (c) shows the change trend of total precipitation during the growing season (GSP). Panel (d) shows the spatial distribution of average temperatures and Panel (e) shows the change trend of the average temperature during the growing season (GSMT).

    2.2 Data

    In spring 2009, we set up a long-term transect platform from east to west covering the alpine meadow, steppe, and desert zones across the NTP. We conducted field surveys in late July or early August during each year from 2009 to 2016. These surveys took place when most plants were flowering or bearing fruit and had reached their maximum coverages. Thus, it makes sense to take aboveground biomass (AGB) as a proxy for aboveground net primary productivity (ANPP) (Wu et al., 2018). At each study site, a sample plot of 200 m×200 m in a relatively flat area was selected. At each plot, five subplots (0.5 m×0.5 m) were placed at an average interval of 20m along a randomly drawn sample line, and then biomass was harvested by species (Wu et al., 2012). Grazing and fenced sites were paired and community biomass was harvested from the pairs. All biomass samples were oven-dried at 65 ℃ for 48 h to constant mass.

    The study used meteorological data from 2000 to 2016 downloaded from the China Meteorological Data Service Center (http://data.cma.cn/). The daily meteorological data were recalculated into monthly averages and then interpolated into raster surfaces with a 1-km spatial resolution using ANUSPLIN 4.3 (Hutchinson and Xu, 2004). The quality of the grid climate surfaces matched up well with field observations (Tao et al., 2015). The plant growing season in the NTP is usually from May to September. We calculated the growing season average temperature (GSMT) and growing season total precipitation (GSP) and then extracted this climatic information to each sample site in ArcGIS 10.2.

    The Normalized Difference Vegetation Index (NDVI) is widely used to estimate the biomass and NPP of terrestrial ecosystems (Zhang et al., 2016; Meng et al., 2017). In this study, the NDVI products (MOD13A3) in MODIS data from 2000 to 2016 were obtained from the U.S. National Aeronautics and Space Administration agency (http://daac.gsfc.nasa.gov/), with a time accuracy of one month and a 1-km spatial resolution. The annual NDVImax was calculated using the maximum value composite (Holben, 1986). In order to eliminate the effects of areas with no or sparse vegetation, the areas with NDVImax 【-逻*辑*与-】lt; 0.1 were removed (Piao et al., 2006).

    Socio-economic data and county-level statistics for the types and numbers of livestock animals were taken from statistical yearbooks for the Tibet Autonomous Region. We obtained the number of livestock, the rate of slaughter and the available area of grasslands from 2000 to 2016 for the 17 counties in the NTP. Different types of livestock animals were converted into standard sheep units (SU) and, based on commonly used conventions, we counted one sheep or one goat as equal to one SU, and large livestock such as a cow or horse as equal to four SU.

    2.3 Method

    The statical assessment method for forage-livestock balance holds that when actual carrying capacity is equal to proper carrying capacity, the grassland is in a state of forage-livestock balance.

    ${{Z}_{a}}=\frac{F}{A\times I\times D}$
    $F=Y\times U\times H\times G\times B$

    where ${{Z}_{a}}$ is the proper carrying capacity of grassland (SU ha), $F$is the amount of standard hay available in a meadow (kg), $A$is the available grassland area (ha), $~I$ is the daily feed intake per SU (kg d-1), $~D$ is grazing days (d), $Y$is grassland yield (kg), $U$is the proportion of available grassland (%), $H$is the conversion coefficient of the standard hay, $G$ is the grassland utilization rate (%), and $B$ is the proportion of edible forage (%). Based on relevant statistics and references, 84% of U, 61% of G, and 75.66% of $B$ were taken, and 1.33 kg d-1 and 365 days were taken for $~I$ and $~D$, respectively (NY/T635-2015; Yang and Yang, 2000; Qian et al., 2007; Zhang et al., 2018).

    ${{Z}_{bt}}=\frac{{{N}_{a}}+{{N}_{b}}}{A}$

    where, ${{Z}_{bt}}$is the actual carrying capacity of grasslands estimated using the statical forage-livestock balance method (SU ha), ${{N}_{a}}$is the livestock inventory in a given year (SU), and Nb is the number of livestock slaughtered in a given year (SU).

    $Ip=\frac{{{Z}_{bt}}}{{{Z}_{a}}}$

    where Ip is the grazing pressure index. When Ip 【-逻*辑*与-】gt; 1, the grassland is overgrazed; when Ip 【-逻*辑*与-】lt; 1, the grassland has surpluses; when Ip = 1, the grassland is at a state of forage-livestock balance.

    For the dynamic forage-livestock balance method, we assumed that the AGB dynamics in fenced grasslands (AGBF) were driven only by climate variables, while the AGB dynamics in open grasslands grazed by livestock (AGBG) were driven by a combination of climate conditions and livestock grazing. Thus, it makes sense that the difference between AGBF and AGBG can be viewed as a human-induced change to AGB (AGBH) (Eq. 5).

    $AG{{B}_{H}}=AG{{B}_{F}}-AG{{B}_{G}}$

    We used the geographical coordinates of sampling points to obtain the corresponding GSP and GSMT and used these to establish the relationship with AGBF (Eq. 6, R2 = 0.62, P 【-逻*辑*与-】lt; 0.001). NDVImax was used to establish the relationship with AGBG (Eq. 7, R2 = 0.69, P 【-逻*辑*与-】lt; 0.001).

    $\begin{align} 【-逻*辑*与-】amp; AG{{B}_{F}}\text{=}\exp (0.0053\times GSP+0.0416\times GSMT- \\ 【-逻*辑*与-】amp; \text{ }0.0001\times GSP\times GSMT+2.0708) \end{align}$
    $AG{{B}_{G}}=35.893\times \ln (NDV{{I}_{\text{max}}})+87.861$

    The field data from 2011 to 2016 were used to build an empirical model, while the field observations from 2009 to 2010 were used to validate this model. The validation process showed that the results of the simulations for both models reached highly significant levels (Fig. 2, P 【-逻*辑*与-】lt; 0.001). Therefore, this empirical model can be used to identify and quantify the effects of climate change and human activity on forage production in alpine grasslands on the NTP.

    The correlations between the model simulation and field observations of aboveground biomass (AGB). (a) is for aboveground biomass of fenced grasslands (AGBF) and (b) is for aboveground biomass of open grasslands under grazing (AGBG)

    Figure 2.The correlations between the model simulation and field observations of aboveground biomass (AGB). (a) is for aboveground biomass of fenced grasslands (AGB<sub>F</sub>) and (b) is for aboveground biomass of open grasslands under grazing (AGB<sub>G</sub>)

    We assumed if there was no difference in the trends between AGBF and AGBH, then the AGBG were relatively stable, and the grasslands were at forage-livestock balance. By comparing the absolute slopes of AGBF and AGBH (sAGBF and sAGBH), we could infer the amount of AGBH and determine whether the number of livestock that could be added or should be subtracted to reach the forage-livestock balance.

    $AG{{B}_{T}}=\underset{i=1}{\overset{n}{\mathop \sum }}\,(sAG{{B}_{F}}-sAG{{B}_{H}})\times {{A}_{G}}$
    ${{C}_{T}}=\frac{AG{{B}_{T}}}{I\times D}$

    where AGBT is the total AGBH that can be increased or should be decreased (g), n is the number of grids, i is the ordinal of the grid, AG is the area per grid (m2), sAGBF and

    sAGBH are the absolute slope value for AGBF and AGBH (g m-2 yr-1), and CT is the amount of livestock that can be added or should be subtracted (SU).

    ${{Z}_{ad}}={{Z}_{b}}+\frac{{{C}_{T}}}{A}$

    where Zad is the carrying capacity of the grasslands (SU ha) estimated using the dynamic method. The dynamic method and the statical method use the same grazing pressure index. Since the dynamic method is calculated based on the rate of change, the results for the year 2000 are not available. To facilitate the comparison between the two methods, data for the year 2000 were not included in the carrying capacity estimate and grazing pressure index.

    Linear regression analysis is a reliable, straightforward method to analyze the trends of variables. It has been widely used in vegetation change analysis (Fensholt et al., 2009). In this study, the linear regression method was used to simulate the inter-annual variation of AGB.

    $Slop{{e}_{i}}=\frac{n\times \sum\limits_{i=1}^{n}{i\times {{x}_{i}}-\sum\limits_{i=1}^{n}{i}\sum\limits_{i=1}^{n}{{{x}_{i}}}}}{n\times \sum\limits_{i=1}^{n}{{{i}^{2}}}-{{\left( \sum\limits_{i=1}^{n}{i} \right)}^{2}}}$
    ${{\bar{s}}_{i}}=\frac{Slop{{e}_{i}}}{\frac{1}{n}\times \sum\limits_{i=1}^{n}{{{x}_{i}}}}$

    where n is the year of study, xi is the value of the variable x in the i year, Slope is the rate of change, and ${{\bar{s}}_{i}}$ is the average change trend of variable x over many years.

    3 Results

    3.1 Spatiotemporal distribution and variation of AGB

    From 2000 to 2016, there were evident fluctuations in both AGBF and AGBH (Fig. 3a and 3c). The highest values occurred in 2008, with 70.85 g m-2 for AGBF and 37.94 g m-2 for AGBH. The lowest values appeared in 2006, with only 34.39 g m-2 for AGBF and 2.71 g m-2 for AGBH. Both climatic conditions and human activities had relatively weak effects on the inter-annual fluctuations of AGBG; these moved within a narrow range with a low of 30.73 g m-2 in 2015 and a high of 34.39 g m-2 in 2011 (Fig. 3b). AGBF, AGBG and AGBH all showed slow and insignificant change trends. Among them, AGBF and AGBH both showed decreasing trends, with slopes of -0.24 g m-2 yr-1 and -0.25 g m-2 yr-1, respectively. AGBH increased slowly, at a rate of 0.01 g m-2 yr-1.

    Inter-annual variations of aboveground biomass (AGB) in alpine grassland on the northern Tibetan Plateau. (a) is for aboveground biomass of fenced grasslands (AGBF), (b) is for aboveground biomass at open grasslands under grazing (AGBG), and (c) is for human-induced aboveground biomass (AGBH).

    Figure 3.Inter-annual variations of aboveground biomass (AGB) in alpine grassland on the northern Tibetan Plateau. (a) is for aboveground biomass of fenced grasslands (AGB<sub>F</sub>), (b) is for aboveground biomass at open grasslands under grazing (AGB<sub>G</sub>), and (c) is for human-induced aboveground biomass (AGB<sub>H</sub>).

    With respect to spatial distribution (Fig. 4a, 4c, and 4e), AGBF , AGBG and AGBH all showed decreasing trends from southeast to northwest. Their values were generally low, with most areas less than 60 g m-2. According to the variation trend (Fig. 4b), AGBF showed a decreasing trend in southeastern NTP. The closer to the southeast, the more AGBF declined. However, in the central and western regions, AGBF showed an increasing trend, and the increasing trend was significant in the northwestern NTP. During 2000-2016, AGBG decreased in most parts of NTP, especially in the southern and southeastern NTP. AGBH showed an increasing trend in the northwestern and central NTP, but a decreasing trend in southeastern and southwestern of NTP.

    Spatial distribution and change trends for aboveground biomass from 2000 and 2016 on the northern Tibetan Plateau. (a), (c) and (e) show the spatial distribution of aboveground biomass for fenced grasslands (AGBF), for open grasslands under grazing (AGBG) and for human-induced aboveground biomass (AGBH), respectively. (b), (d) and (f) show the change trends for aboveground biomass for fenced grasslands (AGBF), for open grasslands under grazing (AGBG) and for human-induced aboveground biomass (AGBH), respectively.

    Figure 4.Spatial distribution and change trends for aboveground biomass from 2000 and 2016 on the northern Tibetan Plateau. (a), (c) and (e) show the spatial distribution of aboveground biomass for fenced grasslands (AGB<sub>F</sub>), for open grasslands under grazing (AGB<sub>G</sub>) and for human-induced aboveground biomass (AGB<sub>H</sub>), respectively. (b), (d) and (f) show the change trends for aboveground biomass for fenced grasslands (AGB<sub>F</sub>), for open grasslands under grazing (AGB<sub>G</sub>) and for human-induced aboveground biomass (AGB<sub>H</sub>), respectively.

    3.2 Spatiotemporal status of carrying capacity

    The actual carrying capacity can reveal the utilization of grassland forage. The actual carrying capacity on the NTP had a small inter-annual variation of 0.3-0.4 over time (Fig. 5). The year 2014 had the lowest actual carrying capacity of only 0.32 SU per ha of grassland, while 2006 had the highest actual carrying capacity of approximately 0.38 SU per ha of grassland. The proper carrying capacity calculated with the statical method fluctuated greatly from year to year, with the value ranging from 0.1 to 0.3. The values for proper carrying capacity were all were lower than those for actual carrying capacity. The year 2015 had the lowest proper carrying capacity obtained with the statical method, with a value of only 0.14 SU per ha of grassland; the year 2008 had the highest value of 0.30 SU ha of grassland. Use of the dynamic method to calculate inter-annual fluctuations of the proper carrying capacity also yield low values, which were close to the values of the actual carrying capacity. The proper carrying capacity exceeded the actual carrying capacity in eight of the study years 2000 to 2016. The year 2015 had the lowest proper carrying capacity obtained with the dynamic method appeared in 2015, with a value of only 0.30 SU per ha of grassland; 2008 had the highest value of 0.38 SU per ha of grassland.

    Inter-annual variations of carrying capacity of alpine grasslands on the northern Tibetan Plateau.

    Figure 5.Inter-annual variations of carrying capacity of alpine grasslands on the northern Tibetan Plateau.

    The actual carrying capacity of counties in the southeastern NTP were significantly higher than that of other counties in the western NTP (Fig. 6). Among those included in this study, the county with the highest actual carrying capacity was Damxung, and the county with the lowest actual carrying capacity was Sog. The grassland type of the southeastern NTP is alpine meadow with relatively good climatic conditions. Therefore, whether the statical method or the dynamic method was applied, the proper carrying capacity of the counties in the southeastern NTP was higher than that in other counties. However, the difference between the proper and actual carrying capacity obtained by the statical method was more significant than that obtained by the dynamic method. According to the statical method, the county with the highest proper carrying capacity was Baqên, while the county with the lowest proper carrying capacity was Sog. The counties with the highest and lowest proper carrying capacity identified by the dynamic method were consistent with the actual carrying capacity.

    The carrying capacity of alpine grasslands from 2000 and 2016 for each county of the northern Tibetan Plateau

    Figure 6.The carrying capacity of alpine grasslands from 2000 and 2016 for each county of the northern Tibetan Plateau

    3.3 Grazing pressure and forage-livestock balance on the NTP

    Values for the actual and proper carrying capacity can be used to obtain the grazing pressure index and this index can be used, in turn, to evaluate the forage-livestock balance. The results obtained by the statical method showed that the grazing pressure index was more significant than one during every year from 2000 to 2016, indicating the alpine grasslands of the NTP were overgrazed (Fig. 7a). In ten of the study period years, the grazing pressure index exceeded 1.5, indicating that the level of overgrazing was relatively serious, approximately 50% greater than reasonable stocking levels. The worst year for overgrazing was 2006, which had a grazing pressure index 2.57, while the lowest grazing pressure index of 1.23 occurred in 2008. Results of dynamic method showed that the grazing pressure index was greater than one in eight of the study years, indicating overgrazing of these NTP grasslands during those years (Fig. 7b). While 2015 was the year with the most serious overgrazing, the grazing pressure index was still only 1.10 in this year. In eight of the sixteen study years, the grazing pressure index was less than one, indicating a forage surplus in alpine grasslands of the NTP. The year with the greatest forage surplus was 2016, with a grazing pressure index of 0.92.

    The results obtained by the statical method showed all counties except Nyima (including Shuanghu) were overgrazed (Fig. 8a). Damxun county had the most severe overgrazing, with a grazing pressure index higher than four. The results of the dynamic method showed that four NTP counties, Rutog, Gê'gyai, Gêrzê and Nyima (including Shuanghu) had grazing pressure indexes less than one, indicating their grasslands had forage surpluses (Fig. 8b). Rutog county had the largest grassland surplus. The other 13 counties in the study area all had grazing pressure indexes greater than one, indicating that the alpine grasslands in these counties were overgrazed.

    Inter-annual variations of the grazing pressure index on the northern Tibetan Plateau. (a) shows the grazing pressure index obtained by the statical method and (b) shows the grazing pressure index obtained by the dynamic method.

    Figure 7.Inter-annual variations of the grazing pressure index on the northern Tibetan Plateau. (a) shows the grazing pressure index obtained by the statical method and (b) shows the grazing pressure index obtained by the dynamic method.

    4 Discussion

    4.1 Comparison between the statical and dynamic methods

    The results of the statical method indicate there was severe overgrazing in all of the study years, and the grazing pressure index was high in most of the counties studied. In order to reach the proper carrying capacity indicated by the statical method, the number of livestock animals would need to be significantly reduced. However, we found that the AGBG, which represents the residual AGB of grasslands in the NTP, showed an increasing trend (see Fig. 4d), meaning that the grasslands are developing in a good direction, and indicating that they still have the ability to self-regulate. When estimating the forage-livestock balance, the statical method generally assigns a fixed value to represent the daily forage intake of livestock (NY/T635-2015). This value represents the nutritional requirements of livestock. However, livestock adapt to climate change and changes in forage yields, and the weight of livestock is not necessarily consistent with the weight of standard sheep, meaning that the actual daily forage intake of livestock is not necessarily adequate to meet nutritional requirements (Currie, 1986; Chen et al., 2014). Because the results obtained by the statical method are based on a fixed value of daily forage intake, it may be problematic to use these results to estimate the overgrazing conditions of grasslands. Also worth noting, if the impact of reduced livestock numbers on the income of local herders, the amount of compensation that must be paid to herders to make reductions, and the willingness of herders to do so are taken into consideration, the feasibility of the statical method is relatively weak. However, the conservative grazing strategy indicated by this method still has certain reference functions for local ecological protection efforts (Qian et al., 2007; Liu et al., 2010; Chang et al., 2012). The dynamic method is based on the dynamic monitoring of AGB in the NTP. A relatively small number of livestock can be adjusted to achieve a forage-livestock balance in the grasslands and ensure the full and reasonable utilization of grassland resources, based on the actual conditions of local grasslands, and including consideration of the influences of climactic conditions and the adaptability of livestock (Cao et al., 2019). The dynamic method provides a new way of thinking and can serve as a reference for the reasonable arrangement of grazing activities and the development of harmonious local ecological protection efforts. However, the dynamic method also has limitations. It is more suitable for grasslands heavily influenced by climate change. If grazing pressure is too high and grassland degradation is severe, ecological protection efforts should be prioritized, and the relatively conservative statical method should be chosen to carry out assessments of the forage-livestock balance (Holechek, 1999).

    The grazing pressure index in each county of the northern Tibetan Plateau between 2000 and 2016. (a) shows the grazing pressure index obtained by the statical method and (b) shows the grazing pressure index obtained by the dynamic method.

    Figure 8.The grazing pressure index in each county of the northern Tibetan Plateau between 2000 and 2016. (a) shows the grazing pressure index obtained by the statical method and (b) shows the grazing pressure index obtained by the dynamic method.

    When carrying out the forage-livestock balance assessment, we should fully consider the local situation and choose the appropriate assessment method to facilitate the rational arrangement of grazing activities (Campbell et al., 2006; Lin et al., 2008). Due to the NTP’s unique geographical environment, its grasslands are very fragile, making it essential to prioritize environmental protection needs. However, as far as the present situation of the NTP is concerned, the dynamic method can be adopted to evaluate the forage-livestock balance. Grassland monitoring needs to become more conservative in areas where local conditions are steadily deteriorating.

    4.2 Regulation of future grazing activities

    In order to protect the grasslands of the NTP, a series of measures have been adopted, including fencing off of certain areas, implementation of the Grazing Withdrawal Program (GWP) and ecological compensation payments, all of which have played a decisive role in restoring degraded grasslands (Gao et al., 2016; Xu et al., 2016). However, the results of both statical and dynamic methods show that overgrazing conditions still exist in some areas. The dynamic method indicates that we can use the change trends of AGBG as a guide for planning future grazing activities to alleviate stocking pressure (Fig. 4d). If the change trend of AGBG is greater than zero, the grassland tends to be developing in the right way. Available grassland resources are sufficient on 50.05% of the total area of the NTP, distributed mainly in the central and northwestern parts of the plateau. When planning for future grazing activities, attention should be paid to areas that have potential whenever possible. If the change trend of AGBG is a negative number, the pressure on the grassland is relatively high, and the area is in an overgrazed state. Grazing in the future will be under pressure, and this is the case for 49.95% of the total area of the NTP, distributed mainly in the northern and southwestern of parts of the plateau. To the greatest extent possible, livestock activities in the future should be arranged to avoid aggravating the burdens on grasslands in such areas. Future grazing plans should endeavor to avoid these areas to avoid burdening the grassland.

    5 Conclusions

    This study combined large amounts of AGB data obtained from field survey measurements over a number of years with remote sensing data and climate data. This data was used to develop AGB models that identified and quantified the impact of human activities and climate change on the AGB of grasslands. On the basis of this AGB assessment, a statical method and a dynamic method were then used to calculate the carrying capacity and the carrying pressure index of grasslands in the study area to evaluate the forage-livestock balance. The results of the statical method indicated that the grasslands of the NTP were severely overgrazed, and in order to achieve a forage-livestock balance, the number of livestock animals would need to be significantly reduced. However, the dynamic method based on field monitoring of aboveground biomass indicated overgrazing only in some grasslands of the northern Tibetan Plateau during the study years. Only small adjustments in the number of livestock would be needed to maintain the stability of the grasslands. Statical methods are less feasible and relatively conservative, but their use is necessary in areas with severe grassland degradation. For grasslands with limited degradation that are greatly affected by climatic conditions, and still capable of self-recovery, the dynamic method is of particular value. The actual method used to assess the forage-livestock balance in a given area needs to be determined based on the actual conditions of the grasslands in the evaluation area.

    References

    [1] Cai HY, Yang XH, Xu XL. Human-induced grassland degradation/restoration in the central Tibetan Plateau: The effects of ecological protection and restoration projects. Ecological Engineering, 83, 112-119(2015).

    [2] Campbell BM, Gordon IJ, Luckert MK et al. In search of optimal stocking regimes in semi-arid grazing lands: One size does not fit all. Ecological Economics, 60, 75-85(2006).

    [3] Cao YN, Wu JS, Zhang XZ et al. Dynamic forage-livestock balance analysis in alpine grasslands on the Northern Tibetan Plateau. Journal of Environmental Management, 238, 352-359(2019).

    [4] Chang HQ, Xu WY, YuanJ et al. Current situation of grassland resources and grazing capacity in Ali, Tibet. Pratacultural Science, 29, 1660-1664(2012).

    [5] Chen BX, Zhang XZ, TaoJ et al. The impact of climate change and anthropogenic activities on alpine grassland over the Qinghai-Tibet Plateau. Agricultural and Forest Meteorology, 189, 11-18(2014).

    [6] Currie PO. Field evaluation of five grasses grown on a saline soil. Journal of Range Management, 39, 386-388(1986).

    [7] EbrahimiM, KhosraviH, RigiM. Short-term grazing exclusion from heavy livestock rangelands affects vegetation cover and soil properties in natural ecosystems of southeastern Iran. Ecological Engineering, 95, 10-18(2016).

    [8] Fan JW, Shao QQ, Liu JY et al. Assessment of effects of climate change and grazing activity on grassland yield in the Three Rivers Headwaters Region of Qinghai-Tibet Plateau, China. Environmental Monitoring and Assessment, 170, 571-584(2010).

    [9] Fan YJ, Hou XY, Shi HX et al. Effects of grazing and fencing on carbon and nitrogen reserves in plants and soils of alpine meadow in the three headwater resource regions. Russian Journal of Ecology, 44, 80-88(2013).

    [10] FensholtR, RasmussenK, Nielsen TT et al. Evaluation of earth observation based long term vegetation trends — Intercomparing NDVI time series trend analysis consistency of Sahel from AVHRR GIMMS, Terra MODIS and SPOT VGT data. Remote Sensing of Environment, 113, 1886-1898(2009).

    [11] Gang CC, ZhouW, Chen YZ et al. Quantitative assessment of the contributions of climate change and human activities on global grassland degradation. Environmental Earth Sciences, 72, 4273-4282(2014).

    [12] GaoL, Kinnucan HW, ZhangY et al. The effects of a subsidy for grassland protection on livestock numbers, grazing intensity, and herders’ income in Inner Mongolia. Land Use Policy, 54, 302-312(2016).

    [13] Harris RB. Rangeland degradation on the Qinghai-Tibetan plateau: A review of the evidence of its magnitude and causes. Journal of Arid Environments, 74, 1-12(2010).

    [14] Holben BN. Characteristics of maximum-value composite images from temporal avhrr data. International Journal of Remote Sensing, 7, 1417-1434(1986).

    [15] Holechek JL. An approach for setting the stocking rate. Rangelands, 10, 10-14(1988).

    [16] Holechek JL. Grazing studies: What we’ve learned. Rangelands, 21, 12-16(1999).

    [17] Hunt LP. Safe pasture utilisation rates as a grazing management tool in extensively grazed tropical savannas of northern Australia. Rangeland Journal, 30, 305-315(2008).

    [18] Hutchinson MF, XuT. Anusplin version 4.2 user guide. Centre for Resource and Environmental Studies. The Australian National University. Canberra.(2004).

    [19] Jia YL. On the concepts and practices concerning grassland- livestock balance. Acta Agrestia Sinica,, 13, 265-268(2005).

    [20] KrausmannF, Erb KH, GingrichS et al. Global human appropriation of net primary production doubled in the 20th century. Proceedings of the National Academy of Sciences of USA, 110, 10324-10329(2013).

    [21] LiL, ZhangY, LiuL et al. Current challenges in distinguishing climatic and anthropogenic contributions to alpine grassland variation on the Tibetan Plateau. Ecology Evolution, 8, 5949-5963(2018).

    [22] Li XJ, Zhang XZ, Wu JS et al. Root biomass distribution in alpine ecosystems of the Northern Tibetan Plateau. Environmental Earth Sciences, 64, 1911-1919(2011).

    [24] LiethH, Whittaker RH. Primary productivity of the biosphere. Kew Bulletin, 32, 237-263(1975).

    [25] LinB, Tan ZL, Tang SX et al. Research progress in methodologies for carrying capacity and proper stocking rate in grassland ecological system. Pratacultural Science, 25, 91-99(2008).

    [26] Liu XY, Feng QS, Liang TG et al. Spatial-temporal dynamic balance between livestock carrying capacity and productivity of rangeland in Gannan of Gansu Province, China. Chinese Journal of Grassland, 32, 99-106(2010).

    [27] Luo LH, MaW, Zhuang YL et al. The impacts of climate change and human activities on alpine vegetation and permafrost in the Qinghai-Tibet Engineering Corridor. Ecological Indicators, 93, 24-35(2018).

    [28] Melillo JM, Mcguire AD, Kicklighter DW et al. Global climate-change and terrestrial net primary production. Nature, 363, 234-240(1993).

    [29] Meng BP, GeJ, Liang TG et al. Evaluation of remote sensing inversion error for the above-ground biomass of alpine meadow grassland based on multi-source satellite data. Remote Sensing, 9, 372(2017). http://www.mdpi.com/2072-4292/9/4/372

    [30] . NY/T635-2015. Agriculture Industry Standard of the People’s Republic of China: Calculation of Proper Carrying Capacity of Range Land..

    [31] Petrie MD, Peters D PC, YaoJ et al. Regional grassland productivity responses to precipitation during multiyear above- and below-average rainfall periods. Global Change Biology, 24, 1935-1951(2018).

    [32] PetzK, AlkemadeR, BakkenesM et al. Mapping and modelling trade-offs and synergies between grazing intensity and ecosystem services in rangelands using global-scale datasets and models. Global Environmental Change-Human and Policy Dimensions, 29, 223-234(2014).

    [33] Piao SL, Fang JY, He JS. Variations in vegetation net primary production in the Qinghai-Xizang Plateau, China, from 1982 to 1999. Climatic Change, 74, 253-267(2006).

    [34] Piao SL, SitchS, CiaisP et al. Evaluation of terrestrial carbon cycle models for their response to climate variability and to CO2 trends. Global Change Biology, 19, 2117-2132(2013).

    [35] Potter CS, Randerson JT, Field CB et al. Terrestrial ecosystem production — A process model-based on global satellite and surface data. Global Biogeochemical Cycles, 7, 811-841(1993).

    [36] QianS, Mao LX, Hou YY et al. Livestock carrying capacity and balance between carrying capacity of grassland with added forage and actual livestock in the Qinghai-Tibet Plateau. Journal of Natural Resources, 22, 389-397(2007).

    [37] Ren HY, Han GD, SchonbachP et al. Forage nutritional characteristics and yield dynamics in a grazed semiarid steppe ecosystem of Inner Mongolia, China. Ecological Indicators, 60, 460-469(2016).

    [38] Scarnecchia DL. The relationship of stocking intensity and stocking pressure to other stocking variables. Journal of Range Management, 38, 558-559(1985).

    [39] SchirpkeU, KohlerM, LeitingerG et al. Future impacts of changing land-use and climate on ecosystem services of mountain grassland and their resilience. Ecosystem Services, 26, 79-94(2017).

    [40] TaoJ, Zhang YJ, Dong JW et al. Elevation-dependent relationships between climate change and grassland vegetation variation across the Qinghai-Xizang Plateau. International Journal of Climatology, 35, 1638-1647(2015).

    [41] WuJ, FengY, ZhangX et al. Grazing exclusion by fencing non-linearly restored the degraded alpine grasslands on the Tibetan Plateau. Scientific Reports, 7, 1-9(2017).

    [42] WuJ, LiM, FiedlerS et al. Impacts of grazing exclusion on productivity partitioning along regional plant diversity and climatic gradients in Tibetan alpine grasslands. Journal of Environmental Management, 231, 635-645(2018).

    [44] Wu JS, Zhang XZ, Shen ZX et al. Species richness and diversity of alpine grasslands on the Northern Tibetan Plateau: Effects of grazing exclusion and growing season precipitation. Journal of Resources and Ecology, 3, 236-242(2012).

    [45] Xu HJ, Wang XP, Zhang XX. Alpine grasslands response to climatic factors and anthropogenic activities on the Tibetan Plateau from 2000 to 2012. Ecological Engineering, 92, 251-259(2016).

    [46] Xu MY, Gao LJ, Li YQ. A review on grassland carrying capacity (Ⅱ): Parameters and calculation method. Acta Prataculturae Sinica,, 23, 311-321(2014).

    [47] Yang ZL, Yang GH. Potential productivity and livestock carrying capacity of high-frigid grassland in China. Resources Science, 22, 72-77(2000).

    [48] Yu CQ, Zhang XZ, ZhangJ et al. Grazing exclusion to recover degraded alpine pastures needs scientific assessments across the Northern Tibetan Plateau. Sustainability, 8, 1162(2016).

    [49] Zhang BH, ZhangL, XieD et al. Application of synthetic NDVI time series blended from landsat and MODIS data for grassland biomass estimation. Remote Sensing, 8, 10(2016). http://www.mdpi.com/2072-4292/8/1/10

    [50] Zhang HY, Fan JW, WangJ et al. Spatial and temporal variability of grassland yield and its response to climate change and anthropogenic activities on the Tibetan Plateau from 1988 to 2013. Ecological Indicators, 95, 141-151(2018).

    [51] Zhang JP, Zhang LB, Liu WL et al. Livestock-carrying capacity and overgrazing status of alpine grassland in the Three-River Headwaters region, China. Journal of Geographical Sciences, 24, 303-312(2014).

    [52] ZhongL, Ma YM, Salama MS et al. Assessment of vegetation dynamics and their response to variations in precipitation and temperature in the Tibetan Plateau. Climatic Change, 103, 519-535(2010).

    Yanan CAO, Jianshuang WU, Xianzhou ZHANG, Ben NIU, Yongtao HE. Comparison of Methods for Evaluating the Forage-livestock Balance of Alpine Grasslands on the Northern Tibetan Plateau[J]. Journal of Resources and Ecology, 2020, 11(3): 272
    Download Citation