
Yizhou Liu, Wenchao Qiao, Kong Gao, Rong Xu, Tianli Feng, Meng Zhang, Xun Li, Yangyang Liang, Tao Li. Development of High-Power Ultrafast Fiber Laser Technology[J]. Chinese Journal of Lasers, 2021, 48(12): 1201003
- Chinese Journal of Lasers
- Vol. 48, Issue 12, 1201003 (2021)
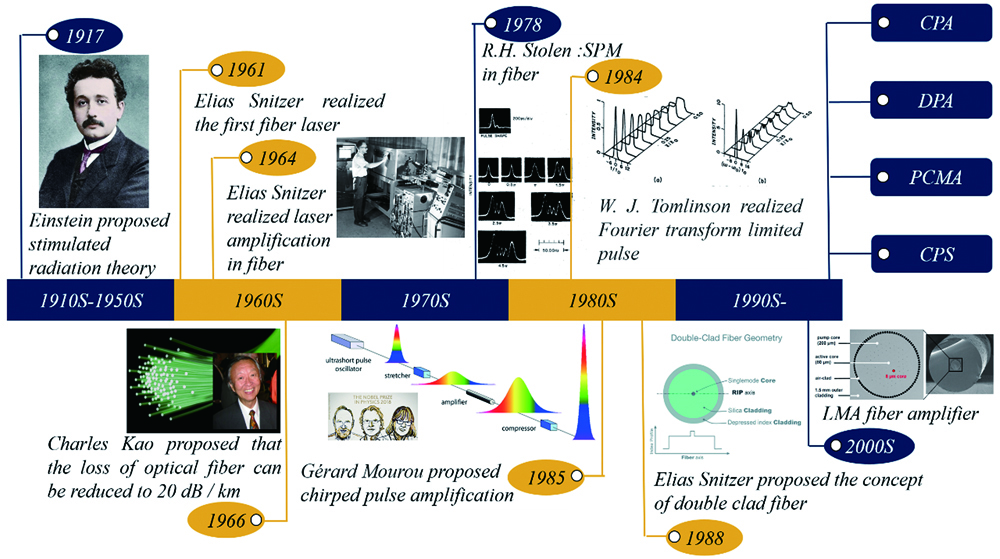
Fig. 1. Development history of high power ultrafast fiber laser
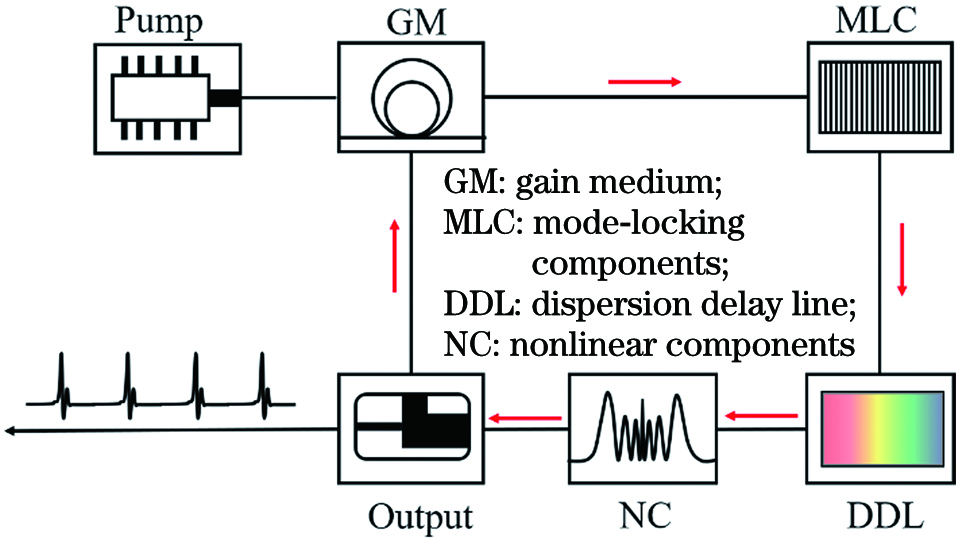
Fig. 2. Structure diagram of passive mode-locked fiber laser
Fig. 4. Diagram of high power ultrafast laser system
Fig. 5. Measured autocorrelation trace of the compressed pulses with and without fine adjusting of dispersion of CFBG at 10 μJ pulse energy[68]
Fig. 6. Experimental results. (a) Pulse spectrum at the output of the amplifier; (b) autocorrelation trace of the amplifier pulses (inset: output beam profile) [71]
Fig. 7. Experimental simulation results. (a) Gaussian spectrum; (b) parabolic spectrum; phase-profiles of (c) Gaussian spectrum and (d) parabolic spectrum at power levels corresponding to B-integrals of 3.5 rad and 16 rad, respectively; corresponding autocorrelation traces of (e) Gaussian spectrum and (f) parabolic spectrum at power levels corresponding to B-integrals of 3.5 rad and 16 rad, respectively[74]
Fig. 8. High-power ultra-fast laser output. (a) Full power spectrum of single channel before compression and combined beam before and after compression; (b) measured and calculated transform-limited (TFL) non-collinear intensity autocorrelation (inset: output stretched pulse shape of the main amplifier) [77]
Fig. 9. Schematic diagram of amplification technology. (a) Chirped pulse amplification; (b) divided pulse amplification; (c) pre-chirp managed amplification
Fig. 10. Schematic construction of the 10.4 kW fiber laser system [77]
Fig. 11. In recent years, high-power ultra-fast laser output parameters based on CPA, DPA, PCMA, and CPS technologies have been achieved. (a) Year-energy distribution diagram of 1 μm high-power ultrafast laser; (b) year-average power distribution diagram of 1 μm high-power ultrafast laser[80, 82-88, 90-112]
Fig. 12. Structure diagram of CPA system with average output power of 830 W[80]
Fig. 13. Experimental setup of DPA system [78]
Fig. 14. Schematic construction of the high power Yb-fiber PCMA system [117]
Fig. 15. Experimental setup of CPS system with output pulse energy of 10 mJ [112]
Fig. 16. Common nonlinear compression devices. (a) Multipass cell with quartz sheet; (b) multipass cell filled with noble gas


Set citation alerts for the article
Please enter your email address

© Copyright 2018-2021 | Chinese Laser Press. All Rights Reserved 沪ICP备15018463号-20