Ultra-broadband, intense, coherent terahertz (THz) radiation can be generated, detected, and manipulated using laser-induced gas or liquid plasma as both the THz wave transmitter and detector, with a frequency coverage spanning across and beyond the whole “THz gap.” Such a research topic is termed “plasma-based THz wave photonics in gas and liquid phases.” In this paper, we review the most important experimental and theoretical works of the topic in the non-relativistic region with pump laser intensity below .
The terahertz (THz) electromagnetic radiation between microwave and optical frequencies, typically ranging from 0.1 to 10 THz, has become a long-lasting front edge for research fields in physics, chemistry, material science, biology, medicine, and so on. Substantial advances over the past decades in THz wave photonics have created a variety of potential research opportunities. Significant applications, such as label-free DNA genetic analysis, linear and nonlinear imaging and spectroscopy, biochemical sensing, hazardous substance detection (especially explosives detection), and noninvasive testing, have advanced research in THz wave photonics from relative obscurity to unprecedented heights[1–4]. On the other hand, some applications, such as nonlinear THz imaging and spectroscopy[5], high-harmonic generation at THz frequencies[6], charged particle acceleration, and THz communications[7], establish newer requirements on either THz wave sources or sensors, in terms of THz peak electric field or pulse energy, bandwidth, controllable polarization, and dynamic range or signal-to-noise ratio (SNR). Therefore, various portable THz sources and sensors with high intensity or electric fields, ultra-broad frequency coverage, as well as high SNR are highly desired.
THz wave generation, sensing, and manipulation using laser-induced plasma has been a long-lasting and interesting topic since 1993[8]. The topic started with the first observation of THz electromagnetic pulse generation from gas plasma using single-color picosecond laser pulse excitation by W. White’s group[8]. Then, the THz peak electric field generated from air plasma was substantially increased by orders of magnitude using two-color laser excitation[9], reaching 400 kV/cm, the highest record in the THz electric field at that time[10]. Such a THz electromagnetic wave generation process was initially interpreted as four-wave mixing (FWM), phenomenologically. The significant improvement in the generated THz electric field and bandwidth from laser-induced gas plasma stimulated the research topic, making it one of the popular fields in ultrafast science, THz science and technologies, nonlinear optics, as well as plasma physics[11–35]. Very importantly, coherent control of THz radiation generated from laser-induced gas plasma was demonstrated and can be well explained using both FWM and transient current models[11–13,36–38]. Since dry air or selected gases do not have any phonon absorption bands in the THz frequency range, coherent detection of pulsed THz radiation using gases as the detection media results in a super smooth, defect-free spectrum with ultra-broad bandwidth, only limited by the detecting laser pulse width[39–42].
More recently, liquids, for example, liquid water[43–46], liquid nitrogen[47,48], liquid metal[49], ethanol, and acetone[50,51], have been proven to be prospective broadband THz sources due to their lower ionization threshold and higher molecular density, in comparison with those in gas phase. Benefiting from the fluidity of liquids, liquid flows of different geometries have been utilized as laser targets to provide a fresh zone between adjacent pump laser pulses, mitigating the laser damage issue that has been suffered in the case of solid targets for many years. In analogy to the laser-induced plasma in gases, coherent detection of broadband THz waves using liquid plasma as the THz wave sensor can also be achieved[52], providing an important addition to the broadband THz wave detection.
Sign up for Photonics Insights TOC. Get the latest issue of Photonics Insights delivered right to you!Sign up now
In this paper, we review the most important experimental and theoretical works on plasma-based THz wave photonics in the non-relativistic region with pump laser intensity below , while the emphasis is focused on gas and liquid phases. The entire paper is mainly classified into two parts. In the first part, THz wave generation, detection, and manipulation in gaseous media will be reviewed, with addition of some unpublished results achieved by the authors. Significant approaches that set milestones in the research field will be reviewed, and theoretical models used to explain those phenomena will be introduced, including some discussion on their pros and cons as they are used to explain or reproduce those experimental observations. In the second part, we will introduce the most recent works on THz wave photonics in liquids. In the summary, we will roughly compare gaseous media and liquids as THz radiation sources and sensors, in terms of the generated peak THz electric field, detectable bandwidth, as well as SNR or dynamic range.
2 Plasma-Based THz Wave Photonics in Gas Phase
This section describes THz wave generation, manipulation, and detection in laser-ionized gas plasma. First, we review the basic geometries used to generate broadband coherent THz radiation from gas plasma. Second, we introduce different theoretical models used to describe the THz wave generation processes in the past and the correlation between them. Third, we introduce coherent detection of broadband THz waves using laser-induced gas plasma as the sensor, including THz air-breakdown (or air-biased) coherent detection (THz-ABCD)[39,40], THz wave detection utilizing THz-radiation-enhanced emission of fluorescence from gas plasma (THz-REEF)[53,54], for THz wave remote sensing, and coherent THz wave detection using THz-enhanced acoustics (TEA)[55]. Then we introduce coherent control of THz wave radiation from laser-induced gas plasma, including coherent control of the THz electric field and its polarization, as well as the relative phase-dependent THz wave emission spectrum. Finally, we introduce some experimental results on high-field THz wave generation from gas plasma excited by two-color laser fields, backward THz radiation from gas plasma, and THz wave emission at stand-off distances.
2.1 Methods Used to Generate THz Waves from Gas Plasma
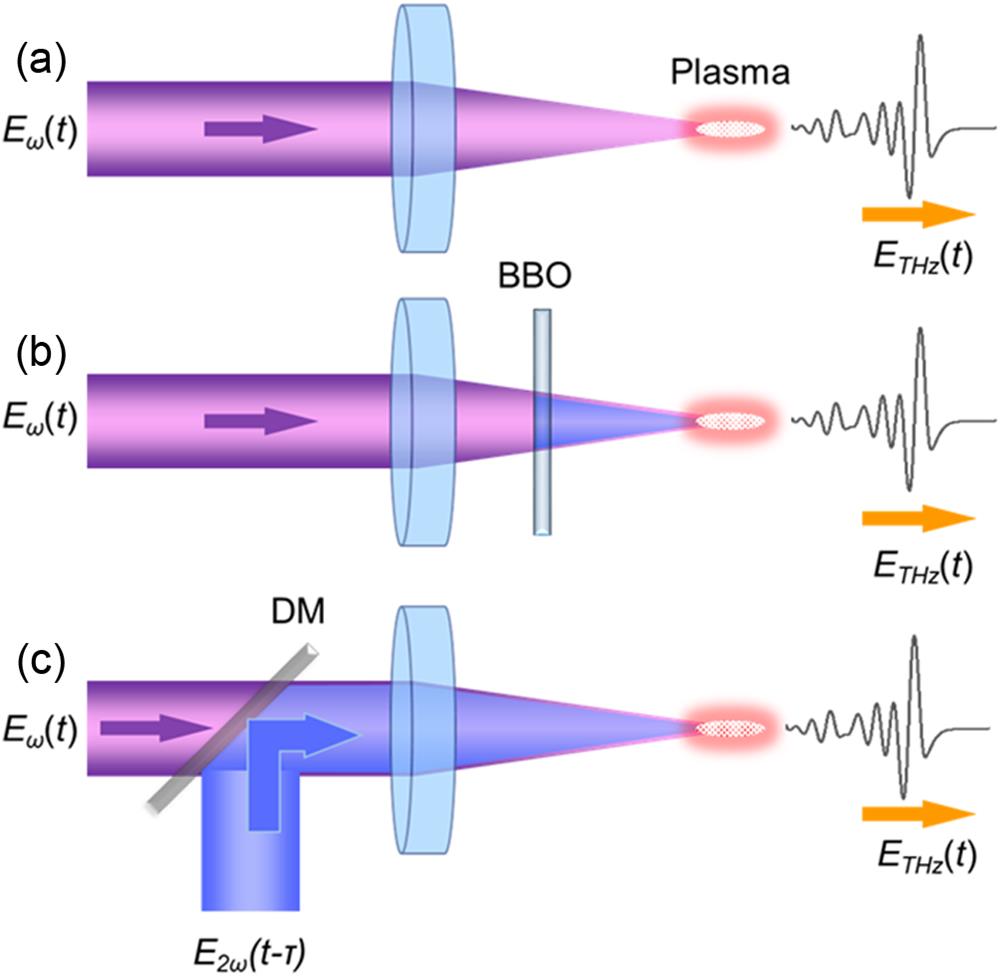
There are mainly three methods used for the THz emission from laser-ionized gas plasma, as illustrated in Fig. 1: (1) single-wavelength laser excitation is utilized to generate plasma in gaseous media for THz wave emission via the ponderomotive force[8,56,57]; (2) a fundamental laser beam at is focused through a -barium borate ( or BBO) crystal to produce a second-harmonic (SH) beam at , which is then mixed with the residual unconverted beam in the plasma to create very stronger THz waves[9,10,58–68], in comparison with that in the first case; and (3) an interferometric phase compensator (PC) based on a two-color Mach–Zehnder interferometer (not displayed in the figure) is used to combine the and beams with a dichroic mirror. Such a PC can control the polarization and phase of each optical beam individually for coherent control of the THz emission[11]. THz wave emission from biased gas plasma or plasma filaments in ambient air can be classified to the case of single-wavelength laser excitation[20,22,25,46,66,69–79]. The use of single-color few-cycle laser pulses to ionize gases for intense THz wave emission can be classified into both cases[80], since, very similar to the asymmetric optical fields synthesized from two-color optical fields, a few-cycle laser field itself can produce asymmetric fields by properly controlling the carrier–envelope phase without the involvement of the SH laser field.
Figure 1.Schematic diagrams of methods used for THz wave emission from ambient air or selected gases. (a) Single-wavelength laser excitation ( or ): the THz wave emission process is attributed to ponderomotive force-induced dipole oscillation. (b) Most commonly used and convenient method with two-color excitation ( and ): a fundamental pulse () is focused through a crystal (typically 0.10 mm thick) to generate a second-harmonic pulse () that is then mixed with the residual pulse in the plasma. (c) A dichroic mirror (DM) is used to combine the second-harmonic beam with the beam in a two-color laser excitation scheme, and in this case, the relative phase, polarization, and amplitude of either laser beam ( or ) can be controlled independently for coherent control of THz wave emission, including THz wave polarization control.
In the first case, the laser beam can also be focused through the self-focusing effect in gas media without a physical lens when the peak power of the laser pulse is higher than the critical power, forming a very long plasma filament. Figure 2 shows a comparison between the THz waveforms generated from single-color and two-color laser-induced plasmas formed with tight focusing lenses [typically with an effective focal length (EFL) of ]. One can see that the THz electric field generation from two-color laser-induced air plasma is over two orders of magnitude higher than that from single-color laser-induced air plasma, implying that the two-color laser-ionized gas plasma can generate a THz pulse energy over five orders of magnitude higher than that of the single-color case.
Figure 2.Comparison between THz waveforms generated from single-color (800 nm only) and two-color (800 and 400 nm) laser-induced air plasmas. The total pump laser pulse energy for both cases is , and the pulse duration is about 80 fs. The environmental humidity is about 30%. The laser beam is focused by an optical lens with an effective focal length of 150 mm. The THz waveforms are obtained using electro-optic (EO) sampling with a 1.0-mm-thick ZnTe crystal.
As discussed above, a very special case for THz generation from single-color laser-induced gas plasma is the utilization of carrier–envelope phase stabilized few-cycle laser pulses to ionize gas atoms or molecules. In this case, asymmetric laser fields can be produced by properly controlling the carrier–envelope phase, which is very similar to the asymmetric fields synthesized by two-color laser pulses. As proposed by Zhengming Sheng’s group, gigawatt THz radiation can be achieved when terawatt (TW) single-cycle pulses are used to ionize gases[80]. Since the THz emission is highly sensitive to the carrier–envelope phase[14,81], the THz radiation generated by few-cycle laser pulses, in turn, can be used to determine and control the carrier–envelope phase of few-cycle laser pulses, which has been experimentally demonstrated by Hartmut G. Roskos’s group[14].
2.2 Theoretical Models Used to Describe THz Wave Generation Processes in Gas Plasma
In the case of single-color laser-ionized gas plasma, the THz wave generation process is attributed to the ponderomotively induced space charge fields, i.e., the ponderomotive force model[8,82–84]. Because the ponderomotive force is oriented along the laser pulse propagation direction, the equivalent dipole induced by the ponderomotive force oscillates along the laser direction, and hence the emitted THz wave is independent of pump laser polarization with an emission pattern symmetrical with respect to the laser axis. Previous experimental results show that the THz emission from single-color laser-ionized gas plasma or a plasma filament follows a conical pattern[76]. Moreover, when the plasma size becomes smaller, the THz radiation from the plasma is closer to lateral emission. For example, when the laser beam is focused into air by a microscope objective, forming a micro-plasma, the THz emission is mainly directed perpendicularly to the laser axis[85]. Figure 3 shows the THz emission pattern in laser-induced micro-plasma excited by single-color laser pulses at 800 nm. When the pump laser pulse was focused by a 0.85-NA air-immersed microscope objective into air, creating a plasma of submillimeter size (less than 40 µm), maximal THz radiation occurs in the direction at about 80° with respect to the laser propagation direction.
Figure 3.(a) Angular dependence of THz wave emission from a micro-plasma generated with laser pulse energy of 65 µJ. is the time delay between the pump and probe beams for THz waveform measurement. (b) Measured detection angle dependence of THz pulse energy. The pulse energy is calculated using the THz waveforms presented in (a). The solid line represents the experimental results, while the dashed line shows the simulation result achieved using the theoretical model described in Ref. [23]. Figures reprinted from Ref. [85], Optica.
In the case of two-color laser-induced gas plasma, there are essentially three theoretical models used to interpret the nonlinear processes responsible for the THz generation from gas plasma. The first one is the FWM model[9,11], a third-order nonlinear optical process, the second one is the asymmetric transient current (ATC) model[12,13], and the third one is the full-quantum mechanical (FQM) model[86]. Among them, both the FWM and ATC models can partially interpret and reproduce the experimental observations and even accurately predict some experimental results. For example, the coherent detection of pulsed THz waves with a laser-ionized gas plasma was first predicted by the FWM model[39], and either the FWM or ATC model can also be used to predict the coherent control of THz wave emission from gas plasma[9,11,13]. The major arguments lie in three aspects: (1) in the FWM model, the origin of the third-order nonlinearity is unclear since becomes smaller after gases are ionized; (2) the FWM model cannot be used to explain the threshold behavior, i.e., THz radiation can be generated from gases only when the total pump laser pulse energy reaches a certain value for gases to be ionized; and (3) in the FWM and ATC models, phase dependences of the THz generation efficiency are very different. In the FWM model, the maximum THz emission is achieved when the relative phase between the fundamental and its SH pulses is zero[9,11], while in the ATC model the optimal relative phase to maximize THz emission is [13,87]. More recently, a linear-dipole array model, proposed by Zhengming Sheng’s and Yanping Chen’s group, can be used to interpret the control of the carrier–envelope phase, angular distribution, amplitude, and polarization of the emitted THz wave from gas plasma[88,89]. The linear-dipole array model can also be used to reproduce the experimental results on backward THz radiation from two-color laser-ionized gas plasma, which will be briefly introduced later.
The FQM model is based on the time-dependent Schrödinger equation (TDSE)[90], which can accurately describe the formation of the relevant electron wave packets during the ionization process. It has shown that the full THz wave generation process occurs in two steps: first, a broadband pulsed THz wave is emitted through asymmetric tunnel ionization via the laser–gas atom or molecule interaction, and in the second step, an “echo” is produced by the interaction of the ionized electron wave packets with the surrounding gas and plasma[86]. So we can also call the model “the two-step quantum mechanical model.” Figure 4 illustrates the physical picture of the THz wave generation process in ionizing gas plasma and the electron density distributions for argon gas atoms subjected to an intense laser field synthesized from fundamental () and SH () pulses with phase differences (relative phases) of and . Simulation results on the phase-dependent THz wave generation efficiency with the FQM model indicate that the optimal relative phase between and pulses, when the maximum THz wave generation efficiency is achieved, is highly dependent on the excitation laser intensity. At a moderate laser intensity (), the optimal phase falls between zero and [86]. However, in the experiment, it is challenging to determine the “absolute” phase between the two pulses unless carrier–envelope phase stabilized few-cycle pulses are used. Results also show that at very low excitation laser intensity, the maximum THz wave generation efficiency is obtained when the relative phase approaches zero (which also can be concluded with the FWM model), and that at extremely high intensity, the optimal relative phase is (which can also be concluded with the semi-classic ATC model). From the view of the phase-dependent THz wave generation efficiency, it can be concluded that the full quantum mechanical model actually bridges the FWM and ATC models.
Figure 4.(a) Schematic illustration of the THz wave generation process in the ionizing gas atom. Laser fields synthesized from fundamental and second-harmonic frequency components ( and ) interact with the atom, resulting in tunnel ionization. A portion of the electron wave packets formed in the ionization process are accelerated away from the atom and propagate outward (along the laser polarization axis), producing a net THz dipole moment, which consequently emits electromagnetic waves (). Then, the wave packets interact with their surroundings, emitting bremsstrahlung, which adds coherently, incurring an “echo” THz pulse. (b), (c) Calculated electron density distributions for an argon atom subjected to intense optical fields synthesized from the fundamental and its second-harmonic pulses with relative phases of and , leading to minimal and maximal asymmetry, respectively. Figures reprinted with permission from Ref. [86], American Physical Society.
In fact, the FWM model is a phenomenological description of the THz wave generation process from two-color laser-induced gas plasma and is valid within the perturbation regime at a low pump intensity limit. The ATC model is valid at a high pump intensity limit when the gas molecules or atoms are fully ionized, whereas, the FQM model can fully describe the nonlinear optical processes for THz wave generation from two-color laser-induced gas plasma and covers all the cases including both those at low- and high-pump-intensity limits. To date, the FQM model can explain all experimental observations. We will introduce some experimental results that can be reproduced only by the FQM model rather than FWM and ATC models at the end of Section 2.4.
2.3 Coherent Detection of Broadband THz Waves Using Laser-Induced Gas Plasma as the Sensor
For simplicity and easy understanding, the FWM model is used to interpret THz wave ABCD. In the FWM model, detection of coherent THz radiation using gases as the THz wave sensor could be simply treated as the reciprocal process of THz wave generation with two-color excitation, i.e., two photons at are mixed with a THz photon at , producing one SH photon at , which is termed as THz field-induced SH (TFISH) generation[39,91]. This coherent THz wave detection technique is also called THz ABCD (or later on, renamed as THz air-biased coherent detection when biased plasma is used for coherent THz wave detection), as shown in Fig. 5. The fundamental beam () is focused by the first optical lens through the hole on the parabolic mirror (PM) to form a plasma at the focus of the PM. The THz beam is focused by the PM to form a THz beam waist at the plasma position. The second lens in the figure is used to collimate the SH beam, and the bandpass filter is used to pass through the SH beam () while blocking the residual pump beam and any other light waves generated from the plasma. The photomultiplier tube (PMT) is used to collect the SH light signal.
Figure 5.Schematic illustration of the experimental setup for THz-ABCD. The parabolic mirror is used to focus the collimated THz beam; the signal is created by mixing the probe beam and the THz electric field in air or selected gases. PMT (photomultiplier tube) is used to detect the optical signal at .
Mathematically, in the FWM approximation, when both the fundamental () and SH () laser pulses collinearly propagate and share the same polarization, the THz wave generation process can be simply depicted by the following equation: where , , and represent the THz, SH, and fundamental electric fields, respectively, is the third-order nonlinear susceptibility, and is the relative phase between the fundamental and SH pulses. The detection of THz waves can be treated as the reciprocal process of Eq. (1). By exchanging the THz electric field term with the SH term in Eq. (1), the equation can then be rewritten as follows:
Equation (2) represents the TFISH generation process, and it can be simplified as when the relative phase is fixed, which means that the measurable SH intensity (signal that can be detected by an optical detector) is proportional to the intensity of the THz wave, i.e., . In this case, the phase information of the THz wave is lost, and therefore, the detection is incoherent. When an SH local oscillator (LO) is introduced, the total SH intensity in the time average values over one period of electric field oscillation takes the form ︀where ︀ is the phase difference between the TFISH field and the SH LO field . The SH LO can be contributed either from the white light generated from the laser-induced air plasma through self-phase modulation and self-steepening (i.e., the component of white light)[39], or from a DC field induced SH[40]. To directly link the SH intensity (detectable signal by an optical detector) to the THz electric field to be detected, Eq. (3) is rewritten as ︀
Experimentally, the first and second terms can be minimized or eliminated through lock-in detection by properly choosing the probe beam intensity or by modulating the DC bias field with a proper modulation frequency referenced by the lock-in amplifier, leaving only the third interference term in the equation, i.e., ︀. Thereby, coherent detection of broadband THz waves can be achieved. Detection of THz waves using THz-ABCD is a third-order nonlinear optical process, and therefore, the detected THz bandwidth is broader than that achieved using the THz wave detection method via a second-order nonlinear optical process, such as electro-optic sampling (EOS), even though both detection methods use probe laser pulses with the same pulse characteristics such as pulse duration and bandwidth.
In addition, optically biased coherent detection of broadband THz waves (THz-OBCD) based on the same concept as THz-ABCD was demonstrated by Chia-Yeh Li and his collaborators[92], which is also an all-optical method with full access to phase and polarization of the bias field, offering direct routes for optimization and polarization-sensitive detection. The demonstration provides an alternative approach for the coherent THz wave detection with laser-induced gas plasma. However, the dynamic range of the THz signal sensed by THz-OBCD is relatively lower, in comparison with that by THz-ABCD.
Since dry air or selected gases have no phonon resonances or echoes due to THz or optical reflections, broadband THz spectroscopy using gases as both the THz wave emitter and sensor is free of instrumental defects. Ionizing gases exhibit much lower dispersion than solids or liquids and are continuously renewable. Other THz time-domain spectroscopic systems based on EO crystals such as ZnTe and GaSe and photoconductive antennas have been able to reach frequencies in the range, but have large gaps in their spectra due to phonon absorption and dispersion[93–95]. Using THz-ABCD in combination with the two-color laser-induced gas plasma-based THz emitter, the frequency coverage of the entire THz system is limited only by the laser pulse duration. Figure 6 shows a THz waveform and its corresponding Fourier transform spectrum achieved using gas plasma as the THz emitter and THz-ABCD (here, THz air-biased coherent detection is used[40]) as the detector with 85-fs laser pulses. One can see that the frequency coverage is over 10 THz, and the entire spectrum is much smoother than that obtained by other THz time-domain spectroscopic systems. When shorter laser pulses are used, the detected THz frequency coverage can reach 200 THz[41].
Figure 6.(a) THz waveform and (b) its Fourier transform spectrum achieved when gas plasma is used as both the THz emitter and sensor with laser pulses of 85 fs for THz wave generation and detection.
Polarization-resolved THz-ABCD can be achieved by employing an orientation-modulated AC bias field, demonstrated by Jianmin Yuan’s group[96]. Figure 7 illustrates the experimental scheme used to measure both the amplitude and polarization of the THz electric field. In Fig. 7, the quarter-wave plate (QWP) is used to convert the linear polarization of the probe beam to circular polarization. The probe beam is focused through the hole on the PM, generating a plasma. The elliptically polarized THz wave is focused and combined collinearly with the probe beam at the common focal point (plasma position) by the PM. Since the electrode pairs are supplied with sinewave voltage and cosine-wave voltage separately, the total external bias electric field can rotate in the normal plane of the probe beam while the absolute value of the electric field is kept fixed. The SH signal generated from the plasma passes through the bandpass filter and is detected by the PMT.
Figure 7.Schematic diagram of polarization-sensitive THz-ABCD. QWP, quarter wave plate; PMT, photomultiplier tube. Figure reprinted with permission from Ref. [96], AIP Publishing.
Figure 8 shows the measured results of the elliptically polarized THz pulse in a three-dimensional (3D) plot in time domain with orthogonal components and the polarization information plotted for clarity in the figure. This approach can provide full characterization of arbitrarily polarized THz waves with one single-scan measurement, pave a potential way for polarization-sensitive THz time-domain spectroscopy (TDS) of a wide range of materials, and expand applications of THz science and technologies.
Figure 8.The measured result of an elliptically polarized THz waveform. The orthogonal THz components and the polarization information are also shown as cast shadows in the figure. Figure reprinted with permission from Ref. [96], AIP Publishing.
However, a later investigation of the polarization dependence of THz-ABCD on the polarization directions of fundamental waves, done by Jing Zhang in Xi-Cheng Zhang’s group[97], shows that the intensity, ellipticity, and polarization angle of the TFISH are seriously affected by air plasma birefringence, which can be simulated by cross-phase modulation theory. Due to the plasma birefringence, the polarization state of THz waves cannot be accurately determined by that of the THz-field-induced SH waves. It would be inaccurate to measure arbitrary THz wave polarization in a single scan with THz-ABCD when the birefringence effect is significant. Therefore, such a polarization-resolved THz-ABCD approach can be applied only to THz time-domain spectroscopic characterization of materials that need only qualitative information.
Balanced detection of THz waves can usually improve the SNR or dynamic range significantly. For this purpose, balanced heterodyne THz-ABCD was demonstrated by Xiaofei Lu in Xi-Cheng Zhang’s group. Figure 9 schematically illustrates the approach for the balanced heterodyne THz-ABCD. Similar to the balanced detection in an EOS system, two nearly identical PMTs, instead of two photodiodes, are used in the system. The relative polarizations of the THz electric field, the electric field of the probe pulse, and the bias electric field are illustrated in the Cartesian coordinate system, as shown in the circle in the figure. Experimental results show that using balanced THz-ABCD, the dynamic range can be improved by a factor of [98], compared to the conventional THz-ABCD[40]. However, in independent experiments done by the authors at Tianjin University, it consistently shows that, when compared to the dynamic range of the detected THz signal obtained by simply blocking one of the PMTs, the dynamic range of the THz signal detected by the above balanced THz-ABCD is improved by a factor of two, whereas, in comparison with the dynamic range of the detected THz signal obtained by removing the Wollaston prism and having one of the PMTs detect the whole SH signal from the plasma, the dynamic range of the THz signal detected by balanced THz-ABCD shows no improvement probably due to the fact that the system noise level is higher than those of the PMT dark noise and laser fluctuations. Nevertheless, as a proof-of-concept demonstration, this work verified both theoretically and experimentally the feasibility of balanced heterodyne THz-ABCD for further improvement on the dynamic range of THz-ABCD in the near future.
Figure 9.Schematic of balanced THz-ABCD for pulsed THz waves. WP, Wollaston prism; PMT I, PMT II, photomultiplier tubes. The diagram inside the circle shows the polarizations of the THz field , probe electric field , and bias field in the Cartesian coordinate system. Figure reprinted with permission from Ref. [98], AIP Publishing.
2.3.2 Coherent THz wave detection utilizing THz-radiation-enhanced emission of fluorescence from gas plasma
The interaction between THz waves and laser-induced gas plasma not only can be used for SH generation (TFISH)[39,99] but also can enhance the emission of fluorescence, i.e., THz-REEF[53,54]. Investigation of THz-REEF indicates that such an enhancement in fluorescence can be utilized to coherently detect broadband THz waves.
In laser-ionized plasma, there are existing trapped electrons in the high-lying Rydberg states in atoms or molecules[100]. These trapped states can be easily excited into ionic states by colliding with electrons with high kinetic energy. After free electrons are further heated by the THz radiation, electron-impact ionization of these trapped states leads to the increase of the ion population, as shown in Fig. 10(a), resulting in enhanced fluorescence emission from molecules or ions on the nanosecond scale[101–103].
Figure 10.THz wave assisted electron impact ionization of high-lying states in plasma. (a) High-lying states can be ionized by a series of collisions with electrons with high kinetic energy. (b) Interaction between the THz pulse and the asymmetric photoelectron velocity distributions generated by two-color field ionization. Figures reprinted with permission from Ref. [54], Springer Nature.
In laser-induced ionization processes, electrons newly released from molecules or atoms acquire a constant drift velocity after the passage of the laser pulse[104]. The drift velocity is determined by the phase of the laser field at the birth of the free electron. Residual current density or asymmetric electron velocity distribution could remain in the plasma, ionized by single-color few-cycle pulses or by two-color fields with optimized relative phase[87,105,106]. When the THz wave interacts with the asymmetrical photoelectron velocity distributions generated by two-color asymmetrical laser fields, the amplitude and phase information of the THz waves themselves will be “encoded” on the fluorescence intensity change, as shown in Fig. 10(b), which is the key for coherent detection of THz waves through the THz-REEF effect.
Experimentally, to acquire the THz waveform, one can first obtain two time-dependent REEF curves (pump–probe curves) at two different relative phases between and pulses ︀ and then take the subtraction of one of the curves from the other one, resulting in the required THz waveform. Figure 11 shows the experimental setup used to coherently detect THz waves using THz-REEF[54], remotely. To get a THz waveform with a higher dynamic range, the difference between the two different relative phases of and pulses, at which the two THz-REEF curves are taken, is better set at . For example, one can take one THz-REEF curve when ︀ and take the other REEF curve at ︀, which maximizes the difference between the two curves, leading to an optimal detected THz signal. The upper panel in Fig. 12 shows three curves of time-resolved air plasma fluorescence enhancement from THz wave interaction with antiparallel (︀, blue curve), symmetric (︀, red curve), and parallel (︀, black curve) electron drift velocities with respect to the laser field, controlled by changing the relative phase between and optical pulses. The lower panel in Fig. 12 represents the THz waveform achieved by subtracting the parallel curve from the antiparallel curve, which removes the incoherent energy transfer by electrons after inelastic collisions and scattering in random directions[107]. To simplify the process for acquiring the THz waveform, one can also modulate the relative phase between and pulses mechanically or electronically while having the lock-in amplifier referenced to the modulation frequency (differential lock-in detection). This way, one can get the THz waveform directly by a single REEF scan.
Figure 11.Schematic illustration of the THz wave remote sensing technique via THz-REEF. An in-line phase compensator module is used to synthesize the two-color laser fields by controlling the relative phase between the fundamental and its second-harmonic pulses using the wedge pair[37]. After the phase compensator, both and pulses are linearly polarized along a vertical direction. These two optical pulses are focused by a parabolic mirror (PM1) through another parabolic mirror (PM2) with a hole into air to create plasma. The time delay is defined as the delay between the optical and THz pulses. The fluorescence detection module consists of a UV concave mirror (M1), UV plane mirror (M2), monochromator, and photomultiplier tube (PMT). The distance of remote sensing can be changed by moving the fluorescence detection module with respect to the plasma. DWP, dual-band wave plate. Figure reprinted with permission from Ref. [54], Springer Nature.
Figure 12.Time-resolved fluorescence enhancement in air plasma through THz wave interaction with antiparallel, symmetric, and parallel electron drift velocities with respect to the laser field, controlled by changing the phase between the and optical pulses. Subtraction of the parallel curve from the antiparallel curve eliminates the incoherent energy transfer by electrons after inelastic collisions and scattering in random directions. This reveals the THz waveform in the form of fluorescence modulation. The laser pulse leads the THz pulse in time for delay . Figure reprinted with permission from Ref. [104], Elsevier.
It is noteworthy that, experimentally, to efficiently detect THz waves using THz-REEF, total laser intensity inside the plasma should be sufficiently low, creating sufficiently low plasma density, so that there exist sufficient atoms or molecules in the high-lying Rydberg states to be further fully ionized by THz waves. In other words, fully ionized gas molecules or atoms in the plasma cannot be used to detect THz waves using the THz-REEF technique. Figure 13 shows THz waveforms sensed at distances of 0.1, 5, and 10 m, in comparison with that detected using traditional EOS. The Fourier transform spectrum of the THz waveform sensed at 10 m is shown in the inset. THz waveforms sensed at longer distances up to 30 m by means of THz-REEF were demonstrated[108]. These demonstrations offer the possibility for THz wave remote sensing.
Figure 13.THz waveforms detected at distances of 0.1, 5, and 10 m, in comparison with that detected using traditional EO sampling. The echo in the THz waveform around 7 ps is the reflected THz pulse from the ZnTe–air interfaces. The inset shows the corresponding THz spectrum obtained by Fourier transformation of the THz waveform sensed at 10 m. Figures reprinted with permission from Ref. [54], Springer Nature.
2.3.3 Coherent THz wave detection using THz-enhanced acoustics
Similar to THz-REEF, under the illumination of single-cycle THz radiation, the acoustic waves from laser-induced gas plasma can be enhanced, called TEA. Figure 14 illustrates the generation, enhancement, and detection of acoustic waves under excitation of single-color or two-color laser pulses. First, single-color ( or ) or two-color ( and ) laser pulses are focused in air to create plasma and generate acoustic waves, and then, after a certain amount of time delay the THz wave is applied to plasma and enhances the emission of the acoustic wave. The acoustic wave is detected by a sensitive microphone supplied by G.R.A.S.
Figure 14.(a) Schematic illustration of the experimental setup used for the TEA under excitation of single-color or dual-color laser pulses. (b) Individual photoacoustic waveforms measured at a distance of 5 mm with (red dashed curve) and without (black solid curve) a 100-kV/cm THz field. The acoustic wave is measured by a G.R.A.S. microphone. The inset shows the acoustic spectrum. Figures reprinted from Ref. [55], Optica.
To achieve the THz waveform, two time-resolved TEA signals at two different relative phases (i.e., relative delay ) are scanned by varying the time delay between the THz and optical pulses, as shown in Fig. 15(a). By taking the difference between the two time-resolved TEA curves, one can obtain the THz waveform, as shown in Fig. 15(b). This process is essentially the same as that used to achieve the THz waveform using THz-REEF. Similarly, one can acquire the THz waveform using a TEA signal by a single scan using differential lock-in detection. Compared to THz-REEF, when TEA is used to sense THz waves, the microphone has to be placed very close to the plasma. In other words, remote THz wave sensing using TEA has not been achieved due to the higher acoustic background noise in the environment.
Figure 15.(a) Time-resolved TEA signals obtained for and . The inset shows the measured THz signals from two-color laser-induced plasma at different (no external THz field present), which is the phase curve. (b) THz time-domain waveforms achieved using the THz-enhanced acoustics method and EO sampling for comparison. The inset shows the corresponding THz spectra. Figures reprinted from Ref. [55], Optica.
2.4 Coherent Control of THz Wave Generation from Laser-Induced Gas Plasma
Coherent control of THz wave generation from air plasma includes both THz wave amplitude and polarization controls[9,11,13,36,37,89]. In those early reports, only the coherent control of THz wave amplitude was demonstrated, with the purpose of optimizing the THz wave emission efficiency in two-color laser-induced gas plasma or clarifying theoretical mechanisms for THz generation processes[9,11,13]. Coherent polarization control of THz waves generated from dual-color laser-induced gas plasma was first reported in 2009, almost simultaneously by Haidan Wen in Aaron Lindenberg’s group and Jianming Dai in Xi-Cheng Zhang’s group with different experimental approaches and theoretical explanations[36,37]. The three theoretical models depicted in Section 2.2, including FWM, ATC, and FQM, can be used to reproduce the experimental observation on coherent polarization control. However, the quantum mechanical model can be used to more accurately clarify the underlying microscopic physical picture. Therefore, we use the FQM model to introduce, in detail, the physical picture, the full quantum mechanical simulation, and experimental approach on coherent polarization control of THz waves emitted from two-color laser-induced gas plasma.
In the FQM simulation, as described in Section 2.2, both and laser pulses are linearly polarized in the same direction, and the THz radiation is expected to share the same polarization as the two pump laser pulses, and therefore, the problem can be treated two-dimensionally[86]. However, when optical fields with circular or elliptical polarization are applied, the laser–atom interaction requires three dimensions, since the optical field is capable of coupling states with differing values of the z-projection of the angular momentum () in addition to the angular momentum . This was calculated by representing the electron wave function as a series of partial waves in spherical coordinates, with a spatial radial dimension and momentum-space angular dimensions, and numerically solving the TDSE[90].
Figure 16 shows the theoretical results using 3D quantum mechanical simulation when the relative phase between the circularly polarized fundamental () and SH () pulses is varied. Results indicate that electrons stripped from an atom or molecule by circularly or elliptically polarized and laser pulses exhibit different trajectory orientations as the phase between the two laser pulses varies. It is noteworthy that the emitted THz electric field is linearly proportional to the second time derivative of electron trajectories, and therefore, Fig. 16(c) actually shows the THz electric field polarizations at different relative phases , indicating that the polarization orientation of THz waves rotates as the relative phase changes.
Figure 16.Three-dimensional quantum mechanical simulation, showing (a) electron expectation value trajectories in the dual-color field, (b) electron trajectories with the laser-driven quiver motion removed, and (c) second time derivative of the trajectories showing the effective polarization of the emitted radiation when the relative phase between the circularly polarized fundamental and second-harmonic pulses changes. (d), (e) Electron density distribution in the z–x plane (scaled logarithmically) when the phase is and , respectively. (f) Momentum space electron density distribution (scaled logarithmically, bound states removed) when phase is . Figures reprinted with permission from Ref. [34], American Physical Society.
Experimentally, an in-line PC with an attosecond phase-control accuracy and a phase delay scanning range of about 200 fs, depending on the length and angle of the wedges, was designed and utilized for the first time[37], as shown in Fig. 17(a). Compared to other PCs, such as the interferometric PC[109] and the phase plate[110], the in-line PC has the advantage of either phase stability and reliability or sufficient phase scanning range. Figure 17(b) shows a typical phase curve (phase scan) achieved by varying the relative phase between and pulses through changing the insertion of one of the wedges while monitoring the THz average power with a pyroelectric detector (THz wave power meter). The phase scanning range in the figure is above 100 fs, depending on the full length and the apex angle of the wedge pairs.
Figure 17.(a) Schematic diagram of the experimental setup. Enclosed in the dashed box is an in-line phase compensator. , beta barium borate crystal; BP, birefringent plate; QW, a fused silica wedge pair used to control the relative phase between the and pulses; DWP, dual-wavelength wave plate (quarter-wave plate at and half-wave plate at ); the upper and lower arrows near the laser beams represent the polarizations of the and pulses, respectively. (b) Phase scan obtained by monitoring the THz average power as the relative phase between the and pulses changes when both and pulses are linearly polarized and share the same polarization direction; the inset displays a zoomed-in portion of the phase scan near the “zero” phase delay.
In the experiment, a wire-grid THz polarizer, a THz bandpass filter used to make sure the THz frequency components are within the effective frequency range of the THz polarizer, and a THz wave power meter (pyroelectric detector) are used to inspect the THz wave polarization. Results show that when both and pulses are elliptically polarized or one of the pulses is circularly polarized while the other pulse is elliptically polarized, the emitted THz wave from the two-color laser-induced gas plasma is elliptically polarized but very close to linear polarization (with very small ellipticity), and the intensity of the emitted THz wave passing through the THz polarizer changes as the relative phase varies, as shown in Fig. 18(a), indicating that the THz wave polarization orientation rotates and the THz wave amplitude varies as the relative phase between the and pulses changes. Figure 18(b) is the corresponding simulation result using the 3D FQM model. In particular, when both and pulses are circularly polarized, the polarization orientation of the emitted THz wave rotates while the intensity or the electric field of the THz wave is kept constant as the relative phase between the laser pulses changes, as shown in Figs. 18(c) and 18(d). This particular case is very important for some applications, such as fast THz wave modulation and coherent control of nonlinear responses excited by intense THz waves with controllable polarization.
Figure 18.THz intensity versus THz polarizer rotation angle and the relative phase between the and pulses (a) with left-handed circularly polarized pulse and elliptically polarized pulse (with an ellipticity of about 1/11 in terms of optical intensity) and (c) with both and beams right-handed circularly polarized. (b) is the corresponding simulation result in the case of (a), and (d) the simulation result with ideally circularly polarized optical beams. The color scale represents the THz wave power or intensity. Figures reprinted with permission from Ref. [34], American Physical Society.
Full polarization control of THz waves emitted from two-color laser-induced gas plasma filaments has been achieved by Zhengming Sheng’s and Yanping Chen’s group[89]. In their work, predicted by their linear-dipole array model[88], by changing the length of the plasma filament using a metal iris along with changing the relative phase between the and pulses, not only can the polarization orientation (azimuthal angle) of the emitted THz wave from gas plasma filament be coherently controlled, but also the ellipticity and chirality can be modified, experimentally, as depicted in Fig. 19. The full control of THz wave polarization characteristics can find a wide range of applications in materials analysis, structural biology, remote sensing, and communications in THz frequency ranges.
Figure 19.(a) Schematic diagram of the experimental setup. A femtosecond laser pulse is focused by a lens to form a laser filament in air. A crystal is inserted in the laser beam for second-harmonic generation, and an in-line phase compensator (IPC) is employed for the control of the relative phase change between the and pulses. Both and beams are linearly polarized after the IPC, where their polarization directions differ by 46° ( and ). Then, the linearly polarized pulse is converted to a circularly polarized pulse by a quarter-wave plate (QWP) with its optical axis parallel to the polarization direction of the pulse. The probe beam and THz beam are focused collinearly into the ZnTe crystal for electric-optical sampling of the THz waveforms. . Inset: modification of plasma filament length by moving a metal iris with a 2-mm clear aperture. (b), (d) Far-field polarization trajectories (, ) of THz radiations obtained experimentally from a short filament and long filament, respectively, when the relative phase between the and pulses is changed with a step size of . (c), (e) Simulation results are shown for a short filament (c) and long filament (e). (f), (g) Typical waveforms (f) and their Fourier transform spectra (g) of measured elliptically polarized radiation from a 23-mm-long filament. Figures reprinted with permission from Ref. [89], Springer Nature.
Later, we experimentally found that the THz emission spectrum is dependent on the relative phase between and pulses, especially near the phase value when the minimal THz emission efficiency is reached. In the FWM model, there is no THz emission from laser-induced gas plasma when the relative phase equals , based on Eq. (1). Numerical simulation using the ATC model shows that a nonzero minimal THz emission can be found when the relative phase is zero and is about of the maximal THz emission in terms of spectral power when the phase is [12,13], without any pronounced feature in the THz spectrum between 0.1 and 10 THz. In the FQM model, however, simulation results show that when the relative phase is set near the value for the minimal THz emission, there is a pronounced “dip” in the THz spectrum. To test the theoretical prediction using the FQM model, the phase-dependent THz wave emission spectrum is measured.
To perform the experiment on the phase-dependent THz emission spectrum, a laser system delivering a total pulse energy of about 800 µJ at 800 nm with a pulse duration of about 100 fs is utilized. The laser pulse was first sent through an in-line PC, creating an SH pulse at 400 nm through the -BBO crystal in the PC. The residual pulse at 800 nm and its SH pulse at 400 nm were kept linearly polarized with their electric fields parallel to each other for simplicity. The two-color laser beams were then focused by an aluminum-coated PM with an EFL of 6 in., creating plasma and generating broadband THz waves. The generated THz waves were measured using EOS with a 0.3-mm-thick, cut GaP crystal rather than ZnTe for broader detection bandwidth.
In the experiment, consecutive THz waveforms were taken at different values of the relative phase between and pulses with a phase step size of . Those different phase values were obtained by changing the insertion of one of the wedges into the laser beams in the in-line PC assembly, as shown in Fig. 17(a). By Fourier transforming of these THz waveforms, 3D plots of the THz spectral change in THz amplitude versus the relative phase were obtained. Figure 20(a) shows a 3D plot of the THz electric field versus the time delay (for waveform scan) and the relative phase, and Fig. 20(b) is the 3D plot of the corresponding Fourier transform spectra. The color scale in both Figs. 20(a) and 20(b) represents the THz wave amplitude.
Figure 20.(a) THz electric field as a function of time delay and relative phase in the time domain. (b) 3D plot of the THz spectral change in THz amplitude versus the relative phase. (c) Normalized 3D THz spectrum in amplitude. (d) Individual THz emission spectra (normalized) at different relative phases, showing the THz emission spectral change versus relative phase.
Figures 20(a) and 20(b) simply indicate coherent amplitude control of THz waves from two-color laser-induced gas plasma in the time and frequency domains, respectively, as has been done previously. To show the THz spectral characteristics more clearly, normalized 3D spectra are plotted in Fig. 20(c). One can see that there are very pronounced features (a “dip” appears in the 3D spectrum) when the relative phase approaches the value at which the THz emission efficiency reaches minimal. Shown in Fig. 20(d) are individual THz emission spectra (normalized) at different relative phases, which clearly show the THz emission spectral change as the relative phase varies. Figure 21(a) shows the THz waveform (top one in black) obtained when the relative phase between and pulses reaches the optimal value for maximal THz emission. As a comparison, the THz waveform obtained when the phase reaches a value at which the THz emission efficiency was minimized is multiplied by a factor of eight for clarity (bottom one in red). Both waveforms were measured using EOS with a 0.3-mm, cut GaP crystal. The minimal THz peak electric field is about one order of magnitude lower, compared to the maximal one. When the THz emission is minimized, the THz waveform is splitting and is no longer a single-cycle pulse. Figure 21(b) displays the corresponding Fourier transform spectra of waveforms displayed in Fig. 21(a). Using the FQM model[86], the spectral features shown in Figs. 20 and 21 can be reproduced. However, neither the FWM nor ATC model can be used to explain and reproduce the “waveform splitting” feature in the time domain and the “spectral dip” in the frequency domain. The relative phase-dependent THz emission spectral characteristics further verify that the FQM can accurately describe the whole THz wave generation process in two-color laser-induced gas plasma.
Figure 21.(a) THz waveform (top) obtained when the relative phase between the and pulses reaches the optimal value for maximal THz emission from the plasma and the THz waveform (times a factor of eight for clarity, and it is an average of 25 individual scans for sufficient dynamic range) obtained when the phase reaches a value at which the THz emission efficiency is minimized. Both waveforms were measured using EO sampling with a 0.3-mm, cut GaP crystal. (b) Corresponding spectra for waveforms displayed in (a).
2.5 High-Field THz Wave Generation from Laser-Induced Gas Plasma
The femtosecond dual-color laser-induced gas plasma exhibits a remarkable ability to generate pulsed THz waves with excellent directionality, super-broad bandwidth covering the entire THz gap and well beyond, and extremely high dynamic range for applications in THz nonlinear spectroscopy, sensing, and imaging. In this section, we will introduce some experimental results on such a super-broadband high-field THz source.
THz wave generation efficiency from two-color laser-induced gas plasma is highly dependent on the pulse energy and pulse duration/bandwidth. At moderate excitation optical pulse energy and pulse duration, for example, using a 100-fs, 600-μJ laser pulse, the laser-induced gas plasma can generate a THz electric field of about 100 kV/cm with a frequency coverage wider than 10 THz (using the THz-ABCD technique for THz wave detection). Figure 22 shows a typical THz waveform and its Fourier transform spectrum using 100-fs, 600-μJ laser pulses for THz wave generation using the geometry shown in Fig. 1(b) and EOS for THz wave detection with a 0.3-mm, cut GaP crystal.
Figure 22.A typical THz waveform and its Fourier transform spectrum at moderate pump pulse energy and pulse duration. A pump pulse with 100-fs pulse duration and 600-μJ pulse energy is focused through a crystal for second-harmonic generation using a lens with an effective focal length of 150 mm to create plasma and generate a THz wave, and the same laser pulse with reduced pulse energy is utilized to detect the emitted THz wave using EO sampling with a 0.3-mm, cut GaP crystal. The dynamic range of the THz signal in time-domain is over 8000.
When shorter laser pulses with high pulse energy are used, the generated THz wave can reach over 1.0 MV/cm with a frequency coverage over 50 THz. Such a peak THz electric field can completely saturate the EOS system with a 0.106-mm GaP crystal. Using a fused silica lens with EFL of 150 mm to focus 800-nm, 28-fs, 2.7-mJ laser pulses through a 0.1-mm to create plasma, the detected THz wave peak electric field using a 0.106-mm GaP for EOS can reach 1.41 MV/cm.
In the experiment, the entire THz system is purged with nitrogen gas to eliminate the water vapor absorption. Figure 23(a) shows a clear photo of the two-color laser-induced plasma in nitrogen gas taken with a regular camera. The length of the plasma is about 10 mm measured by vision. To get a true THz waveform, we have to use 4–5 high-resistivity silicon (Si) wafers to intercept the THz beam to attenuate the emitted THz electric field to avoid the saturation effect in the EOS system. Figure 23(b) shows a series of THz waveforms as the number of Si wafers increases. When only one Si wafer is used to attenuate the THz electric field, the detected THz waveform is completely deformed, indicating that the EOS system is deeply saturated. As the number increases the THz waveform measured by the same EOS system with 0.106-mm GaP crystal becomes normal and finally the shape of the THz waveform stays constant when the number of Si wafers is more than four. Figures 23(c) and 23(d) show a THz waveform with a peak electric field of 1.41 MV/cm in the time domain and its Fourier transform spectrum in the frequency domain.
Figure 23.(a) Clear picture of the two-color laser-induced plasma in nitrogen gas created by an 800-nm, 28-fs, 2.7-mJ laser pulse focused through a 0.1-mm by a 150-mm fused silica lens. The plasma length is about 10 mm measured by vision. (b) Series of THz waveforms obtained with different numbers of silicon wafers used to attenuate the THz electric field, showing the saturation of the EO-sampling system with a 0.106-mm GaP by the THz wave with high peak electric field. Knowing the refractive index of GaP crystal, the thickness of the crystal can be very precisely calibrated simply by locating the second THz waveform reflected by the GaP–air and air–GaP interfaces in the time domain. (c) THz waveform with a peak electric field of 1.41 MV/cm and (d) corresponding Fourier transform spectrum.
Even though there are phonon absorption bands around 9.44, 10.43, and 12.2 THz in GaP[111,112], the frequency coverage of the Fourier transform spectrum shown in Fig. 23(d) can be over 20 THz due mainly to the high THz electric field of the detected THz waveform and to the very thin GaP crystal. This is a pronounced feature for the two-color laser-induced gas plasma THz source when the THz electric field in the EO crystal reaches over 200 kV/cm and the thickness of the detection GaP crystal is very small.
Using the THz-ABCD technique to detect the high-field THz wave achieved above, a very “sharp” THz waveform can be achieved, as shown in Fig. 24(a), and the Fourier transform spectrum is much broader, as shown in Fig. 24(b). One can see that the frequency coverage is nearly 100 THz with a plateau covering the entire THz gap and beyond. The THz peak electric field can then be recalibrated using the THz waveform obtained with THz-ABCD, and a peak electric field of is achieved, as shown in Fig. 24(a). It is reasonable that the THz peak electric field calibrated by THz-ABCD is higher than that calibrated through EOS with a 0.106-mm GaP crystal since the detection bandwidth of the THz-ABCD technique is broader than that of EO detection. The dynamic range of the THz signal in the time domain is higher than 30,000.
Figure 24.(a) THz waveform detected with THz-ABCD technique, showing that a peak electric field of is achieved. (b) Fourier transform spectrum of the THz wave, indicating that a frequency coverage of nearly 100 THz is obtained. The spectral plateau can cover the entire THz band and beyond.
Such a high-peak electric field is sufficient to excite the nonlinear responses from materials such as metamaterials. Here, we give an example for the application of the air plasma-based high-field THz source to nonlinear THz-TDS of metamaterials. In the experimental setup (not shown), THz waves generated from gas plasma are collimated and refocused, forming a beam waist for spectroscopic characterization of materials, and then the THz waves are re-collimated and refocused by another pair of PMs onto a 0.106-mm GaP crystal for EOS. An open-aperture Z-scan technique by scanning the metamaterial sample across the beam waist along the THz beam (equivalently changing the electric field strength on the samples) is employed to check the nonlinear responses at different sample positions with respect to the THz beam waist. It is indicated that the resonance properties of metamaterials change as the applied THz electromagnetic field increases. One can see that in the transmitted spectra through the metamaterial sample fabricated on a GaAs/AlGaAs multiple quantum well substrate [Figs. 25(a), 25(c), and 25(d)], there is a redshift in the resonance when the sample is moved closer to the THz beam waist (THz electric field is higher). Importantly, there is obviously a threshold behavior: when the calibrated THz peak electric field is less than , there is no pronounced resonance frequency shift. Only when the electric field is higher than does the shift starts, and as the electric field increases, the resonance frequency further shifts to lower frequencies. Figure 25(b) shows transmitted spectra of a pure substrate—a GaAs/AlGaAs multiple quantum well, indicating that the resonance frequency shift is not intrinsically from the substrate. The inset of Fig. 25(d) shows the pattern of the metamaterial structure under investigation and the electric field polarization of intense THz waves.
Figure 25.(a) Transmitted spectra of THz waves when the metamaterial sample using GaAs/AlGaAs multiple quantum well as the substrate is at different positions (different THz electric field strengths) along THz beam path. (b) Transmitted spectra of the GaAs/AlGaAs multiple quantum well substrate at different positions. (c) Normalized transmission spectra of the material sample at different positions. (d) Three normalized transmission spectra at different sample positions, corresponding to three THz electric fields of about 390, 430, and 530 kV/cm. The THz beam waist is located at a position of 1.4 mm. Inset of (d) shows the golden metamaterial pattern fabricated on GaAs/AlGaAs multiple quantum well substrate.
Moreover, significant approaches are proposed and experimentally demonstrated in an attempt to further increase the optical-to-THz conversion efficiency and THz peak electric fields. In the following subsections, we present these remarkable techniques that push the gas plasma-based THz source to a new level in terms of conversion efficiency, peak electric field, and bandwidth.
2.5.1 High-field THz wave generation with high pump pulse energy by plasma reshaping and system optimization
Significant improvements in the peak THz electric field were demonstrated by K. Y. Kim’s group. First, they increased the peak THz electric field to over 8 MV/cm simply by using higher energy laser pulses directly from a commercial Ti:sapphire amplifier working at a 1-kHz repetition rate[113]. Then, without using an optical parametric amplifier (OPA) (i.e., without increasing the complexity of the entire THz system), they further enhanced the THz electric field to over 21 MV/cm by plasma reshaping[114]. First, a peak THz electric field of over 8 MV/cm is achieved using a high-energy amplified laser system (30 fs, 15 mJ) in combination with a thin dual-wavelength half-wave plate and a Brewster-angled Si window to enhance THz generation and transmission[113]. Figure 26 shows the schematic diagram of the experimental setup for the generation, detection, and calibration of the THz electric field of . The peak THz electric field was pushed to over 21 MV/cm by focusing 10-Hz, TW, 800-nm laser pulses from a commercial amplified laser system through a BBO crystal in air with a cylindrical lens. Such a focusing geometry creates a two-dimensional (2D) air plasma sheet, yielding two diverging THz lobe profiles in the far field and providing an optical-to-THz conversion efficiency of . The diverging THz lobes are refocused with a combination of cylindrical PMs to produce strong THz fields at the focal point. Shown in Fig. 27 is the schematic of the experimental setup used to achieve scalable THz generation from a 2D plasma sheet created by focusing the pump laser beam with a cylindrical lens. These two approaches are very practical and effective for further scaling of the THz emission from two-color laser-induced gas plasma using laser pulses directly from commercial laser systems without pump wavelength conversion through an OPA.
Figure 26.Schematic illustration of the experimental setup for intense THz wave generation via two-color laser filamentation in air and characterization. To maximize THz wave generation efficiency, a dichroic wave plate and a large-sized (4 in.) Brewster-angled high-resistivity silicon (Si) window are used. THz waveforms, energies, and beam profiles are measured to determine the peak THz field (). An uncooled microbolometer focal plane array with various filters in two different modes is used to measure the THz wave beam profile. Figure reprinted with permission from Ref. [110], AIP Publishing.
Figure 27.Experimental scheme for high-field THz wave generation from a two-dimensional (2D) plasma sheet created by focusing the laser beam with a cylindrical lens. The 2D plasma sheet emits an array of vertically overlapping conical THz beams, resulting in two upright THz lobes in the far field due to constructive interference. Figure reprinted with permission from Ref. [111], AIP Publishing.
Very recently, Weiwei Liu’s group demonstrated record-high optical-to-THz conversion efficiency[115] using laser pulses at 800 nm directly from a commercial Ti:sapphire amplifier working at 1 kHz. By carefully designing the optical setup for generating THz waves from a two-color laser-induced plasma filament to achieve precise superposition of and pulses in space and time along with compensation of the relative phase delay between the two-color laser pulses using BBO, , and a dual-wavelength plate, the maximum output THz pulse energy from argon gas reaches 21 µJ, leading to a conversion efficiency exceeding 0.35% when 30-fs, 6-mJ laser pulses at 800 nm are used. Figure 28 shows the experimental setup and the approach used to achieve such high optical-to-THz conversion efficiency.
Figure 28.Experimental setup for high-energy THz pulse generation from laser-induced plasma filament in gases. The optical elements in the dashed frame need to be removed when measuring the THz autocorrelation curve (i.e., FTIR time-domain signal). HWP, half-wave plate; L, lens; , ; , ; DWP, dual-wavelength plate; TFL, Teflon; OAP, 90° off-axis parabolic mirror; Si, silicon wafer; GC, Golay cell. Inset: schematic diagram showing how to achieve the precise spatial superposition of the and beams by tilting the crystal. Figure reprinted from Ref. [115].
These works hold the advantage of system simplicity since no OPA is required for pump wavelength conversion. When an OPA is used, the entire THz system becomes more complicated and the overall optical (800 nm)-to-THz conversion efficiency may be reduced since most OPAs can convert only about 15% of the near-infrared (NIR) (800 nm) laser pulse to a mid-IR laser pulse at longer wavelengths.
2.5.2 Enhancement of THz radiation by circularly polarized two-color laser fields
The use of circularly polarized two-color laser pulses for enhancement of THz wave generation from laser-induced gas plasma was experimentally demonstrated by Jianmin Yuan’s group[116]. Shown in Fig. 29 is the experimental setup used to investigate the THz radiation from tunnel ionization of gaseous atoms or molecules under excitation of two-color laser fields with various polarizations. A fundamental laser pulse at 800 nm passes through a BBO, creating an SH pulse at 400 nm, and a wedge pair is inserted across the two-color laser beam to finely control the relative phase between the 800 and 400 nm pulses. The first dichroic splitter is used to separate the collinearly propagating two-color laser pulses into two arms at 800 and 400 nm. The wave plates ( at 800 nm, at 800 nm, and at 400 nm) are used to change the polarizations of the two beams to desired ones. The lenses in the two arms are used to focus the laser beams, and the second dichroic mirror is used to combine the two arms, making the two beams collinearly propagate and create plasma at the common focus for THz wave generation. To stabilize the interferometer, the interference of an individual continuous green laser co-propagating with the two-color lasers is monitored as a feedback signal, and the real-time control of a mirror with a piezoelectric transducer is employed to keep the interference pattern stable. The active feedback can efficiently reduce the mechanically induced position variation of the mirrors used in the interferometer and minimize the relative phase fluctuations of two-color fields. Since the polarizations of the two-color beams change significantly if the beams are incident on the second dichroic mirror at large angles of incidence, the incidence angles are kept very small.
Figure 29.Schematic of the experimental setup. The THz power is measured by a Golay cell. Figure reprinted with permission from Ref. [116], AIP Publishing.
THz radiation is produced from an ionizing argon jet at a back pressure of 200 mbar under excitation of two-color laser fields with a total laser intensity of . Figure 30 shows the phase curves obtained by scanning the relative phase between the two-color laser fields (changing the insertion of any of the wedges) with different polarizations and helicities while monitoring at the THz power with a Golay cell. Among different combinations of polarizations and helicities, one can see that circularly polarized two-color fields with the same helicity () generate about five times more THz power than those with two-color fields linearly polarized in the same direction (). When the two-color laser fields are orthogonally polarized () or circularly polarized with counter helicity (), the emitted THz power is minimized. The phase curves for circularly polarized two-color laser fields ( and ) are significantly different from those with linearly polarized fields ( and ) applied. In the case of circularly polarized two-color fields, the phase curves do not show pronounced interference fringes, indicating that the emitted THz power or amplitude stays almost constant as the relative phase between the fields varies within a range of several phase cycles near the zero phase difference. These are consistent with those reported by Xi-Cheng Zhang’s group[37].
Figure 30.Dependence of THz power on the relative phase between the two-color fields. THz radiation is emitted from ionizing argon gas jet at a back pressure of 200 mbar with a laser peak power intensity of in cases of two-color laser fields circularly polarized with the same (CP-S) (, red line) and counter (CP-C) (, pink line) helicities as well as linearly polarized with the same (LP-P) (, blue line) and orthogonal (LP-O) (, black line) polarization directions. The inset indicates the THz power in cases of LP-O and CP-C. Figure reprinted with permission from Ref. [116], AIP Publishing.
The demonstration provides an effective approach to further scaling of the optical-to-THz conversion efficiency when a fixed laser system is used.
2.5.3 THz wave generation from laser-induced gas plasma under excitation of multi-color laser fields
The use of multi-color laser fields to generate electromagnetic radiation covering from the THz to IR range from gas plasma was first reported by Poul B. Peterson’s group[117]. In this work, the authors reported a tenfold increase in electromagnetic radiation power. A theoretical simulation on the enhancement of THz radiation from gas plasma under excitation of sawtooth laser fields synthesized from multi-color (typically three-color) laser pulses was demonstrated by P. González de Alaiza Martínez’s group and their collaborators[118]. They have shown that by using laser pulses with multiple central wavelengths, one can synthesize an optical waveform that optimizes the free electron trajectories so that these electrons acquire the highest drift velocity for higher-efficiency THz wave emission. Later, Virgiligus Vaicaitis’s, Liangliang Zhang’s, and Yi Liu’s groups reported the experimental investigation of the enhancement of electromagnetic radiation using such an approach, specifically on THz radiation[119–122]. Their demonstrations indicate that the use of multi-frequency laser fields to ionize atoms or molecules can significantly enhance the THz wave generation efficiency from gas plasma, compared to the case when two-color laser fields are used.
2.5.4 Wavelength scaling of THz wave generation from dual-color laser-induced gas plasma
Utilization of ultrafast laser pulses centered at longer wavelengths for more efficient THz wave generation was first reported by Matteo Clerici and his collaborators[38]. A theoretical investigation of the THz emission from dual-color laser-induced gas plasma indicates that the emitted THz energy follows a quadratic dependence on the excitation wavelength, i.e., . Figure 31 shows both theoretical results and experimental verification of the predictions. The combined effects of plasma currents increasing proportionally to the square of the pump wavelength and wavelength-dependent focusing conditions lead to 30 times higher THz emission at 1800 nm in comparison with that at an 800 nm wavelength. In the experiment, different pump wavelengths are obtained from a commercial OPA.
Figure 31.(a) Dependence of emitted THz energy on the pump laser wavelength obtained by numerical simulation (red solid curve). The black dashed curve shows the simulation result on the plasma density (right axis). The THz energy in (a) is normalized and the experimental data are overlapped for clarity (solid circles). (b) Recorded THz energy achieved at 12 different pump wavelengths ranging from 0.8 to 2.02 µm (solid circles). The red solid curve shows the power law fit () along with the 65% confidence bounds (red dashed curves). Figures reprinted with permission from Ref. [38], American Physical Society.
Figure 32 shows the THz waveforms and their Fourier transform spectra generated from two-color laser-induced gas plasma pumped at different wavelengths (1850, 1450, and 800 nm). As a result, the peak THz electric field can reach 4.4 MV/cm, calibrated by the THz-ABCD technique.
Figure 32.(a) Normalized THz waveforms acquired with THz-ABCD detection scheme for 400-µJ pump laser energy at 1850, 1450, and 800 nm pump wavelengths (left to right, shifted in time for clarity). (b) Power spectra of the THz waves in (a) (800 nm dashed, 1450 nm dotted-dashed, and 1850 nm solid). (c) THz beam profile recorded at the focus of the last parabolic mirror for 1850-nm pump wavelength with a THz camera. The overlay in (c) shows the Gaussian fit for the THz spot size at the focus of the last parabolic mirror. Figures reprinted with permission from Ref. [38], American Physical Society.
Using mid-IR laser pulses at a longer wavelength (3.9 µm) from an extremely high-energy OPA at a 20-Hz repetition rate, Stelios Tzortzakis’s group demonstrated the generation of THz waves with a THz peak electric field over 100 MV/cm and an optical-to-THz conversion efficiency of 2.36%[123], which is, to date, the highest record on the THz peak electric field and conversion efficiency.
Enhancement of THz wave emission from laser-induced plasma using long wavelength excitation is a very efficient approach for high-field THz optics. Further scaling of the THz emission from two-color laser-induced gas plasma with longer wavelengths is certainly feasible and paves the way toward free space extreme nonlinear THz photonics using affordable table-top laser systems. Applications of high-field THz waves, such as charged particle accelerators, are made possible.
2.6 Backward THz Wave Radiation from Two-Color Laser-Induced Gas Plasma Filament
Backward THz wave radiation from two-color laser-induced air micro-plasma has been reported by A. A. Ushakov’s group[124]. Here, we briefly introduce our experimental approach and results on backward THz emission from a two-color laser-induced plasma filament, rather than micro-plasma, in ambient air.
Using the linear dipole array model[88], backward THz radiation from two-color laser-induced gas plasma can be predicted. Figure 33 shows the schematic of the experimental setup used to generate and collect backward radiation. The fundamental pulse is focused by a lens through a crystal generating its SH pulse. Then the and pulses pass through the hole on the PM collinearly and create a plasma filament around the focus of the PM. Backward THz radiation is collected and collimated by the same PM. The collimated THz beam is refocused by another PM onto a 1-mm-thick cut ZnTe crystal for EOS of the THz waveform.
Figure 33.Schematic of the experimental setup used to collect the backward THz radiation from two-color laser-induced gas plasma filament.
Figure 34(a) shows the THz waveform and its Fourier transform spectrum (inset) of THz backward radiation from the plasma filament created by two-color laser fields with a total pump laser pulse energy of μ and a pulse duration of about 100 fs. The amplitude of backward radiation is about two or more orders of magnitude lower than that of forward radiation, highly depending on the length of the plasma filament or the EFL of the lens. Here, a lens with an EFL of 100 mm is used. As the focal length of the lens increases (subsequently, the plasma length is elongated), the amplitude of backward THz radiation decreases dramatically.
Figure 34.(a) Waveform and spectrum (inset) of the backward THz radiation from two-color laser-induced plasma filament. The effective focal length of the pump lens is 100 mm, and the total pump pulse energy is ∼480 μJ with pulse duration of at 800 nm. (b) Normalized THz waveforms at different pump pulse energies, showing a temporal shift of the THz wave peaks in the time domain as the pump intensity changes due to the self-focusing/defocusing effects in gaseous media. The dashed lines in orange are theoretical fits.
Figure 34(b) shows a series of normalized THz waveforms at different pump pulse energies, exhibiting a temporal shift of THz wave peaks in the time domain as the pump intensity changes due to the self-focusing and defocusing effects as the ultrashort laser pulses propagate in air and air plasma. The dashed lines in orange are theoretical fits using the nonlinear-focusing formula. More details on this work will be reported elsewhere.
2.7 Stand-Off THz Wave Generation from Two-Color Laser-Induced Gas Plasma Filament
Ambient air exists everywhere around the globe, making it possible to remotely generate and detect intense THz waves by sending and focusing laser pulses to locations at long distances. Figure 35(a) schematically illustrates the experimental setup used for stand-off THz wave generation from two-color laser-induced air plasma. The total laser pulse energy used here is about 800 µJ at 1-kHz repetition rate, and the pulse duration is 100 fs. An interferometric PC is employed to pre-compensate the temporal walk-off between the fundamental laser pulse at 800 nm and its SH pulse at 400 nm induced by the dispersion in air during propagation of the two laser pulses. The use of an interferometric PC rather than an in-line PC is due to the longer phase scan range for the compensation of the large temporal walk-off. A detailed illustration of the PC is shown in Fig. 35(b). The strategy for design of the PC is to keep the optical path lengths in the two arms of the interferometer as short as possible to reduce the phase fluctuation induced by air turbulence. Figure 35(c) shows a typical phase scan achieved by monitoring the peak THz electric field while scanning the relative phase between and pulses. The THz amplitude is obtained through EOS with a 1-mm-thick, cut ZnTe crystal.
Figure 35.(a) Schematic illustration of the experimental setup for stand-off THz wave generation from two-color laser-induced air plasma. PC, phase compensator used to pre-compensate the temporal walk-off between and laser pulses; M1, M2 convex and concave mirrors, respectively, used to expand and focus the laser pulses to create plasma at stand-off distances. (b) Schematic diagram of the interferometric phase compensator (PC). DM, dichroic mirror used to reflect the pulse and transmit the laser pulses. HWP, half-wave plate at used to rotate the polarization of the pulse. (c) Phase scan obtained by scanning the relative phase between and laser pulses while monitoring at the peak THz electric field using EO sampling with 1-mm ZnTe crystal. The inset is a zoomed-in portion of the phase scan, showing a very high dynamic range.
Figure 36 shows THz waveforms generated at distances of 6.5, 10, and 17 m. Stand-off generation of THz waves at longer distances is possible using high-energy laser pulses and larger-aperture optics used to focus the laser beams to create sufficient laser intensity at the locations of interest.
Figure 36.THz waveforms generated at stand-off distances of (a) 6.5 m, (b) 10 m, and (c) 17 m. The total laser pulse energy is about 800 µJ. Figures reprinted with permission from Ref. [125], IEEE.
THz radiation from liquids was first reported by Xi-Cheng Zhang’s group using a free-flowing water film[34], formed between two very thin metal wires[126], as the THz wave emitter. Then G. Ravindra Kumar’s group reported THz wave generation from a laser-induced filament in liquids contained in a cuvette[44]. However, in the later work, the method used to measure the radiation from a liquid plasma filament is not coherent, and therefore, the measured electromagnetic radiation cannot be guaranteed to be coherent THz radiation. In this part, we mainly focus on coherent THz radiation, manipulation, and detection using liquids. Before going into detail in this section, we briefly introduce the liquid circulation system used to generate water lines or films, the experimental setup, and some other experimental considerations.
3.1 Experimental Setup and General Considerations
There are mainly two geometries of liquid flow proposed previously: plane geometry (such as free-flowing liquid films[43] and liquid films created by flat jets[50,51,127–129]) and cylindrical geometry such as liquid lines[130–134]. The advantage of the free-flowing water film, as used in the first demonstration of THz wave generation from liquid water[43], is that the water film can be made less than 20 µm in thickness, depending on the diameter of the metal wires and the distance between them. However, such liquid films are very easily broken when the excitation laser intensity increases. Later, nozzles or jets accompanied with a water pump were used to form liquid films or lines.
Two factors—total internal reflection and the absorption inside the water—may play an important role in the coupling of the emitted THz waves, both of which depend on the geometry of the water flow. The efficiencies of THz wave coupling out of liquid media and the THz wave propagation transfer functions from the emitter to the detector are different between plane and cylindrical flows. However, the mechanism of THz wave generation may be consistent in different liquid flows[135], which means that the THz waves generated from water lines and water films share many characteristics.
In the case of single-color excitation, since the THz emission through the ponderomotive force-induced dipole oscillation essentially follows a lateral emission pattern[134], a common problem that occurs with plane geometry is the relatively low efficiency of THz wave coupling out of liquid media. Particularly, THz waves are strongly absorbed by the flat film of water in lateral directions. The total internal reflection of the THz wave at the flat water–air interface reduces the coupling efficiency of THz signals significantly. To improve the efficiency of THz wave coupling out of water flows, water lines with cylindrical geometry are proposed as the liquid-based THz sources. In the case of two-color excitation, since the THz emission is in the forward direction, flat liquid films are better choices.
In practical terms, water lines with various diameters in a large range, as shown in Fig. 37(a), can be easily obtained using commercially available dispensing nozzles with different inner diameters [Fig. 37(b)], while water films with different thicknesses are not easily attained due to the limitation in the fixed dimensions of nozzles. Stable and smooth surfaces of water lines are seemingly easier to form in comparison with those of water jet films. The schematic of the water circulation system for the generation of water lines is shown in Fig. 37(c). First, water from an open reservoir 1 (R1) is pumped into a sealed reservoir 2 (R2) by a peristaltic pump or other liquid pumps. Then the pressure in R2 squeezes water into the needle, forming a water line. When the pressure in R2 is stable, the flow rate of the water line is determined by the speed of the peristaltic pump. Thus, the flow rate of the water line can be set at different values and kept stable in the experiment. Importantly, the air enclosed in the liquid reservoir R2 can further stabilize the flow rate passively. Such a water circulation system can also be applied to the formation of free-flowing liquid films, simply by sufficiently reducing the flow rate.
Figure 37.(a) Pictures of water lines with diameters of 0.2, 0.6, and 0.8 mm. (b) Industrial dispensing nozzles with different inner diameters. (c) Schematic of the water circulation system used to generate stable water lines.
Regarding the impact of the pre-pulse on the THz wave generation from liquids, there are two feasible ways to reduce such an impact. First, using a lower repetition rate (for example, 10–20 Hz) laser is an effective method to avoid the influence of the pre-pulse. Another way is to increase the flow rate of the water line to make each laser pulse (for a 1-kHz repetition rate, the pulse–pulse separation is 1 ms) interact with a fully refreshed volume in the water line. To avoid the impact of adjacent pump laser pulses, the flow rate of the water line is usually kept at 6–7 mm/ms, ensuring that each optical pump pulse ionizes a completely refreshed water volume. Many previous works on THz wave generation in liquid also used laser pulses with a 1-kHz repetition rate, since the sampling rate is relatively higher than those with 10–20 Hz laser systems. It is noteworthy that the water temperature can affect the efficiency of THz wave generation[51]. Three major approaches are utilized to minimize the impact of laser heating on THz wave generation efficiency: first, a relatively large flow rate of the water line (6–7 mm/ms) is needed to avoid the local heating effect; second, the total volume of water (total heat capacity) in the circulation system needs to be large enough to ensure that the overall heating effect is negligible; and third, a chiller is used to control the water temperature directly at the expense of system complexity[51].
Figure 38(a) shows a typical experimental setup for the generation and detection of THz waves from single-color laser-induced plasma in a water film. A pump pulsed laser beam is focused into a water film or line by a lens with an EFL less than 50 mm, creating plasma and generating THz waves. The choice of the EFL is dependent on the thickness of the water film or the diameter of the water line. The basic selection rule is to have the Rayleigh range of the pump beam much smaller than the thickness or diameter of the liquid sample, ensuring that the plasma is completely included in the liquid water. The generated THz wave is collected and collimated by the first PM. Then the collimated THz beam is focused by the second PM onto a cut ZnTe crystal for EOS of the THz signal. The probe beam is focused by a lens with a longer EFL (typically, 150 mm) through the hole in the second PM to the ZnTe crystal. It is noteworthy that when the liquid water film is used, the optimal laser incident angle for forward THz emission is about 65°. The THz waveform can be flipped over as shown in Fig. 38(b) when the laser beam is incident at opposite angles with respect to the water film.
Figure 38.(a) Typical experimental setup used to generate and detect THz waves from water films. ZnTe, ZnTe crystal. The THz polarizer is optional. (b) Typical THz waveforms emitted from a liquid water film at the pump laser incident angles of . Inset: corresponding spectra of THz waveforms. Figure (b) reprinted with permission from Ref. [127], AIP Publishing.
3.2 Dependence of THz Emission Efficiency on Pump Pulse Duration and Diameter of Water Line
Unlike the case for THz generation from laser-induced gas plasma, the THz wave emission from liquids favors a longer excitation laser pulse duration[43]. To explore the dependence of THz radiation on the optical pulse duration, different laser pulse durations, measured by an SH intensity autocorrelation, are achieved by changing the pre-chirp of the laser pulse (in the experiment, negatively chirped laser pulses are used) while the pump laser pulse energy is kept at 0.4 mJ. The THz amplitude from a 0.2-mm-diameter water line is measured and plotted in Fig. 39(a) as the pulse duration increases from 98 to 590 fs. The THz amplitude increases at first and then decreases with the pulse duration. The optimal pulse duration for THz wave generation from the 0.2-mm-diameter water line is . The trend of the THz amplitude variation with pulse duration agrees with the results in Fig. 40(a), which is ascribed to the cascade ionization in laser-irradiated liquid water[131]. In the theory presented in Ref. [131], tunnel and multiphoton ionization processes provide seed electrons for the cascade ionization process, and it takes a fixed time for each cascade process to finish. Thus, from one seed electron, the cascade process can produce electrons no more than in number. A longer pulse duration enables more cascade processes to take place, leading to higher electron density. However, the laser intensity is inversely proportional to the pulse duration when the pulse energy is fixed. As tunnel ionization highly depends on laser intensity and provides most of the seed electrons for the cascade process, the electron density in plasma starts to decrease when the pulse duration is too long. The trade-off between tunnel and cascade ionization processes leads to the optimal pulse duration for the highest electron density in water, as shown by the red solid line in Fig. 40(a). Since higher electron density in water leads to stronger THz radiation, the optimal pulse duration for THz radiation generation coincides with that for electron generation.
Figure 39.(a) THz amplitude as a function of pump pulse duration for a water line with a diameter of 0.20 mm. (b) Optimal pulse duration for water lines with different diameters. (c) Radiated THz waveforms from water lines with different diameters. (d) Corresponding Fourier transform spectra[133]. Figures reprinted from Ref. [133], Optica.
Figure 40.(a) Dependences of THz energy and peak electron density on optical pulse duration for a 210-μm water line. (b) Optimal optical pulse duration versus the diameter of the water line[131]. Figures reprinted from Ref. [131], SPIE.
Benefiting from the availability of water lines with different diameters, we can systematically investigate the optimal parameters for THz wave generation. A set of nozzles with different inner diameters is used to produce water lines of different diameters. It is noteworthy that the optimal pulse duration is not the same for different diameter water lines. In this experiment, we also negatively chirp initial laser pulses to achieve different pulse durations and measure the optimal pulse duration for each water line using an SH intensity autocorrelator. We plot the optimal pulse duration versus the diameter of the water line in Fig. 39(b). The optimal pulse duration increases with the diameter of the water line, and the variation tends to be flattened for larger diameters of water lines. The result in Figs. 39(a) and 39(b) agrees with the simulation and experimental results shown in Fig. 40[131].
Under the optimal pulse durations for THz emission efficiency from water lines with different diameters, the THz waveforms and their corresponding spectra are different. Figure 39(c) shows THz waveforms radiated from water lines of different diameters. For each water line, the position of the laser focus and the laser pulse duration are optimized individually to acquire the maximal peak THz electric field. It is found that a THz wave generated from a water line with a diameter of about 0.2 mm has the highest peak electric field, and it decreases as the diameter deviates from 0.20 mm. Moreover, an obvious THz pulse peak timing shift and pulse width broadening are observed when the diameter of the water line is increased. Such a pulse peak timing shift is attributed to the expansion of the optical path length as the diameter increases. Figure 39(d) shows the corresponding Fourier transform spectra. A frequency redshift occurs as the diameter of the water line increases, which is consistent with THz pulse broadening. Two facts can be used to interpret the phenomena: first, the generated THz waves experience large optical path lengths in thicker water lines. Since the absorption of liquid water increases with frequency in the range of 0.1 to 10 THz[126], the high-frequency components of THz radiation experience higher absorption in thicker water lines. The higher attenuation of higher-frequency components results in the spectrum redshift in the frequency domain and THz pulse broadening in the time domain. Second, the optimized pump pulse durations for thicker water lines are broader, leading to a longer oscillation period of the ponderomotive force-induced dipole due to the slower varying intensity profile of the laser pulse, which may directly broaden the generated THz pulse.
3.3 Dependence of THz Radiation on Relative Position between Water Line and Laser Beam
It has been experimentally and theoretically demonstrated that for the water film scheme, the optimal incident angle of the laser beam is for forward THz wave emission[127]. Furthermore, THz signals can hardly be detected from any detection angle when the laser beam is normally incident into the water film. The results can be attributed to the orientation of the ponderomotive force-induced dipole, whose moment is oriented along the laser propagating direction. By rotating the water film, the dipole moment is changed since the incident angle of the laser beam is varied, leading to the tuning of the efficiency of THz wave coupling out of the water film. However, even at the optimal incident angle, most of the THz energy cannot be coupled out of the water film due to the total internal reflection at the water–air interface and the absorption of water[127]. In contrast, the water line scheme can significantly reduce the total internal reflection owing to its cylindrical water–air interface, and enables the investigation into the sideway emission of THz radiation[134,136]. Thus, in the case of the water line scheme, the full angular distribution of THz radiation from laser-induced plasma in liquid water can be experimentally revealed. The incident angle of the laser beam is determined by the relative position between the water line and the laser beam axis along the x direction. The optimal relative positions for the maximum collecting efficiency of the THz wave generated from the water line are different for the forward emission scheme and lateral emission scheme. In this subsection, we will particularly introduce the dependence of THz radiation on the relative position between the water line and the laser beam for the forward emission scheme, while the dependence of THz radiation on the relative position between the water line and the laser beam for the lateral emission scheme will be discussed in the next subsection.
For the forward emission scheme, the dependence of THz radiation on the relative position between the water line and the laser beam has already been demonstrated with water lines of different diameters. Figure 41(a) shows the peak THz wave amplitude as the 200-μm-diameter water line is scanned across the laser beam axis along the x direction[130]. When the laser axis is at the center of the water line, virtually no THz pulse can be collected, as shown in Fig. 41(a). As the center of the water line deviates from the laser axis, the THz wave amplitude first increases and then decreases with positive and negative maxima located around μ, respectively. When the focus of the laser beam is outside the water line boundary but very close to the water line surface (μ), a little portion of the laser beam can still ionize the water line. Thus, the THz signal from water can also be detected even though the laser focus does not fall within the water line completely. As the water line moves away from the laser focus, the ionization in water, and thereby the THz radiation, are gradually weakened and eventually vanish, which explains the falling tendency when the focus is outside the water line boundary. The polarity of the THz amplitude is inverted as the position of the water line in the x direction varies from negative to positive. In particular, as the center of the water line oppositely deviates from the laser axis by the same distance, the waveforms of THz radiation are reversed while the absolute values of THz amplitude are nearly identical. Figure 41(b) shows two THz waveforms with inversed polarity in comparison to each other as the laser axis deviates from the center of the water line by and μ. Similar results are obtained when a 260-μm-diameter water line is used, as shown in Figs. 41(c) and 41(d)[131]. In the experiment, a weak THz signal can be detected at μ, which is indicated by the black dot in Fig. 41(c). This coincides with the case when a water film is pumped by a laser beam at normal incidence. When the water line is shifted away from the zero position in the x direction, the THz signal increases, which presents the same trend as that shown in Fig. 41(a). The THz electric field is maximized at μ; however, the THz waveforms have opposite polarities, as shown in Fig. 41(d). The results shown in Figs. 41(c) and 41(d) can be interpreted by the dipole model. Moving the water line along the x direction is essentially equivalent to the change of incident angle of the laser beam by rotating the water film[127]. Mirrored x-positions of the water line lead to the opposite dipole orientation in water, which is similar to rotating the water film with opposite angles, resulting in inverted THz waveforms. When the laser axis is at the center of the water line, the dipole moment in water is oriented along the laser propagation direction, emitting weak THz radiation in the forward direction. However, the shift of the water line along the x direction results in a stronger THz signal in the forward direction because the dipole moment is tilted.
Figure 41.(a), (c) THz peak amplitudes as a function of x-positions for 200- and 260-μm-diameter water lines, respectively[130]. (b), (d) THz waveforms at μ and μ for 200- and 260-μm-diameter water line, respectively[131]. Figures (a) and (b) reprinted with permission from Ref. [130], American Physical Society. Figures (c) and (d) reprinted from Ref. [131], SPIE.
The above experimental results show that the maximal THz amplitude occurs at μ for the 200-μm water line and at μ for the 260-μm water line. For water lines of other diameters, the dependence of THz radiation on the water line position remains the same[132]. Figure 42(a) shows the detected THz peak amplitude as the water line moves along the x axis. In the experiment, the pulse duration is kept consistent for water lines with different diameters. As the water lines of different diameters move along the x axis, the THz amplitudes follow the same trend as that shown in Figs. 41(a) and 41(c). For water lines with diameters of 0.2, 0.3, 0.4, and 0.5 mm, the maximal THz signals appear at , , , and , respectively. The THz waveforms in the time domain at the optimal x-positions for different diameter water lines are plotted in Figs. 42(b)–42(e). When the water line is at positive and negative optimal x-positions, the THz waveforms are inverted. However, as the water line diameter increases from 0.2 to 0.5 mm, the generated THz amplitude decreases, which agrees with the results in Fig. 39(c).
Figure 42.(a) THz peak electric field (amplitude) as a function of x-position for water line diameters of 0.2, 0.3, 0.4, and 0.5 mm, respectively. (b)–(e) THz waveforms at the optimal x-positions for different diameter water lines[132]. Figures reprinted from Ref. [132], Optica.
The results on the optimal water line positions for water lines of different diameters can be fitted linearly, as shown in Fig. 43. An empirical rule concluded from the linear fitting is that the peak values of the THz amplitude will appear at the position , where R is the radius of the water line. In other words, during the optimization of the THz signal, the optimal water line deviation for the highest THz wave coupling efficiency is about 68% of the radius of the water line, independent of the actual diameter of the water line. In this case, the angle of the dipole orientation with respect to the z axis is calculated to be , as the water line is located at the optimal position for any diameter, which is relatively small in comparison with that in the water film at optimal incident angles. Considering that the THz wave mainly emits in directions perpendicular to the dipole moment, a dipole with an orientation angle closer to 90° can contribute a stronger THz wave in the forward direction. It is noteworthy that as the pump beam deviates from the center of the water line, the optical intensity at the focus decreases due to additional astigmatism arising from the cylindrical water line surface. As a result, the overall THz wave generation efficiency might be slightly dropped even though the detected signal is increased. Therefore, we cannot obtain a stronger THz signal by simply increasing the deviation of the pump beam from the center of the water line, although the angle of the dipole orientation increases with it. As the orientation angle of the dipole is only , the strongest THz amplitude cannot be obtained from the forward direction even though the position of the water line is optimized for detection along the forward direction[130,132]. The angular distribution of THz radiation from the water line will be discussed in Section 3.4.
Figure 43.Optimal water line position as a function of the radius of the water line. Solid line: linear fitting of the experimental results.
3.4 Angular Distribution of THz Radiation from Water Lines
Three factors—the dipole orientation, THz reflection, and refraction on the water–air interface—as well as the absorption inside the water line, play important roles in the angular distribution of the emitted THz wave. In this section, we will introduce the angular distribution of the THz wave emitted from the water line as the water line position is optimized for lateral emission and located at the center of the laser beam.
To measure the angular distribution of THz radiation, the collecting optical components and the detector (i.e., the detection system) are all installed on a platform that can be rotated around the water line. The detection system is rotated around the water line from 15° to 165° (limited by the finite space) with respect to the laser beam axis to measure the angular distribution when the THz signal is optimized at a detection angle of 90° (i.e., lateral THz emission is detected). The results on the distribution of THz radiation are shown by the black squares in Fig. 44, indicating that the lateral emission is higher than forward emission, while the highest THz energy can be detected at an angle of about 120° with respect to the laser beam axis.
Figure 44.Angular distributions of THz radiation from the water line when the laser focus is optimized for lateral detection (black squares) and set at the center of the water line (blue triangles). The red arrow points to the laser propagation direction.
However, the THz emission pattern may be distorted by the absorption in liquid water and the refraction on the water–air surface when the water line position is optimized for detection at a certain angle. To give a nearly undistorted THz wave emission pattern from laser-induced plasma in liquid water, the angular distribution of THz radiation is measured when the laser focus is set at the center of the water line. Due to the circular transverse section of the water line, the THz wave emitted from the center has an equal optical path in water and is hardly affected by the refraction on the water–air surface. When laser-induced plasma is formed at the center of the water line, the distribution of the THz radiation emitted from the plasma experiences minimal distortion after THz radiation is coupled out of the water line. The results are plotted as blue triangles in Fig. 44. The maximal THz radiation roughly falls between 120° and 150° with respect to the laser beam axis. Although the THz energy data point measured at 0° is absent in our results, based on the overall trend of angular distribution, we can draw a conclusion that the THz energy measured from lateral directions is larger than that measured in the forward direction.
Unexpectedly, the experimental result does not show a typical dipole emission pattern that has maximal THz radiation at 90° and is symmetrical with 90° as the axis. The discrepancy between the experimental result and the typical dipole emission pattern is probably due to the large absorption coefficient of the THz wave in the laser propagation direction. The velocity of NIR light is higher than the THz wave in liquid water. After the THz wave is generated from laser-induced plasma, the defocused and scattered 800-nm laser pulse propagates in the remaining half of the water line and stimulates electrons from water, leaving a partially ionized zone. The absorption of the THz wave in this zone is higher due to the higher electron density. As a result, more THz wave is absorbed when it propagates through this trace, leading to the asymmetrical dipole-like emission pattern as shown in Fig. 44.
3.5 Pump Pulse Energy Dependence
The pump pulse energy dependence of THz radiation generated from laser-ionized liquid water has been demonstrated using flat and cylindrical water flows. A linear dependence of the emitted THz energy on pump pulse energy was demonstrated from both the free-flowing water film[137] and the water jet[127], as shown in Figs. 45(a) and 45(b). However, the authors believe that a linear dependence rather than a quadratic one is due to plasma position displacement. In a follow-up work, a quasi-quadratic dependence of THz energy on pump pulse energy was reported[50], as Fig. 45(c) shows. For the water line scheme, the linear scaling of the THz field strength (i.e., quadratic scaling of THz energy) with laser energy is verified by experimental and particles-in-cell (PIC) simulation results, shown in Fig. 45(d)[130]. Even though the influence of plasma displacement is noticed in previous works, no effective solution has been demonstrated to reduce its impact, and no experimental result on the saturation effect has been reported in either the water jet scheme or water line scheme.
Figure 45.Dependence of THz energy/intensity on pump pulse energy for (a) water film[137] and (b), (c) liquid jet scheme[50,127]. (d) Dependence of the THz amplitude on pump pulse energy for 0.2-mm diameter water line[130]. Figures (a) and (b) reprinted with permission from Refs. [127,137], AIP Publishing. Figure (c) reprinted from Ref. [50], Optica. Figure (d) reprinted with permission from Ref. [130], American Physical Society.
To investigate the pump pulse energy dependence for the forward emission scheme, a variable neutral density optical filter is used to control the pump laser pulse energy and a water line with a 0.20-mm diameter to generate THz radiation. We first optimize the peak THz electric field by varying the water line position when the initial pump energy is set at 0.4 mJ. The peak THz electric field decreases when we increase incident pulse energy as shown by the red dots in Fig. 46(a). However, when we optimize the peak THz electric field at an initial pump energy of 2.8 mJ, the peak THz electric field decreases when the pump pulse energy is attenuated from 2.8 to 0.4 mJ, as shown by the blue dots in Fig. 46(a). The two pump energy dependences are completely inconsistent. Since in the water line scheme the emitted THz signal is extremely sensitive to the plasma position with respect to the water line[131], the above discrepancy can be attributed to plasma displacement at different pump pulse energies.
Figure 46.(a) Normalized THz peak amplitude versus incident pump pulse energy: red dots represent experimental results when the water line position is optimized at a pump pulse energy of 0.4 mJ, and blue dots show the results when the water line position is optimized at 2.8 mJ. (b) Schematic illustration of the nonlinear focusing effect, indicating that the relative position between the water line and the laser focus varies as the pump pulse energy changes. (c) Blue triangles, THz amplitude versus pump pulse energy; red triangles, maximum blueshift of the pump pulse spectrum versus pump energy, showing that the saturation trends in THz amplitude and the maximum blueshift are consistent with each other. (d) Optimal lens position versus pump pulse energy: blue dots show experimental results, and the red line shows the theoretical fit of the experimental data using self-focusing effect. Figure (a) reprinted from Ref. [133], Optica.
Due to the nonlinear focusing effect (self-focusing and defocusing) of the intense pump laser pulse in both air and liquid water, variable pump pulse energy leads to EFL changes. Figure 46(b) schematically illustrates the shift of the pump laser focus with respect to the water line as the pump pulse energy changes. The yellow solid line defines the pump beam path when the position of the water line is optimized for the highest THz peak amplitude, while the red dashed line represents the optical axis of the laser beam. As the pump pulse energy is decreased, the pump beam focus moves forward along the optical axis. Vice versa, the focal point moves backward along the optical axis. On the other hand, the THz pulse coupled out of the water line is dependent on the relative position between the water line and the pump laser focus (i.e., plasma location). The plasma shift induced by the nonlinear focusing effect has a significant influence on the efficiency of THz radiation coupling out of the water line due to the fact that the THz absorption by liquid water and the refraction on the water–air interface will be different as the position of the plasma changes. The variation trend of the peak THz electric field (amplitude) will be unpredictable if we simply change the pump pulse energy without compensating for the laser focus (plasma) shift by changing the relative position between the water line and the pump laser focus. To achieve the intrinsic pump energy dependence, we intentionally compensate for the laser focus shift induced by the nonlinear focusing effect both in air and inside the liquid water simply by means of moving the focusing lens along the z direction as the pump laser energy changes. In this case, the variation trend of the peak THz electric field as a function of pump pulse energy is independent of the initial pump pulse energy itself. As shown by the blue triangles in Fig. 46(c), the peak THz electric field increases rapidly at lower pump energy and tends to be saturated at higher energy. Different from the linear dependence reported in Ref. [130], a pronounced saturation feature can be observed in the pump energy dependence curve. Such a phenomenon can be attributed to the intensity clamping effect and the subsequent plasma density saturation in liquid water. The intensity clamping effect limits the maximum achievable laser intensity inside the plasma, and consequently, plasma density[138], eventually limiting the generated peak THz electric field (THz peak amplitude).
It is necessary to take a measurement of the laser intensity inside the plasma to experimentally verify that intensity clamping in plasma is the origin of the saturation effect in THz emission efficiency. However, due to the extremely high laser intensity inside plasma, a direct measurement of the intensity distribution in the plasma is very challenging. Suggested by the work done by Weiwei Liu in S. L. Chin’s group, an alternative way to indirectly determine relative intensity inside the plasma can be achieved by measuring the pump pulse spectral broadening[139]. In this work, the spectrum broadening of a laser pulse interacting with liquid water can be written as where represents the temporal profile of the laser pulse, and is the peak power intensity. The first term on the right side of the equation represents the frequency shift arising from the nonlinear index of refraction in water, and the second term is associated with plasma generation via multiphoton excitation ( for 1.55 eV photon energy), which results in a blueshift of the entire spectrum only. Thus, the frequency blueshift is dominated by the second term when the peak intensity is sufficiently high. Therefore, the frequency blueshift is directly in correlation with the peak intensity: . Since mainly depends on the peak power intensity, the saturation of emerges when the peak power intensity inside plasma gets saturated. The liquid water absorption near 800 nm can be neglected and does not affect the spectrum broadening as long as the diameter of the water line is sufficiently small due to the fact that the liquid water absorbance around 800 nm is far less than 0.1 cm−1[140]. Thus, the saturation of at high laser pulse energies can be used as evidence of the saturation in the peak power intensity in the plasma. To experimentally verify the saturation of the peak power intensity inside the plasma, a fiber-coupled spectrometer (Ocean Optics USB2000+) is employed to monitor the pump pulse spectrum in the liquid water as the pump pulse energy is increased. The spectrum of the pump laser pulse is measured in the direction perpendicular to that of the laser propagation. A short-pass optical filter is used in the beam path to eliminate the optical components with wavelengths longer than , and a coupling lens is used to collect the diverging laser beam into the fiber probe of the spectrometer. When the water line position is optimized for the maximum THz peak amplitude at each pump laser pulse energy level, the spectrum of the laser pulse, after creating plasma in the water line, is then recorded. Saturation of the spectral broadening as the pump pulse energy increases can be observed at the high-frequency side of the pump pulse spectrum. As shown by the red triangles in Fig. 46(c), increases rapidly at lower pump laser energy and gets saturated at higher laser energy. The saturation trend in the maximal blueshift agrees well with that in the THz amplitude, which further verifies that intensity clamping is the dominant mechanism for the saturation of THz peak amplitude.
To quantitatively evaluate the impact of the nonlinear focusing effect on the focus displacement of the pump laser pulse, the position of the focusing lens is recorded after compensating for the focus displacement under various pump energies for the water line with a 0.20-mm diameter. The recorded positions of the lens at different pulse energies are shown by the blue dots in Fig. 46(d). A simplified simulation on the focus displacement induced by the nonlinear focusing effect is carried out. In the simulation, the lens positions along the z axis are traced while the focus of the laser beam (i.e., plasma position) in the water line for different pump laser pulse energies is kept fixed. The equation used to trace the beam propagation is where and are the intermediate and initial beam radii, respectively, is the peak power of the laser pulse, is the critical power for the self-focusing effect, is the pump pulse propagation distance along the z axis, and is the wave vector. Since both the critical power and wave vector are different in liquid water and air, the simulation is carried out in two steps. First, the laser focus in water is kept constant, and the beam radius is traced back to the incident plane. Then the beam parameters at the incident plane are used to trace the beam back to the focusing lens, and thereby, the lens positions at different pump energies can be determined. The red line in Fig. 46(d) shows the simulation results, and the blue dots indicate the experimental results. The simulation roughly agrees with the experimental results. Under the optimal pump pulse duration for a 0.20-mm-diameter water line, the critical energy for self-focusing in air is , while the one in water is about three orders of magnitude smaller.
It is noteworthy that the saturating pulse energies are different for water lines of different diameters. The saturating pump pulse energy increases as the water line diameter increases, as indicated by the vertical dashed lines in Fig. 47. The saturating pump pulse energy is about 0.4 mJ for 0.11 mm-, 0.8 mJ for 0.20 mm-, and 1.0 mJ for 0.39-mm-diameter water lines. The pump energy dependence of water lines with different diameters was also measured with their corresponding pulse durations optimized individually, and results are shown in Fig. 40(b). The optimal pulse duration is longer for a water line of a larger diameter. Since the saturation effect is attributed to intensity clamping, the increase in saturating pulse energy is partially associated with the increased optimal pulse durations as the intensity decreases with pulse duration for a fixed pulse energy.
Figure 47.Pump pulse energy dependence of THz amplitude for water lines with 0.11-, 0.20-, and 0.39-mm diameters[133]. Figure reprinted from Ref. [133], Optica.
The emitted THz pulse energy and the optical-to-THz conversion efficiency are limited by the saturation of THz amplitude when pump pulse energy is higher than the saturating pulse energy. The THz pulse generated from laser-ionized liquid water is always accompanied by incoherent IR radiation. In this case, both the incoherent components and coherent THz pulses will be detected by incoherent measurements (such as the Golay cell), leading to the overestimation of THz pulse energy. But these incoherent components cannot be detected by EOS. We have tried to measure the THz energy using a Golay cell (Tydex). When only two slices of high-resistivity Si wafers are used as filters, the signal from the Golay cell is relatively large. However, after carefully filtering out the IR components, the signal from the Golay cell is under the noise level. This phenomenon reveals that most of the signal detected by the Golay cell is the IR components. To give an approximate estimate of the coherent THz energy, we compare the THz signal from single-color laser-ionized liquid water with the one from two-color laser-induced air plasma using EOS measurement. The 1.7-mJ energy 800-nm central wavelength laser pulses with 100-fs pulse duration are used in the two-color THz generation scheme. A 100-μm-thick is used to generate the SHs, and then the two-color pulses are focused by a 2-inch EFL PM. The THz pulse energy from the above two-color THz generation setup is on the sub-μJ scale, and the conversion efficiency of the two-color scheme is about . As Fig. 48 shows, the peak electric field of the THz pulse from two-color air plasma is 25-times higher than that from single-color laser-ionized water, and so the THz pulse energy is about 660-times larger. By a comparison of EOS signals, we believe the THz pulse energy we detected from laser-ionized liquid water in the forward direction is on the sub-nJ scale. The laser energy we use to generate the THz signal from the water line is 0.8 mJ. As a result, the conversion efficiency from NIR to THz of laser-ionized water can be calculated to be on the scale. However, the THz generation saturation effect in ionized water reduces the conversion efficiency from NIR to THz. Moreover, the directionality of THz emission from ionized water is significantly worse than that of the two-color scheme. Only about one-tenth of THz energy is collected in our experiment, leading to underestimation of THz energy and consequently conversion efficiency. Overall, we believe the total conversion efficiency of the THz wave generated from laser-ionized liquid water should be on the scale. Different approaches, such as asymmetrical field excitation[141] and a double-pump technique[142–144], have been proposed to improve the optical-to-THz conversion efficiency at the cost of system complexity. In addition, collecting sideways THz wave emission from laser-induced plasma in water lines can significantly improve the overall collection efficiency, thereby increasing the optical-to-THz conversion efficiency without increasing the complexity of the optical setup. With these approaches, there is a possibility to increase the conversion efficiency to the order of .
Figure 48.A comparison between THz waveforms from water line (blue line) and two-color laser-induced air plasma (purple line).
3.6 THz Wave Generation from Liquid Water Films under Excitation of Asymmetric Laser Fields
Similar to the THz wave generation from two-color laser-induced plasma in gases, coherent THz waves can also be generated from liquids under excitation of two-color asymmetric laser fields[145]. In the experiment, an in-line PC is utilized to control the relative phase between the two-color laser pulses, as shown in Fig. 49. A free-flowing water film with a thickness of about 120 µm is used. The choice of a 25.4 mm EFL PM is to guarantee that the Rayleigh range of the focused laser beam is located within the water film and no plasma in the air is formed. Results have shown that, compared to single-color excitation, a one-order of magnitude enhanced THz electric field can be achieved by using two-color excitation with the same total excitation pulse energy and focusing geometry. However, further enhancement in the THz peak electric field is limited by the dispersion of liquid water, which causes phase slipping between and pulses to be over as the length of the interaction between laser pulses and water increases. Therefore, other liquids with low dispersion are better choices to significantly increase the THz electric field generated by two-color laser fields.
Figure 49.Schematic illustration of the experimental setup. An in-line phase compensator (IPC) is utilized to control the relative phase between the two-color laser pulses to synthesize asymmetric fields for maximal THz wave generation. DWP, dual-wavelength wave plate; PM, parabolic mirror with an effective focal length of 1-inch.
Coherent control of the THz radiation from liquid water can be achieved. Shown in Fig. 50(a) is a phase curve obtained by scanning the relative phase between the two laser pulses while monitoring the generated THz wave energy with a Golay cell. One can see that when the relative phase is changed by , the THz waveform can be flipped over, as shown in Fig. 50(b). It is interesting that modulated and unmodulated THz energies have, respectively, quadratic and linear dependence on the laser pulse energy, as shown in Fig. 51. The unmodulated component is stronger with lower excitation pulse energy, while the modulated component will dominate if intense laser pulses are used. Maximal pump pulse energy is limited by the breakdown of the free-flowing water film. As discussed above, when the pump energy is too high, the water film between the two metal wires discontinues.
Figure 50.Coherent control of THz radiation from a liquid water film. (a) Phase curve for THz radiation from the water film achieved by changing the relative phase between the two-color ( and ) laser pulses while monitoring the THz energy. (b) THz waveforms obtained by changing the relative phase between and pulses by . Inset: peak THz electric field as a function of the phase delay between and pulses. Figures reprinted with permission from Ref. [145], AIP Publishing.
Figure 51.Normalized THz energy generated from the liquid water film versus total pump laser pulse () energy. Blue square shows the THz energy calculated from the temporal integral of the THz waveform measured by means of EO sampling. Blue dot represents the modulated THz energy. Red circle indicates unmodulated THz energy measured. Dashed lines are fitting curves. The maximal pump pulse energy is limited by the breakdown of the free-flowing water film. Figure reprinted with permission from Ref. [145], AIP Publishing.
3.7 THz Wave Generation from Liquid Water Excited by Double Pulses
It has been found that using a pre-pulse to generate a pre-existing laser plasma (preformed plasma) in liquid water, the generated THz wave can be significantly enhanced, first reported by Xi-Cheng Zhang’s group using a water line[137], and then by Anton N. Tcypkin’s group using a water film as the THz emitter[143,144]. Figure 52 shows the experimental scheme utilized to generate THz waves from preformed plasma in liquid water. In Fig. 52, the first pump pulse (pre-pump) is used to generate a preformed plasma in a water line, and then the second pump pulse (main pump) is applied to the plasma to generate THz waves. A variable delay line (not shown in the figure) is used to control the time delay between the pre-pump and main pump Δτ. The emitted THz wave is detected with EOS with a 1-mm-thick ZnTe crystal.
Figure 52.Schematic illustration of the experimental scheme used to generate THz waves from liquid water pumped by double pulses. is the time delay between the two pump pulses.
To clarify the effect of a preformed plasma on THz wave generation from liquids, a pump–probe measurement is carried out when the polarizations of two linearly polarized optical pump pulses are parallel and orthogonal to each other. The pump–probe traces are obtained by changing the time delay between the two laser pulses while monitoring the peak THz electric field generated by the main pump pulse (second pulse on the left in Fig. 52). Figure 53(a) shows the results on the pump–probe measurement. One can see that, in both cases, the peak THz electric field drops right at the beginning of the formation of the pre-plasma and then is quickly enhanced. Finally, the peak THz electric field is decreased when the pump–probe time delay reaches certain values on the tens of picoseconds scale. When the pre- and main pump pulses are orthogonally polarized (s-polarized pre-pump and p-polarized main pump), the enhancement of the generated THz wave is nearly twofold that when the two pulses share the same polarization (here, both p polarized). Figures 53(b) and 53(c) show the effects in the two cases (p- and s-polarized pre-pump with s-polarized main pump) at two specific time delays and 6.8 ps, respectively, in comparison with the THz waveforms generated by individual pump pulses.
Figure 53.(a) Experimental results on the pump–probe measurement. The peak timing of the trace of SHG intensity autocorrelation between the pre- and main pumps defines the “zero delay” between the two laser pulses. (b) THz signals generated either by the p-polarized pre-pump or main pump individually are plotted as the top and middle lines. The bottom line shows the THz waveform generated by two pulses with a time delay . (c) Similar results are plotted when the pre-pump is s-polarized at a time delay . Obviously, the enhancement is higher than that shown in (b). All THz waveforms are normalized to peak THz electric field obtained by the p-polarized main pump solely. Figures reprinted with permission from Ref. [137], AIP Publishing.
Furthermore, with the pump of double pulses, spatial–temporal control of THz emission from a liquid water film was recently reported[63]. In the demonstration, the polarization of THz emission from a tilted water flow with a thickness of micrometers can be finely tuned by changing the spatial–temporal offset between the two cross-linearly polarized femtosecond pump pulses. In particular, when the optimized horizontal offset between the two 8-μm focal spots is about 11 µm and time delay between the two pump pulses is 4.7 ns, circularly polarized THz radiation can be achieved with its intensity enhanced by a factor of more than 1500 compared with that under single-pulse excitation. It is shown that the optical-to-THz quantum efficiency reaches when the spatial–temporal characteristics of the two pump laser pulses are properly optimized. Polarization-resolved THz-TDS and time-resolved shadowgraphy imaging reveal that circularly polarized THz emission originates from the focal volume in front of the water flow. Coupling between a shockwave due to air-breakdown and water-ablation-mediated mass transport by the pre-pulse with a laser wakefield along the optical path of the main pulse is responsible for the point-like single-cycle THz emission.
To date, the mechanism of the effects of THz emission enhancement by the double-pump scheme is not very clear yet. The approach provides an alternative way to the further enhancement of THz wave generation from laser-induced plasma.
3.8 Lateral THz Wave Emission from Laser-Induced Plasma in Liquid Water
It has been proved that the lateral detection scheme is more efficient than the forward scheme[134,136]. It is necessary to introduce the impact of the relative position between the water line and the laser axis on THz wave collection efficiency for the lateral scheme. Since THz radiation is very sensitive to the relative position between the water line and the laser beam axis, an experiment on the impact of the relative position on THz radiation is carried out to characterize the lateral THz emission[134]. A water line with a diameter of about 110 µm is scanned across the laser beam axis along the x axis step by step while a THz waveform is measured for each step. The dependence of THz energy on the water line displacement along the x direction is measured at the detection angle of 90° with respect to the laser axis. The result shows one peak on each side with respect to the origin, as shown in Fig. 54(a). For clarity, signal A is defined as the THz signal peaked in and signal B as that peaked in , with their peak positions as A (μ) and B (μ). The “two peaks” trend in Fig. 54(a) is seemingly counterintuitive. The THz signal generated from the area was supposed to be lower than that from the other side, since it has a longer optical path in water leading to stronger water absorption, as shown in Fig. 54(b). However, the experimental result shows that the THz energy of signal B is higher than that of signal A. To give a full picture of the THz signal change, consecutive THz waveforms are measured at the detection angle of 90° when the water line is scanned along the x direction from to 80 µm with a 10-μm step size, as shown in Fig. 54(c). Fourier transform spectra of some selected THz waveforms are plotted in Fig. 54(d). Different from the forward scheme, the polarity of the THz wave does not change in sign, and the absolute values of THz amplitude are not identical for water line positions symmetric about the origin. When the water line moves from the region toward the region, the overall THz pulse width becomes broader and THz peak amplitude gets higher. Therefore, the bandwidths of the Fourier transform spectra in the region are broader than those in the region. The counterintuitive “two peaks” feature in the THz energy variation and the change in the THz pulse width are attributed to the trade-off between THz absorption in liquid water and THz collection efficiency.
Figure 54.(a) Dependence of THz energy on the water line position along the x direction measured at 90°. Vertical dashed lines represent the boundary of the water line. (b) Schematic of THz wave propagation in the water line. (c) Variation of the measured THz waveform as the water line position changes. (d) Fourier transform spectra of THz waveforms measured at different water line positions along the x direction[134]. Figures reprinted with permission from Ref. [134], AIP Publishing.
In the THz range, the liquid water absorption coefficient exhibits serious frequency dependence. The absorption coefficient increases with frequency from 0.1 to 3.0 THz[126], leading to a narrower spectral bandwidth for a longer THz optical path in liquid water. As a comparison, the THz waveforms and their spectra of signal A and signal B are shown in Figs. 54(c) and 54(d), respectively. The THz spectral narrowing as the water line scans from negative to positive positions can be interpreted by the frequency-dependent absorption coefficient. However, the high attenuation for the high-frequency components and the increase in the THz peak amplitude of signal B are completely inconsistent with each other. Nevertheless, the collection efficiency of the emitted THz radiation coupling out of the liquid medium should also be considered. In fact, the collection efficiency is highly dependent on the diverging angle of the THz beam due to the limited collection angle of the PM (about 19°) used in the current experimental setup. The impact of the cylindrical geometry on the divergence angle of the emitted THz beam along with the THz absorption in liquid water can be used to interpret the experimental results observed above. As sketched in Fig. 54(b), in the region, the cylindrical water surface can be treated as a negative cylindrical lens, and therefore, the generated THz radiation is diverged by the cylindrical water surface, leading to low collection efficiency and subsequently a low detectable THz peak amplitude. As the water line moves toward the origin from the region, the THz beam divergence angle decreases, resulting in higher collection efficiency. When the water line moves toward the origin, the THz optical path length in the water increases, leading to higher total attenuation of the emitted THz radiation due to the increased absorption of the THz wave in liquid water. The trade-off between THz attenuation in water and the collection efficiency of the THz radiation coupling out of the water line results in an optimal water line position for the highest detected THz energy in the region, corresponding to the water line position of signal A. On the other hand, the surface of the water line can be treated as a positive cylindrical hyper-hemispherical lens in the region. The emitted THz radiation is converged or even partially collimated by the hyper-hemispherical surface. The divergence angle of THz radiation decreases when the water line moves toward the positive direction. Similarly, the trade-off between the liquid water absorption of THz radiation and collection efficiency determines the optimal water line position for the highest THz signal in the region, i.e., signal B in Fig. 54(a). Moreover, the refractive index of liquid water in the THz frequency range is also frequency dependent. The index of refraction decreases with the frequency from 0.1 to 3.0 THz while it remains over two in the 0.1–1.5 THz range[126]. The divergence angles of different THz frequency components are directly dependent on the refractive index of liquid water. The divergence angles of the low-frequency components are smaller than those of high-frequency components in the region and vice versa in the region, due to the abnormal dispersion of liquid water in the THz range. Since the THz radiation collecting angle of the PM in the system is relatively small, only the THz radiation with a divergence angle within can be collected and collimated by the PM. In such a case, the collection efficiencies of different THz frequency components are different when the water line position is fixed. That is to say, the optimal water line positions for different frequency components are different. For example, a blueshift in the THz spectrum is observed when the water line position increases from to μ, as shown in Fig. 54(d). The observation is associated with the abnormal dispersion of liquid water in the 0.1–3.0 THz range. The refractive indices of low-frequency components (0.1–0.7 THz) are relatively high, resulting in smaller divergence angles for these frequency components in the region and consequently smaller optimal water line displacements in the x direction, whereas at the optimal water line position for a low-frequency component, the divergence angle of a high-frequency component deviates from the optimal collection efficiency. However, when the water line gradually moves toward the negative direction, where the cylindrical interface between liquid water and air can be treated as a negative cylindrical lens, the collection efficiency of high-frequency components increases, leading to the increase in detected THz radiation at high frequencies, in comparison with that at lower frequencies in the whole spectrum. Thus, the observation in the waveform variation shown in Fig. 54(c) and the difference in the THz spectrum shown in Fig. 54(d) can be explained.
A similar trend can be observed in the experiment using the 0.21-mm-diameter water line[136]. Figure 55(a) shows the overall variation of the THz waveform when the water line moves along the x axis in a 2D manner. The consecutive waveform variation shown in Fig. 55(a) agrees with that in Fig. 55(c). The dependence of THz pulse energy on the x-position is plotted in Fig. 55(b), which shows a similar “two peaks” trend. Furthermore, Fig. 55(c) shows the dependence of the THz waveform on the z-position of the water line. The corresponding THz pulse energy variation is shown in Fig. 55(d). When the water line is scanned along the z axis, the THz waveform experiences a temporal shift that almost linearly increases with the water line displacement. The temporal shift originates from the change in optical path length caused by the variation in the relative position of the laser-induced plasma with respect to the center of the water line. However, the total range that the water line can move along the z direction before the THz signal vanishes exceeds 600 µm, which is significantly longer than the diameter of the water line itself (210 µm). Such a phenomenon can be mainly attributed to the combined effect of the nonlinear propagation of the optical pump pulse along the laser beam path and the geometrical focusing of the cylindrical surface of the water line. The combined effect makes one laser focusing point (generating relatively stronger plasma) be sustained inside the water line in a wider range of the relative position between the laser beam and water line, while another focal point that generates a weaker plasma remains in the air when the relative position is sufficiently long.
Figure 55.Dependence of THz wave electric field on (a) x- and (c) z-positions of water line. The color bar represents the THz wave amplitude. Corresponding THz energy dependence on (b) x- and (d) z-positions of water line[136]. Figures reprinted with permission from Ref. [136], IEEE.
Based on the above analysis, the “two peaks” feature in the THz energy and waveform variations can be interpreted as the combined influence of liquid water absorption at THz frequencies, refraction on the cylindrical water–air interface, and the abnormal dispersion in liquid water at frequencies from 0.1 to 3.0 THz. The cylindrical hyper-hemispherical water surface can further enhance the collection efficiency by converging the generated THz wave in the lateral direction, resulting in a 4.4-fold enhancement in THz energy, in comparison with the case of forward emission with a 110-μm water line[134]. Furthermore, the converging effect resulting from a cylindrical hyper-hemispherical water–air interface occurs in all water lines regardless of their diameters. Similar experiments using different water lines are performed, and the results are shown in Fig. 56. The abscissa (R, radius of the water line) is a dimensionless parameter to describe the displacement of water lines along the x direction. The “two peaks” feature can be observed in all results using water lines with different diameters. However, the peak THz energy value in the region is lower in comparison to that in the region for water lines with larger diameters due to the fact that the absorption of THz radiation in liquid water increases as the diameter of the water line increases. The variation of the peak THz energy value when using different water lines verifies our qualitative explanation of the trade-off between THz absorption in water and the divergence angle (therefore, collection efficiency) of the THz wave. The above experimental results and interpretation imply that the cost for the convergence effect is the increase in the THz optical path in a liquid medium. In liquid water, the attenuation of THz radiation due to liquid water absorption makes the enhancement induced through the converging effect much less pronounced. Therefore, the enhancement through the convergence effect of the cylindrical water–air interface is more remarkable for thinner water lines. It is expected that by using other liquids with lower absorption coefficients in the THz frequency range, the enhancement can be even more remarkable.
Figure 56.Dependence of THz energy (normalized to the maximal value for each curve) on the displacement of water lines with different diameters when THz radiation is measured at a detection angle of 90°. X and R represent displacement along the x direction and the radius of the water line, respectively[134]. Figures reprinted with permission from Ref. [134], AIP Publishing.
3.9 Scaling of THz Emission from Liquid Water Lines by Plasma Reshaping
In this section, we introduce in detail a simple feasible approach to the enhancement of the coupling efficiency and reduction of the saturation effect of THz radiation emitted from a liquid water line.
As concluded above, there are essentially two factors, including collection efficiency and the saturation of THz emission, limiting the improvement of water-based THz sources especially in the case of single-color excitation. Both are associated with the shape and size of the plasma in water. Previous theoretical works indicated that THz radiation originates from ponderomotive force-induced dipoles in plasma with their moments oriented along the laser propagation direction[50,127,135]. For a typical dipole source, the normalized radiation pattern can be expressed as , where is the directional emission angle with respect to the dipole moment, and is the azimuthal emission angle[146]. The above equation shows that the radiation pattern of a typical dipole source is independent of the azimuthal angle. The electric field distribution of a point dipole source is illustrated in Fig. 57(a), where the yellow dot represents the dipole point with the moment perpendicular to the page (along the z axis). When the THz source with such a dipole-like radiation pattern is located in water films or water lines flowing along the y axis, as indicated by the transparent column in Fig. 57(a), the upward and downward THz wave radiation will be completely absorbed by liquid water. Only the THz radiation with an azimuthal emission angle less than the critical angle of total internal reflection can be efficiently coupled out of the water flow. Therefore, most of the THz radiation energy is dissipated in the water medium due to the absorption of water and the total internal reflection at the water–air interface. However, such an ideal point dipole source exists only in theory when the size of the dipole is far less than the wavelength of the radiation, i.e., . When the size of the radiation source is comparable to the wavelength, the interference of the electromagnetic waves emitted from different locations of the source will change its original radiation pattern. By manipulating both the shape and size of the THz radiation source, one can concentrate and redirect the radiation energy to certain emission directions, leading to a significant increase of coupling efficiency of THz radiation and consequently the increase in collection efficiency of total THz energy.
Figure 57.(a)–(e) Electric field emission patterns of the dipole array of lengths , , , , and , respectively, obtained by numerical simulation. The transparent cylindrical column in (a) represents the position of the water line flowing along the axis.
To give a clear picture of the deformation of the radiation pattern, a simplified simulation based on the interference of a 1D dipole array in free space is performed. In the simulation, the dipole array is arranged in a straight line along the y axis while the moment of each dipole in the array is oriented perpendicular to the page. The length of the dipole array varies from to stepwise with a step size of , as shown by the yellow dots in Figs. 57(b)–57(e). The electric field emitted from each dipole array is normalized to its maximum for comparison. In Figs. 57(b)–57(e), one can see that the radiation energy is concentrated more in the direction along the x axis as the length of the dipole array (i.e., number of dipoles) increases. This result implies that the THz radiation generated from plasma in water with a line-like transverse section can be coupled out of the water medium more efficiently since the interference of dipoles in different locations of the plasma can concentrate and redirect the THz energy to sideways directions.
Different approaches can be used to manipulate the shape of laser-induced plasma in water. Practically, the utilization of a spatial light modulator (SLM) is a good option for the manipulation of plasma in water to get higher THz wave coupling efficiency. However, limited by the low damage threshold of a regular SLM (typically, 0.3-mJ, 100-fs laser pulses at 1-kHz repetition rate could damage the SLM), pump pulse energy cannot be very high, therefore limiting the total emitted THz pulse energy. Alternatively, a practical and simple approach to obtaining plasma with a line-like transverse section is to focus the laser beam into the water using a pair of cylindrical lenses (C-lens) rather a spherical lens, as shown in Fig. 58(a). Cylindrical lens L1 has a shorter EFL and is oriented vertically. In contrast, L2 has a longer EFL, while it is oriented horizontally. L1 and L2 are installed on a translation stage (stage 1), which can move along the z axis to compensate for the nonlinear-focusing effect when the laser pulse energy changes. Furthermore, the relative position between L1 and L2 can be adjusted by another translation stage (stage 2) ridden on stage 1. Such a cylindrical lens pair can focus the laser beam into a spot with an elliptical cross section, whose ellipticity (defined here as the ratio between the minor axis and major axis of the ellipse) can be manipulated by changing the relative position between L1 and L2 along the z axis. When the ellipticity of the focal spot is sufficiently small, the plasma formed by the laser in water has an approximately line-like transverse section. Figures 58(b) and 58(c) show side and top views of the laser beam focused by the cylindrical lens pair, respectively. In the case of L1 and L2 being confocal, the focal spot size reaches its minimum. When L1 and L2 are not confocal, two beam waists can be observed from the side and top views of the focused laser beam. Considering the geometrical focusing of L1 and L2, the deviation () of the focal plane between L1 and L2 approximately equals the displacement of L2 from the confocal position as L1 is fixed. The size of the focal spot at the geometrical focal plane of L1 increases linearly with , while the ellipticity of the focal spot decreases with it. By adjusting the position of L2 along the z axis, focal spots with variable ellipticity can be obtained. It is noteworthy that the cylindrical surface of the water line can also change the size and ellipticity of the pump beam geometrical focal spot. However, such a change may be partially compensated for by changing the deviation .
Figure 58.(a) Experimental setup for increasing the coupling efficiency and reducing the saturation effect. PM, parabolic mirror; Si, high-resistivity float-zone silicon wafer; EOS, electro-optic sampling. (b) Side and (c) top views of the laser beam focused by a cylindrical lens pair. F1, F2, EFLs of L1 or L2, respectively; , distance between the geometrical focal planes of L1 and L2.
In the experiment[147], laser pulses are delivered by a commercial femtosecond Ti:sapphire amplified system working at 800-nm central wavelength and 1-kHz repetition rate. Negatively chirped pulses with pulse duration are obtained by pre-chirping the original 100-fs laser pulses to maximize THz radiation. A laser beam with a diameter of about 8 mm is focused by the cylindrical lens pair into a 0.4-mm-diameter water line formed by a commercial dispensing nozzle located at the focal plane closer to L1 to form an elliptical plasma with its major axis along the axis in water. Driven by a digital peristaltic pump, deionized distilled water is ejected out of the nozzle at a flow rate of . The position of the water line is optimized for the highest THz peak amplitude. Owing to the scattering of the plasma in liquid water and the refraction of the water line surface, ionization will not occur at the second focal plane. The THz radiation emitted from the water line is collected by PM1 in the direction perpendicular to z axis. The coherent THz radiation is detected by EOS with a 1-mm-thick, cut ZnTe crystal after the residual pump light is filtered out by a high-resistivity float-zone Si wafer.
It is demonstrated in Section 3.5 that THz emission is saturated under high pump pulse energy due to the intensity clamping effect in water[133]. Nevertheless, the intensity clamping effect is associated with the focusing geometry. When the laser beam is focused by a spherical lens (S-lens), the saturation trends of THz emission occur under different NAs, as shown in Fig. 59(a). The THz energy and the NIR-to-THz conversion efficiency are limited mainly by the saturation effect when an S-lens is used, leading to an upper limit of the THz signal collected from the water line. However, as mentioned above, when a pair of C-lenses is alternatively used, the shape and size of the focal spot can be manipulated by adjusting the relative position between L1 and L2 along the z axis. In a tight focusing condition, the size of the focal spot increases linearly with . Therefore, the laser intensity at the focal spot can be kept below the saturation point by increasing the size of the focal spot under high pump laser pulse energy, while the total THz energy emitted from the plasma is increased. In this case, the transverse section of laser-induced plasma is an ellipse with the major axis along the y axis. Furthermore, THz emission in the detection direction is enhanced by the constructive interference of dipoles located at different positions along the plasma as demonstrated in Figs. 57(b)–57(e). As a result, the peak THz amplitude generated from the laser beam focused by a 2-in. and 4-in. EFL C-lens pair is 2.5-times that by a 2-in. S-lens under 1.7-mJ laser pulse energy, as shown in Fig. 59(b). It is noteworthy that is independently optimized for the highest THz amplitude under different laser pulse energies by adjusting the positions of L1 and L2. When the positions of L1 and L2 are optimized under 0.2-mJ pulse energy, THz emission is also saturated as the laser energy increases, as the red dots in Fig. 59(c) show. In contrast, when the positions of L1 and L2 are optimized under 1.7-mJ pulse energy, the detected THz energy decreases rapidly with the laser pulse energy and can hardly be detected when the pulse energy is below 0.6 mJ, as shown by the black squares in Fig. 59(c). These conflicting results reveal that the positions of L1 and L2 should be optimized independently for each laser pulse energy.
Figure 59.(a) Dependence of the emitted THz energy on the laser pulse energy as a laser beam is focused by S-lens with different NAs. (b) Waveforms of THz radiation when the pump laser beam is focused by 2-in. EFL S-lens and 2-in. + 4-in. EFL C-lens pair, for comparison. (c) Dependence of the emitted THz energy on the laser pulse energy as Δz is optimized at 1.7 and 0.2 mJ, showing significant discrepancy. (d) Optimized as a function of laser pulse energy. (e) Dependence of the THz energy on the laser pulse energy in the case of 2-in. EFL S-lens, 2-in. + 4-in. EFL C-lens pair, or 1-in. +2-in. EFL C-lens pair. (f) Normalized optical-to-THz efficiency as a function of laser pulse energy using different focusing schemes. Figures reprinted from Ref. [147], Optica.
To give a clear picture of the optimization of the positions of L1 and L2, their positions are recorded by reading the micrometers on stage 1 and stage 2 after optimizing for different pulse energies and roughly calculating through the geometrical focusing model as Fig. 59(d) shows. When the laser pulse energy is 0.1 mJ, the optimal is close to zero, which means L1 and L2 are approximately confocal and the size of the focal spot is the smallest. When the laser pulse energy is low, a smaller focal spot size is necessary to obtain sufficient laser intensity higher than the ionization threshold to generate THz radiation from plasma in water. The optimal for the highest THz amplitude increases with laser pulse energy, which can be fitted linearly as shown by the black solid line in Fig. 59(d). As the laser pulse energy reaches 1.7 mJ, the optimal for the highest THz amplitude is , which means the major axis of the focal spot is , calculated through the geometrical focusing model. However, considering the nonlinear-focusing effect, the length of the transverse section of laser-induced plasma in water may not be so long. The THz energies measured as optimized for different laser pulse energies are shown by the blue dots in Fig. 59(e). The dependence of THz energy on laser pulse energy can be fitted by a quadratic function shown by the blue solid curve. The quadratic trend of the collected THz energy can be attributed to the combined effect of the constructive interference of the line-like THz source in the detection direction and the increase of total emitted THz energy with laser pulse energy, as the impact of the intensity clamping effect in water is weakened by the enlarged focal spot.
A comparison between the trends of THz energy as a function of laser pulse energy using the S-lens and C-lens pair focusing schemes is shown in Fig. 59(e). When the laser pulse energy is below 0.6 mJ, the THz energy generated from the laser beam focused by a 2-in. EFL S-lens is higher than that by the C-lens pair. Since the focal spot size of the 2-in. EFL S-lens is smaller than that of the C-lens pair, the laser intensity in plasma in the case of the 2-in. EFL S-lens is higher, contributing to the higher THz energy even at low laser pulse energies. However, when laser pulse energy exceeds the saturation point, the intensity in plasma will not increase with laser pulse energy due to the intense clamping effect in the case of the 2-in. EFL S-lens, leading to the saturation trend of THz energy at high laser pulse energies. Therefore, the detected THz energy of the C-lens pair scheme eventually exceeds that of the S-lens scheme, since it increases quadratically with laser pulse energy. The measured THz energy in the case of the 2-in. and 4-in. EFL C-lens pair is five times that of the 2-in. EFL S-lens at 1.7-mJ laser pulse energy. The THz energies generated from the laser beam focused by the 1-in. and 2-in. EFL C-lens pair under different laser pulse energies are measured, as shown by the green triangles in Fig. 59(e). In this case, THz energy also increases quadratically with laser pulse energy and finally exceeds that in the case of the 2-in. EFL S-lens when laser pulse energy is higher than 1.4 mJ. However, THz energy in the case of the 1-in. and 2-in. EFL C-lens pair is much smaller than that of the 2-in. and 4-in. EFL C-lens pair, which might be associated with the additional astigmatism and imperfect alignment of such short EFL cylindrical lenses (alignment of a lens pair with shorter focal lengths is much more difficult). The normalized optical-to-THz conversion efficiencies shown in Fig. 59(f) provide another perspective for the comparison between the C-lens and S-lens schemes. For the THz wave generated from the laser beam focused by the 2-in. EFL S-lens, the optical-to-THz conversion efficiency increases rapidly as the plasma in water begins to build up, and then decreases with pump pulse energy due to the saturation of THz emission. In contrast, in the case of the 2-in. and 4-in. EFL C-lens pair, the optical-to-THz conversion efficiency rises more quickly under lower laser pulse energies, and then increases linearly with the laser pulse energy as shown by the blue dots in Fig. 59(f). Although the conversion efficiency of the C-lens scheme is much lower than that of the S-lens scheme under low laser energies, it may eventually exceed the maximum conversion efficiency of the S-lens scheme under higher energies since it increases linearly with laser pulse energy.
To prove that the THz energy from the water line is concentrated in the detection azimuthal direction by the plasma elongated along the y axis in water, the C-lens pair is rotated around the laser axis as is optimized at 1.7-mJ laser energy and measures the peak THz amplitude. In this case, the major axis of the elliptical focal spot will rotate synchronously with the C-lens pair. The result is shown in Fig. 60(a), where 0° and 180° represent the major axis of the elliptical focal spot orientated horizontally. The maximum peak THz amplitude is obtained at 90°, which means L1 is placed vertically while L2 is placed horizontally as Fig. 58(a) shows. Although a THz wave emitted from plasma in water is affected by the absorption of water and the refraction on the water–air surface, the result in Fig. 58(a) can still roughly depict the azimuthal angular distribution of the THz wave from plasma with an approximately line-like transverse section in water, which essentially agrees with the prediction of the THz emission pattern based on the interference of dipoles, shown in Figs. 57(b)–57(e). More THz energy is concentrated in the direction perpendicular to the major axis of the focal spot. Since the THz wave is collected horizontally by the detection system, the maximum THz signal is obtained when the major axis of the elliptical focal spot is oriented vertically, corresponding to the 90° in Fig. 60(a).
Figure 60.Peak THz amplitudes generated from plasma in (a) water line and (b) air as the C-lens pair rotates around the laser axis, verifying that in both air and liquid water, the ponderomotive-force-induced dipole emission pattern can be reshaped and reoriented by plasma reshaping. Figures reprinted from Ref. [147], Optica.
Since the THz emission from air plasma induced by a tightly focused single-color laser pulse is also mainly attributed to the ponderomotive force-induced dipole[148], a similar phenomenon can be found when the water line is removed. Figure 60(b) shows the amplitude of the THz wave emitted from air plasma as the C-lens pair rotates around the laser axis. Differently, nearly chirp-free laser pulses with pulse width are used to achieve the maximized THz signal from air plasma. THz radiation is detected at the directional emission angle of 40° with respect to the laser propagation direction so that the THz signal has a sufficiently high SNR. Since the laser beam focused by the C-lens pair has two beam waists on the z axis, as shown in Figs. 58(b) and 58(c), there are two plasmas formed in the air. The first plasma is approximately located at the focal point of PM1, while the second is away from the first plasma along the z axis. Therefore, the detected THz signal is not affected significantly by the THz wave emitted from the second plasma since it can hardly be collected by PM1. The result in Fig. 60(b) agrees with the theoretical predictions in Fig. 57 better than that in Fig. 60(a) owing to the fact that the THz wave generated from air plasma does not have to pass through any uneven absorption or refraction on the medium interface before it reaches the ZnTe crystal for EOS measurement. The result in Fig. 60(b) is equivalent to the azimuthal angular distribution of THz wave from air plasma with a line-shape transverse section, which can further prove the simple theoretical prediction that the THz wave is concentrated in the direction perpendicular to the orientation of the dipole array.
In summary, the THz signal collected from the water line can be enhanced by manipulating the shape and size of the laser-induced plasma in water simply using a cylindrical lens pair. The energy of the THz wave generated by the laser beam focused with the cylindrical lens pair is increased by a factor of at 1.7-mJ laser pulse energy, compared to the case with the spherical lens. The enhancement of THz energy can be attributed to the combined effect of the constructive interference of the line-like THz source in the detection direction and the increase of total emitted THz energy with laser pulse energy when the impact of the intensity clamping effect in water is weakened by the enlarged focal spot. The dependence of THz energy on laser pulse energy follows a quadratic trend, implying that the detectable THz signal can be further increased when higher pump energy is available. Although the optical-to-THz conversion efficiency in the case of the cylindrical lens pair is relatively lower than that of the spherical lens under low pump laser pulse energies, it increases with laser pulse energy, and eventually exceeds the conversion efficiency of the spherical lens scheme at higher laser energy. Results on the azimuthal angular distribution of the THz electric field verify that THz radiation is concentrated and redirected in the direction perpendicular to the major axis of elliptical plasma through the interference of dipoles. This demonstration provides a simple but effective way to scale the detectable THz signal generated from liquid water.
3.10 Coherent Detection of Broadband THz Waves with Liquids
Similar to the coherent detection of broadband THz waves with laser-induced plasma in gases[39,40,92], coherent detection of pulsed THz waves can also be achieved with laser-induced plasma in liquid media, recently reported by Liangliang Zhang’s group[52,149]. This is remarkable progress in the sensing of intense electromagnetic waves in the THz frequency range. Figure 61(a) illustrates the experimental scheme used to coherently detect THz waves with a liquid water film. A fundamental femtosecond laser beam at a central wavelength of 800 nm is focused through a frequency-doubling crystal BBO, generating a controllable SH (CSH) at 400 nm, and a THz pulse is focused collinearly with the fundamental beam into a water film to generate TFISH by mixing the THz pulse and the fundamental beam in the laser-induced plasma within the water film. Then the TFISH with CSH signals is collected and detected by the PMT. Figure 61(b) shows the measured total SH signal as a function of the time delay between the THz wave and optical probe beam, in comparison with the THz waveform measured with EOS with a 0.1-mm GaP crystal. Results show that the measured time-resolved SH signal is essentially the same as the THz waveform measured by EOS with 0.1-mm GaP, verifying that coherent detection of broadband THz waves is achieved using liquid water as the THz wave sensor. Figure 61(c) presents the Fourier transform spectra of the time-resolved SH signal and the THz waveform obtained with EOS for comparison in the frequency domain.
Figure 61.Coherent detection of broadband THz waves with laser-induced plasma in liquid water. (a) Schematic of the experimental setup. A fundamental beam at 800 nm is focused through a BBO crystal to generate a controllable second-harmonic (CSH) at 400 nm, and a THz pulse is focused into a water film to generate THz-field-induced second-harmonic (TFISH) by mixing the THz pulse and the fundamental beam in the water film. Both TFISHs with CSH signals are collected and detected by the PMT. (b) Measured total second-harmonic (SH) signal as a function of the time delay between the THz wave and optical probe beam, in comparison with the THz waveform measured with EO sampling with a 0.1-mm GaP crystal, indicating that the measured time-resolved SH signal is consistent with the THz waveform measured by EO sampling with 0.1-mm GaP. (c) Fourier transform spectra of the time-resolved SH signal and the THz waveform obtained with EO sampling, for comparison. Figures reprinted with permission from Ref. [49], American Physical Society.
Compared to THz-ABCD, the advantage of using liquid water as the THz wave sensor in this work is that much lower probe laser energy (less than 1 µJ) or intensity is needed for coherent THz wave detection, whereas using THz air-biased coherent detection, tens of µJ probe pulse energy is required. However, the sensitivity of coherent THz wave detection with liquids, as reported in this and follow-up work[52,149], is about three orders of magnitude lower than that of THz-ABCD, where a THz electric field of the order of 1 kV/cm is required, since a minimal THz field strength of MV/cm is used in this work. It is noteworthy that when talking about the sensitivity of a system used to detect a signal, it refers to the minimal signal strength that can be detected by the system. Therefore, in both cases, i.e., THz-ABCD and coherent THz wave detection using liquids, sensitivity refers to the minimal detectable THz electric field rather than probe pulse energy[52,149]. Nevertheless, coherent THz wave detection using liquids is an advanced technique for sensing coherent THz radiation.
4 Conclusions and Discussion
As THz wave sources, both gas and liquid plasma-based THz wave emitters exhibit remarkable abilities to generate ultra-broadband coherent THz radiation. In the case of single-color laser excitation, the detectable coherent THz electric field from liquids is about one order of magnitude higher than that from gaseous media due to the higher plasma density resulting from the lower ionization potential and higher molecular density in liquids. In the case of two-color laser excitation, considering the highest record (100 MV/cm)[123], the gas plasma-based THz wave source can radiate THz waves with a peak electric field about four orders of magnitude higher than that from the liquid plasma-based THz wave source. Even though liquids have very lower ionization thresholds and higher molecular densities, which benefits THz emission efficiency, the effective interaction length between the laser and the liquids for THz wave emission is much less than that between the laser and gases, reducing the total THz emission efficiency. This is because two-color laser pulses in liquids experience more severe dispersion, significantly decreasing the effective length of the interaction between two-color laser fields and liquid media. On the other hand, liquids have much higher absorption coefficients compared to gases, limiting the overall detected THz field strength. The coupling efficiency of THz waves from liquid–air interfaces greatly reduces the emitted THz field strength.
Plasma-based THz sources, especially two-color laser-induced gas plasma-based THz sources, can offer some distinct advantages over other advanced THz sources. Table 1 is a comparison of several advanced broadband THz sources, in which some highest records on the performances of these THz sources are listed. As mentioned in Section 2.5, the highest records on the THz peak electric field and conversion efficiency from two-color laser-induced air plasma are achieved using mid-IR laser pulses at 3.9 µm[123]. In this case, the spectral range of the THz radiation covers 0.1–20 THz, and the THz pulse energy reaches 0.185 mJ.
With the tilted pulse-front approach, a lithium niobate (LN) crystal can emit THz pulses with a pulse energy of 13.9 mJ at a central frequency below 1 THz through optical rectification (OR)[150]. It is noteworthy that generation of such a high-energy THz pulse requires a cryogenic cooling system for the LN crystal. The peak electric field of the THz pulses emitted from LN crystals cannot be very high, since the focal spot size of the emitted THz beam cannot be very small due to the diffraction limit at low frequencies. In general, the THz radiation from two-color laser-induced gas plasma has advantages over that from LN in terms of the peak electric field and spectral bandwidth.
Organic crystals (e.g., DSTMS, OH1, and DAST) can be competitive alternatives to LN crystal, since they can efficiently generate intense THz pulses with a frequency coverage from 0.1 to 10 THz through OR without the requirement of a tilted pulse-front pump laser beam and a cryogenic cooling system. Compared with the two-color laser-induced plasma scheme, OR in organic crystal can obtain higher THz pulse energy and conversion efficiency, as well as a very high THz peak electric field. However, for the collinear phase-matching condition, organic crystals typically require IR pump wavelengths in the 1.2–1.6 µm spectral range[151,152]. Phase matching at the 0.8-μm wavelength directly from a commercial Ti:sapphire amplified laser system is usually possible only at low frequencies below 1 THz.
GaSe crystal can efficiently generate THz pulses with a tunable central frequency (10–100 THz) through difference-frequency generation (DFG). As reported in Refs. [153,154], GaSe is pumped by laser pulses from two optical parameter amplifiers (OPAs), which significantly increases the complexity of the entire system for intense THz wave generation. The spectra of THz pulses generated by GaSe can barely cover the frequency range from 0.1 to 3.0 THz, which is important to many applications. Therefore, DFG in GaSe is generally considered as a method to generate THz waves with central frequencies mainly located in the mid-IR range.
The highest records on the performances of THz sources are usually obtained with specific experimental requirements, for example, the use of extremely high-energy-pump laser pulse, cryogenic environment, and high-efficiency OPAs. However, with moderate laboratory facilities (1-mJ pulse energy, 100-fs pulse duration), it is still possible to obtain a THz pulse with about a 100-kV/cm peak electric field and 10-THz bandwidth from the two-color laser-induced gas plasma THz source, as we demonstrate in Fig. 22. The setup of such a plasma-based THz source requires only a focusing lens, a crystal, and a commercial femtosecond Ti:sapphire amplified laser system, which is available in common optical laboratories. The instability of air plasma-based THz sources mainly arises from air turbulence and laser pulse-to-pulse fluctuation. If both the optical and THz beam paths are enclosed in a chamber slightly purged by dry air or nitrogen gas, the stability of air plasma-based THz sources can be significantly improved. Definitely, THz pulse instability originated from laser pulse fluctuation is higher for the two-color laser-induced THz source based on high-order nonlinearity than that for other THz sources based on second-order nonlinearity. To get relatively stable THz signals from two-color laser-induced gas plasma, researchers need some tricks to properly align the THz-TDS system. In fact, the THz wave emitted from a two-color laser-induced gas plasma filament has a non-Gaussian emission pattern, and the THz electric field is not peaked at the center of the THz beam. Therefore, the THz beam and probe laser beam need to be aligned non-concentrically to obtain a higher peak electric field with a very high SNR or dynamic range. As presented in Section 2.5, a very high dynamic range over 10,000 can be obtained in THz-TDS based on the two-color laser-induced gas plasma with a single scan. THz-TDS using a plasma-based THz source and detection techniques has already been utilized to investigate optoelectronic properties of materials. Recently, linear[156] and nonlinear[157] properties of graphene have been investigated by THz-TDS using two-color laser-induced plasma as the THz source and THz-ABCD as the THz detection method.
As broadband THz wave sensors, both liquids and gases can be used to coherently detect broadband pulsed electromagnetic radiation in the THz frequency range and beyond. As discussed above, using liquids as the THz wave sensor, the required probe pulse energy is about two orders of magnitude lower than using gases, significantly reducing the requirements on probe laser pulses. However, the sensitivity of a liquid-based THz wave sensor needs to be significantly improved. Currently, it is above three orders of magnitude lower than that of the gas-based THz wave sensor, and neither the SNR nor the dynamic range using liquids as the THz wave sensor is as high as those of the THz gas sensor. For both detection methods, the bandwidth is essentially limited by the probe pulse duration. Due to the higher dispersion at optical wavelengths and higher absorption at THz frequencies in liquids in comparison with those in gases, the detection bandwidth using liquids as the THz sensor is not supposed to be better than that when a THz gas sensor is used.
Coherent control and manipulation of THz radiation can be achieved in both gas- and liquid-based THz wave emitters under two-color laser excitation. Even though coherent polarization control of THz waves emitted from two-color laser-induced plasma in liquids has not been demonstrated, one can expect that such a work similar to that of the gas plasma-based THz source will be reported soon.
Research on the plasma-based THz wave photonics in liquids has just started, and significant improvement in the THz peak electric field, emission efficiency, coherent polarization control and manipulation, as well as THz detection sensitivity of liquid-based THz wave sensors can be expected. Some approaches, such as the double-pump technique and plasma reshaping, can be applied to improve the performances of liquid plasma-based THz emitters. As one of the most direct approaches, the use of other liquids with lower absorption coefficients can achieve a higher THz electric field and broader THz spectral coverage. For example, the THz electric field emitted from ionized -pinene is 1.8 times that from ionized liquid water, and its corresponding Fourier transform spectrum is broader than that from ionized liquid water[158]. Similarly, the performance of liquid plasma-based coherent detection can be improved using liquids with lower absorption coefficients as the THz sensor. It has been proven that by replacing liquid water with ethanol, the TFISH signal can be improved with the same probe pulse energy[159].
[136] F. Ling et al. Sideway terahertz emission from a flowing water line. 46th International Conference on Infrared, Millimeter and Terahertz Waves (IRMMW-THz)(2021).