
Yunhao Fu, Baisong Chen, Wenqiang Yue, Min Tao, Haoyang Zhao, Yingzhi Li, Xuetong Li, Huan Qu, Xueyan Li, Xiaolong Hu, Junfeng Song. Target-adaptive optical phased array lidar[J]. Photonics Research, 2024, 12(5): 904
- Photonics Research
- Vol. 12, Issue 5, 904 (2024)
Abstract
1. INTRODUCTION
Advances in sensing and artificial intelligence (AI) technology have significantly accelerated the adoption of autonomous driving. This technology has demonstrated significant advantages in various sectors, including rapid sorting, campus logistics, and delivery robots [1–3]. Notwithstanding considerable progress, Level 4 autonomous driving remains confined to limited areas. Most implemented autonomous driving systems are currently limited to Level 2 and below [4,5]. The obstacles to achieving a higher level of autonomous driving reside partly in the limited capabilities of perception systems [6–8]. An ideal system would combine a wide field of view (FOV) with high resolution, precision, dynamic range, reliability, and cost-effectiveness. Commonly used perception devices include cameras, lidars, millimeter-wave radars, and ultrasonic radars [7–13]. Among these devices, millimeter-wave and ultrasonic radars serve primarily as supplementary tools, owing to their low resolution; cameras and lidars constitute the core of perception systems. Cameras, known for their high maturity, resolution, reliability, wide FOV, and cost-effectiveness, are excellent devices for mimicking human vision and are vital for recognizing traffic signs. However, cameras face challenges in precise 3D spatial perception. Companies such as Tesla advocate pure vision-based autonomous driving. However, this approach places very high demands on algorithm development capabilities, computational platforms, and data collection and annotation. Therefore, even powerful companies like Tesla, with substantial financial and technological resources, have not been able to achieve comprehensive technological implementation. Lidar, renowned for its precise spatial perception and high resolution, serves as a crucial complement to the camera and is a vital component of autonomous driving systems. However, since mechanical lidars were introduced into autonomous driving systems in the DARPA Grand Challenge 2007, they have not yet been widely adopted for mass-market vehicles due to their mediocre reliability. This issue has been partially mitigated by hybrid solid-state technology; however, challenges remain. Lidars based on single-photon avalanche diode (SPAD) and vertical-cavity surface-emitting laser (VCSEL) arrays have realized a truly all-solid-state solution, significantly improving the reliability [14–16]. Nevertheless, due to the strong coupling among the FOV, resolution, and cost, it often necessitates the integration of lidars with varying focal lengths to effectively cater to the demands of autonomous driving applications. Furthermore, environmental light interference and lidar crosstalk constitute significant hurdles to the widespread adoption of this kind of lidar.
Lidar systems that leverage optical phased array (OPA) technology utilize a 2D scanning mechanism based on an OPA chip. The OPA chip controls the direction of the combined beam by adjusting the phase differences of light within its various channels [17–21]. Figures 1(a) and 1(b) depict the principle of OPA beam steering and the structure of the OPA, respectively. Compared to mechanical and hybrid solid-state lidar, OPA lidar exhibits greater reliability with its solid-state scanning ability. Moreover, it provides superior scanning flexibility compared to solid-state lidar based on SPAD and VCSEL arrays because of its capacity to rapidly switch between any two detections within the FOV simply by adjusting the OPA control voltages. This feature facilitates 2D scanning with the desired FOV and resolution [22–25]. OPA lidar employs coherent detection using frequency-modulated continuous waves (FMCWs) and demonstrates remarkable resistance to ambient light and other lidars [26–29]. Recently, significant advances have been made in OPA lidar. In 2019, Analog Photonics introduced an OPA-based coherent ranging and velocimetry measurement system. It can achieve a large FOV of and a steerable beam with an FWHM diffraction angle of 0.04° [30,31]. In 2020, they presented an OPA chip with 8192 elements, which could capture point cloud images of various outdoor objects with a detection range of 35 m and achieved a FOV [32]. In 2022, we developed a chain antenna OPA based on a dual-level silicon nitride waveguide, which could expand the FOV to with a divergence of [22]. In 2023, a monolithic silicon photonic lidar device incorporating 9216 OPA elements was presented, capable of capturing point cloud images of targets up to 50 m away at a rate of 10,000 points/s [33]. Notwithstanding these successes, OPA lidar remains constrained by several factors. Notably, FMCW modulation and demodulation technology requires numerous fast Fourier transform (FFT) calculations, requiring a significantly greater computational workload than conventional time-of-flight (TOF)-based lidar systems. It leads to a significant increase in the system power consumption and cost and a notable decrease in the point rate and real-time processing capability.
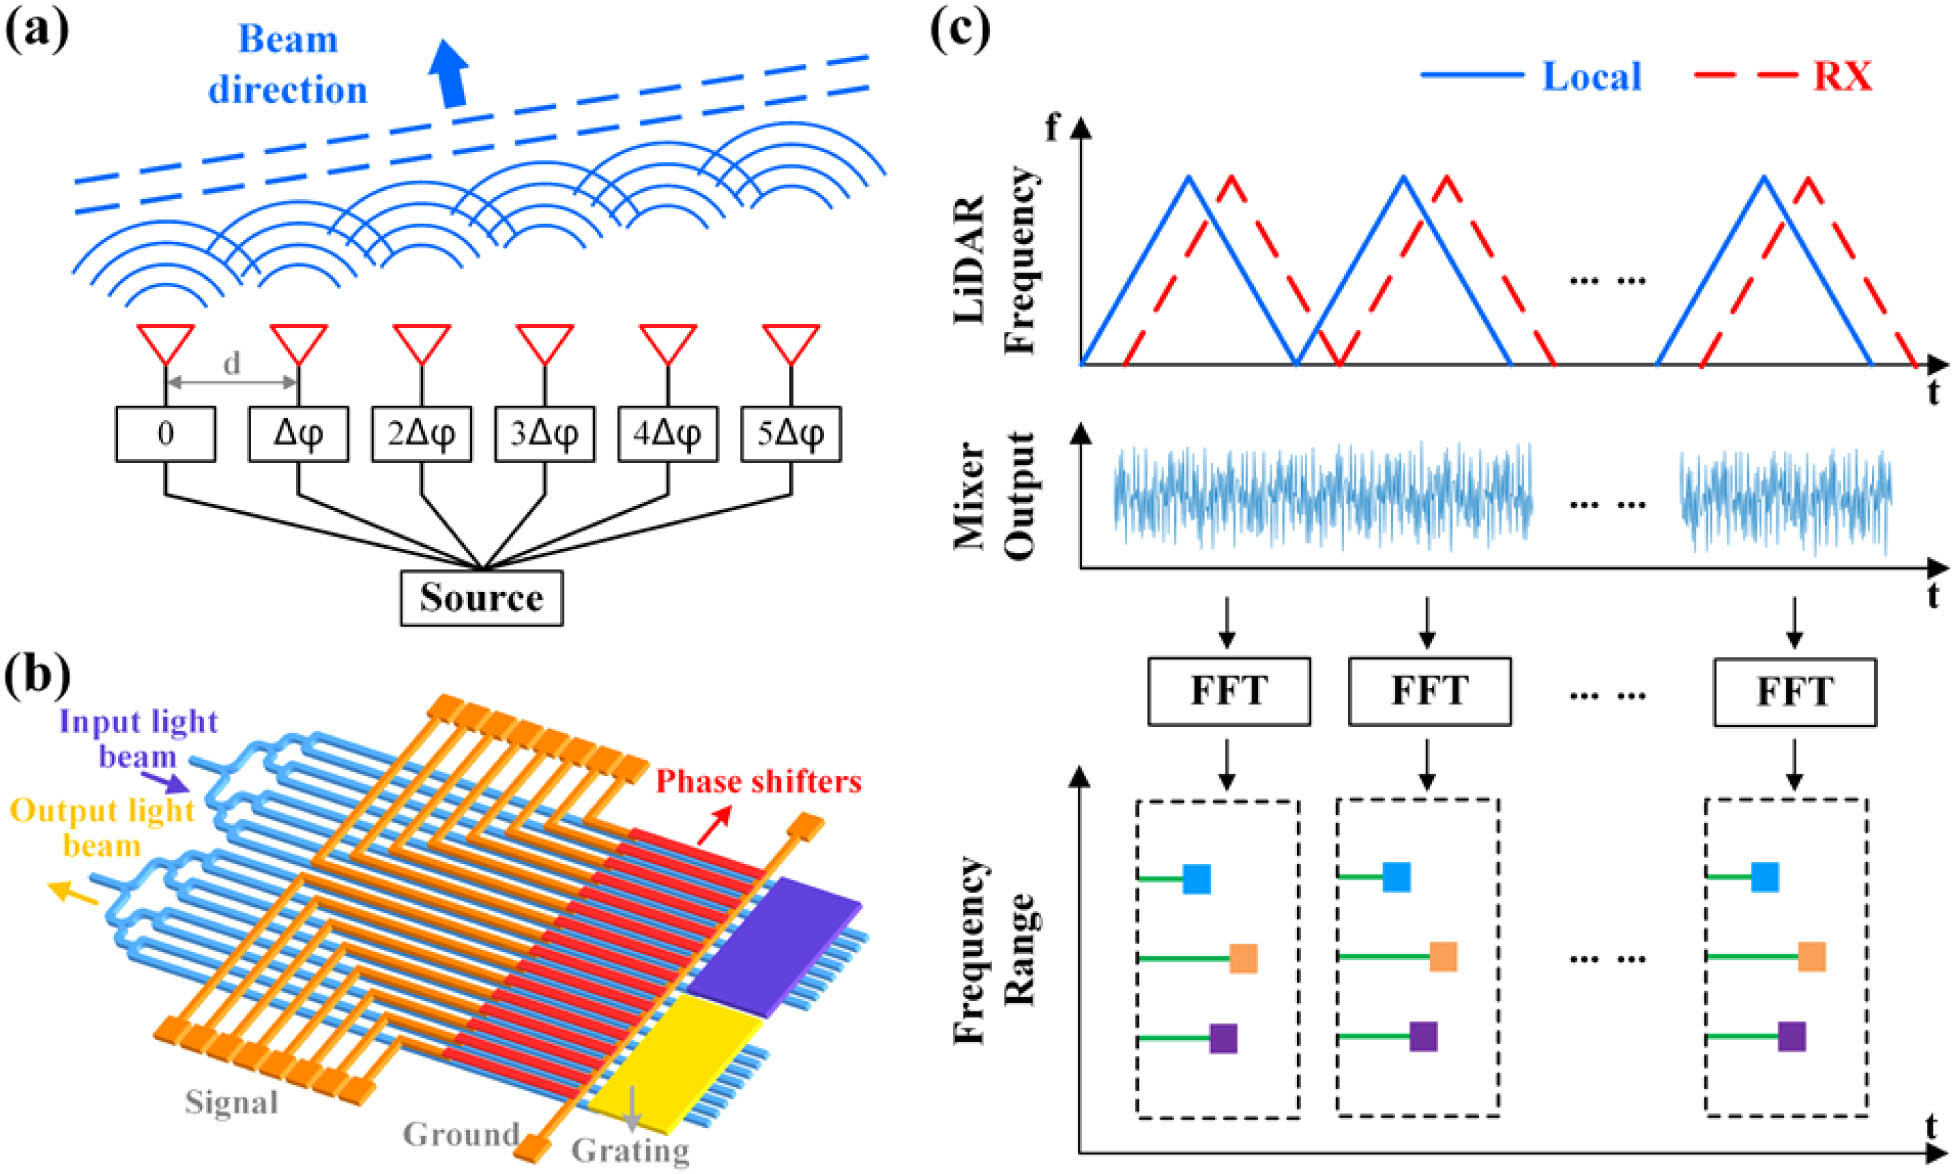
Figure 1.(a) Principle of optical phased array (OPA) beam steering. (b) Structural design of the OPA chip. (c) Distance resolution principle of frequency-modulated continuous waves (FMCWs).
In real-world driving scenarios, key objects such as pedestrians, vehicles, and traffic signs often constitute only a small proportion of the scene. Conversely, irrelevant objects, such as the sky, out-of-range objects, and objects with monotonous features like the ground, tend to dominate the FOV. It results in a considerable amount of data that are either irrelevant or redundant for automated driving systems. This phenomenon is demonstrated in Fig. 2(a), which shows the image segmentation of a typical traffic scene, and Fig. 2(b), which depicts a point cloud from the KITTI autonomous driving dataset captured using a Velodyne 64-line lidar [34,35]. To address the abovementioned issues, an advanced target-adaptive OPA lidar imaging method is proposed in this study. This method utilizes RGB images to identify and classify targets in the current scene. Leveraging the flexibility of OPA lidar in scan angle control, it dynamically adjusts the scanning resolution of different regions based on the importance of various targets. This tailored scanning approach not only gazes at pivotal targets, thus reducing the overall scanning point cloud volume, but also substantially increases the point cloud density for these key objects, curtailing ineffective and redundant point clouds. The experimental results indicate that the target-adaptive method reduced the total point cloud requirement to about one-quarter compared to uniform high-density scanning. Additionally, compared to a global low-density scan with an equivalent point cloud number, the target-adaptive method quadrupled the point cloud density for the key target, significantly enhancing the system’s perceptiveness.
Sign up for Photonics Research TOC. Get the latest issue of Photonics Research delivered right to you!Sign up now
![]()
Figure 2.(a) Target distribution in various traffic scenarios. (b) Lidar sensor-captured point cloud in a specific traffic scenario.
2. METHOD
A. Optical Phased Array Lidar
An OPA comprises multiple optical antenna arrays strategically spaced at specific intervals. The direction of beam deflection can be precisely controlled by modulating the near-field phase differences between the OPA antennas. In this study, we used an OPA chip with a Vernier OPA structure, incorporating silicon-based chained grating antennas [36]. The operation of the optical phase modulator in this architecture is based on the thermo-optic effect, using a heated resistor for phase modulation. When the resistor heats the waveguide, it alters the waveguide’s refractive index, creating distinct phase differences in equally powered beams. The OPA chip, built on a layer of silicon nitride resting on a silicon-on-insulator platform (), features various components, including cascaded multimode interference (MMI) couplers, thermo-optic phase shifter arrays, drive signal control electrodes, and grating antenna arrays. It is equipped with 128 transmission (TX) antennas and an equal number of reception (RX) antennas, enabling simultaneous transmission and reception of optical signals. In MMI, the optical power is evenly distributed across channels, with each thermo-optic phase shifter linked to a drive voltage signal via signal electrodes, thereby facilitating precise control over the optical phase of each channel. This mechanism allows the adjustment of the deflection angles in both the TX and RX OPAs, providing versatile beam deflection and scanning capabilities within a specified range of FOV angles. Building on the authors’ prior research, this study integrated an OPA chip into an FMCW lidar system [22,37,38]. Utilizing the principle of coherent detection, the system measured the target distances by analyzing the frequency difference between the received and reference signals.
B. Joint Calibration of the Camera and Lidar
Joint calibration of the camera and lidar is a pivotal step in the integration of these sensors, particularly for applications such as autonomous driving that requires precise spatial awareness. The calibration process establishes the exact spatial correlation between the camera and the lidar system. As depicted in Fig. 3, the concurrent calibration of the camera and the OPA lidar is necessary. The calibration yields a pose transformation matrix that delineates the relationship between the coordinate systems of the camera and the lidar. This matrix is vital for precise data fusion and interpretation, enabling the translation of coordinates from the lidar to the camera system. Essentially, the calibration synchronizes the data from both sensors within a unified coordinate framework, ensuring accurate alignment and the combined utilization of the gathered spatial information.
![]()
Figure 3.Schematic of camera and lidar coordinate system.
In our study, we adopted a method that minimizes the reprojection error, using MATLAB for the combined calibration of the camera and lidar [39]. A checkerboard calibration board angled obliquely within the scene served as the calibration target. The camera and OPA lidar simultaneously captured the 2D and 3D point cloud data of the board. The corner points extracted from the checkerboard grid facilitated the establishment of geometric correspondences between the image and lidar coordinate systems, enabling the computation of the transformation matrices.
C. Region Prediction and Target-Adaptive Scanning Method
We utilized the open-source object detection algorithm Ultralytics YOLO-v8 for object detection and segmentation[40]. Equation (1) outlines how to project a point from a three-dimensional world coordinate system onto a point on a two-dimensional camera imaging plane. Meanwhile, Eq. (2) describes how to compute the three-dimensional coordinates of a point on the camera plane within the world coordinate system. Suppose the lidar coordinate system is chosen as the world coordinate system. In that case, and denote the rotation and translation matrices between the lidar and camera coordinate systems, respectively. is a scaling factor proportional to the depth of . In the camera imaging process, the information of will be discarded. Therefore, in order to compute the three-dimensional coordinates in the lidar coordinate system of a point on the camera plane, the depth information corresponding to the target point must be provided as prior information. In the target-adaptive algorithm, prior depth information will be obtained through coarse scanning with low resolution using OPA lidar. The two equations are
Figure 4 shows a schematic representation of the target-adaptive 3D imaging method. The YOLO-v8 object detection algorithm extracted the target’s predicted box from an image captured by a camera. The target’s prediction box is subsequently transformed into a three-dimensional space under the lidar coordinate system through backprojection and then utilized to guide the target-adaptive 3D point cloud collection. In the target-adaptive 3D point cloud collection, high-resolution scanning will be employed for key objects, while lower resolutions will be used for other objects. To enhance the accuracy of delineating key objects, the YOLO-v8 segmentation algorithm is employed to obtain pixel masks, replacing the simple prediction box for key objects.
![]()
Figure 4.Schematic representation of the target-adaptive 3D imaging method.
To evaluate the effectiveness of the proposed method, a statistical analysis was conducted on the distribution of different kinds of objects across various scenarios in the SemanticKITTI dataset. The SemanticKITTI dataset, drawn from the KITTI Vision Benchmark, features continuous 3D point cloud sequences, including Velodyne lidar and camera images, with labeled categories and annotations [41]. The statistical results are illustrated in Fig. 5.
![]()
Figure 5.(a) Statistical distribution of point clouds across target types in varied scenarios. (b) Proportional analysis of targets across 1000 randomized images in various scenarios.
The SemanticKITTI dataset divides point clouds into 28 semantic categories based on their corresponding target types. These categories include “unlabeled,” “outlier,” “car,” “bicycle,” “motorcycle,” “truck,” “other vehicle,” “person,” “bicyclist,” “motorcyclist,” “road,” “parking,” “sidewalk,” “other ground,” “building,” “fence,” “vegetation,” “trunk,” “terrain,” “pole,” “traffic sign,” “other object,” “moving car,” “moving bicyclist,” “moving person,” “moving motorcyclist,” “moving on rails,” and “moving truck.” The 14 categories of targets, including “car,” “bicycle,” “motorcycle,” “truck,” “other vehicle,” “person,” “bicyclist,” “motorcyclist,” “moving car,” “moving bicyclist,” “moving person,” “moving motorcyclist,” “moving on rails,” and “moving truck,” are classified as key objects in Fig. 5. These target locations, and their movement status and behavior, are crucial for planning and decision-making in autonomous driving systems. “Unlabeled” and “outlier” are classified as others. The other 12 semantic categories are classified as road and roadside features.
The analysis revealed that the road and roadside features categories constituted approximately 35% and 62% of the FOV, respectively; the key objects accounted for less than 0.20%. Figure 5(b) shows the analysis of 1000 randomly selected image frames from different scenarios. Road and roadside features predominantly occupy the FOV, regardless of the scenario, and the maximum proportion of point clouds for key objects seldom exceeds 1%. These findings substantiate the fact that lidar systems allocate extensive point cloud resources to nonkey objects. The proposed target-adaptive method can dynamically adjust the scanning resolution for different types of objects based on their importance. It substantially reduces the collection of redundant and invalid point clouds while ensuring the high resolution scanning for key objects and significantly enhancing the system’s perception capabilities.
3. EXPERIMENTS AND RESULTS
A. Test System
The experimental setup of the target-adaptive OPA lidar 3D imaging system is illustrated in Fig. 6. Figure 6(a) depicts the test system and scenario. An Intel RealSense D435 camera was used for the RGB image collection. Figure 6(b) exhibits the calibration board used for the joint calibration. Figure 6(c) depicts the target mannequin model in the test scene.
![]()
Figure 6.(a) Test system and scenario. (b) Calibration board. (c) Target to be tested.
Figure 7 presents the architecture of the OPA lidar. The transmission path of the lidar system comprised a sweep-frequency laser, an optical amplifier, and a transmitting OPA (TX-OPA). The reception path included a receiving OPA (RX-OPA), a mixer, a balanced detector, and a digital signal processing unit. The driving circuit supplied the necessary voltages for both the TX-OPA and RX-OPA. The sweep-frequency laser emitted a triangular-wave frequency-modulated signal, which was directed into the OPA after amplification. TX-OPA was used to control the emission angle of the laser beam. RX-OPA captured the light reflected from the target, which was subsequently mixed and converted into an electrical signal using a balanced detector. The digital signal processing unit analyzed the beat frequency signal. The time delay utilized to determine the target distance was obtained by analyzing the frequency difference between the reflected light and the reference light signal. Figure 7(b) shows the frequency domain results derived from scanning a scene point with the frequencies of both the up-chirp and down-chirp. The distance information of a point can be computed by examining the positions of the frequency peaks. Figures 7(c) and 7(d) display photographs of the OPA test board and chip, respectively. The input light signal was channeled into the OPA chip via an optical fiber, and the OPA test board was mounted on the driving circuit board beneath.
![]()
Figure 7.(a) Schematic depiction of FMCW-based OPA lidar test system. (b) Up-chirp and down-chirp results of the FMCW system. (c) OPA testing board. (d) Micrograph of the Vernier OPA chip.
B. Calibration Result
During the joint calibration of the camera and lidar, it is imperative to gather multiple sets of images and point cloud data for various poses. A photograph of the calibration board and a set of point cloud data of the calibration board collected by OPA lidar are presented in Fig. 8. Figure 9 shows the error derived from the joint calibration process. The results indicate that utilizing the pose matrix obtained from the joint calibration for reprojection yielded an average reprojection error of 3.91 pixels. The average translation and rotation errors were 11.22 mm and 1.33°, respectively.
![]()
Figure 8.Joint calibration of the camera and lidar. (a) Photographic representation of the calibration board. (b) Point cloud of the calibration board.
![]()
Figure 9.Results of joint calibration errors. (a) Translation errors. (b) Rotation errors. (c) Reprojected errors.
C. Target Region Extraction and Adaptive Scanning Strategy for Imaging
In the global high-resolution scanning, the horizontal FOV was set to 27.20° with a horizontal resolution of 0.40°; the vertical FOV was set to 8.52° with a vertical resolution of 0.85°. The captured image of the test scene and the 3D point cloud are illustrated in Fig. 10. The number of points in Fig. 10(b) is 759.
![]()
Figure 10.(a) Test scene image. (b) Global uniform scanning of test scene.
In the target-adaptive method, the RGB image of the scene and the coarse scanned point cloud data will be acquired at first. The resolution of the coarse scanning is . The point cloud from the coarse scanning is depicted in Fig. 11(a), with a total of 108 points. The refined and smooth depth map, generated using the natural neighbor interpolation method, is presented in Fig. 11(b). The red box in Fig. 11(c) indicates the target prediction box identified using the object detection algorithm. The refined depth map, combined with the prediction box identified by the object detection algorithm, facilitates the transformation of a 2D prediction box into a 3D target region. Subsequently, the lidar performs a formal scanning of the 3D target region. The point cloud of the 3D target region is illustrated in Fig. 11(d), and the number of points of Fig. 11(d) is only 220. This approach ensures that the point cloud data are concentrated in the key objects, thereby significantly enhancing the utilization of the lidar point cloud.
![]()
Figure 11.(a) Point cloud of the coarse scanning. (b) Depth map using interpolation. (c) Target prediction box of the key object. (d) Point cloud of the 3D target region in the formal scanning.
For targets exhibiting unique shapes or poses, it is more efficient to use the target segmentation results for 3D target region prediction than for rectangular target prediction boxes. To further optimize the point cloud allocation strategy, the YOLO-v8 segmentation algorithm is employed to extract the segmentation mask of the key object in the test scene, and the segmentation result is presented in Fig. 12(a). The 3D area corresponding to the segmentation mask of the key object is named the primary target area, whereas the remaining regions are named the secondary target areas. Due to systematic errors, such as target segmentation errors, calibration errors, and coarse depth measurement errors, there may be some deviation in selecting the primary target area. To guarantee the complete coverage of the key objects, the primary target area will be slightly expanded in the scanning process.
![]()
Figure 12.(a) Mask of the mannequin model. (b) Point cloud image obtained through target-adaptive method.
Referring to Fig. 10(b), for the primary target area, the scanning resolution was doubled in both the horizontal and vertical directions, whereas the scanning resolution for the secondary target area was halved. The target-adaptive point cloud is presented in Fig. 12(b), encompassing 662 points, with 413 points covering the primary target area. Adding the 108 points obtained in the coarse scanning, the total number of points is 770. In contrast, only 107 out of the 759 points in Fig. 10(b) fall within the primary target area. Therefore, in the test scene, applying the target-adaptive method based on semantic segmentation results in an approximately fourfold increase in the point density of the primary target area, with a similar total points number. If the resolution of global uniform scanning is increased to that of the primary target area in the target-adaptive method, the number of points in the frame will reach 2877. Consequently, in the test scene, compared to traditional scanning methods, the target-adaptive method based on semantic segmentation reduces the number of points to about one-quarter while maintaining the resolution of the primary target area. The specific comparison results are list in Table 1. Comparison of Quantity and Distribution of Point Clouds Required for Global Uniform Scanning with Target-adaptive Method PA, primary target area; SA, secondary target area.Scanning Strategy Number of Point Number of Point Clouds Horizontal Vertical Global uniform (high resolution) 2877 413 27.20/0.20 8.52/0.43 Global uniform 759 107 27.20/0.40 8.52/0.85 Target-adaptive 770 413 27.20/0.20 at PA and 0.80 at SA 8.52/0.43 at PA and 1.70 at SA
The previous statistical analysis of the SemanticKITTI dataset indicates that the proportion of the primary target area in actual autonomous driving scenarios is notably lower than in the test scene. Consequently, the advantage of the proposed target-adaptive method will be more evident. By reducing redundant data and increasing the point density of the primary target area, the proposed target-adaptive method not only alleviates the computational burden but also enhances the perception capabilities of the lidar system. This, in turn, provides stronger support for the safety of autonomous driving.
4. CONCLUSION
This study has introduced a target-adaptive OPA lidar 3D imaging method. A camera and an OPA lidar were integrated to create a target-adaptive OPA lidar system. It employs target detection and segmentation algorithms to preprocess images captured by the camera and extract segmentation masks of the primary target within the scene. Benefiting from the flexible scanning angle control capability of OPA lidar, the target-adaptive OPA lidar system can then conduct high-resolution scans of primary target areas based on semantic segmentation while performing low-resolution scans of secondary target areas. The test results indicate that in the scene, the proposed target-adaptive method based on semantic segmentation increases the point cloud density of primary target areas by approximately four times while keeping the total point count essentially constant. Alternatively, the method reduces the required point quantity to about one-quarter of the global uniform scanning while keeping the point cloud density of the critical target areas unchanged. Furthermore, the statistical analysis of the SemanticKITTI dataset reveals a much lower primary target area proportion in real driving scenarios compared to the test scene. Thus, the advantage of the proposed target-adaptive method will be more apparent.
In summary, the proposed method can improve the perception of primary target areas while minimizing the collection of redundant or irrelevant data. It will reduce the computational burden on an OPA lidar system and enhance the safety of autonomous driving, thereby demonstrating significant practical value.
References
[28] S. Chung, M. Nakai, S. Idres. 19.1 Optical phased-array FMCW LiDAR with on-chip calibration. IEEE International Solid-State Circuits Conference (ISSCC), 286-288(2021).
[30] C. V. Poulton, P. Russo, E. Timurdogan. High-performance integrated optical phased arrays for chip-scale beam steering and LiDAR. Conference on Lasers and Electro-Optics, ATu3R.2.
[33] B. R. Moss, C. V. Poulton, M. J. Byrd. A 2048-channel, 125 μW/ch DAC controlling a 9,216-element optical phased array coherent solid-state LiDAR. IEEE Symposium on VLSI Technology and Circuits (VLSI Technology and Circuits), 1-2(2023).
[34] A. Kirillov, E. Mintun, N. Ravi. Segment anything. arXiv(2023).
[39] L. Zhou, Z. Li, M. Kaess. Automatic extrinsic calibration of a camera and a 3D LiDAR using line and plane correspondences. IEEE/RSJ International Conference on Intelligent Robots and Systems (IROS), 5562-5569(2018).
[40] G. Jocher, A. Chaurasia, J. Qiu. Ultralytics YOLO (Version 8.0.0) [Computer software](2023).
[41] J. Behley, M. Garbade, A. Milioto. SemanticKITTI: a dataset for semantic scene understanding of LiDAR sequences. IEEE/CVF International Conference on Computer Vision Workshops (ICCVW), 9296-9306(2019).

Set citation alerts for the article
Please enter your email address
© Copyright 2018-2021 | Chinese Laser Press. All Rights Reserved 沪ICP备15018463号-20