
Chenliang Chang, Xian Ding, Di Wang, Zhizhou Ren, Bo Dai, Qi Wang, Songlin Zhuang, Dawei Zhang. Split Lohmann computer holography: fast generation of 3D hologram in single-step diffraction calculation[J]. Advanced Photonics Nexus, 2024, 3(3): 036001
- Advanced Photonics Nexus
- Vol. 3, Issue 3, 036001 (2024)
Abstract
1 Introduction
Holographic displays can fully create a true three-dimensional (3D) light-wave field with accurate accommodation cues by the modulation of a computer-generated hologram (CGH) using spatial-light modulation (SLM) devices. In order to encode the whole complex wavefront including both of amplitude and phase from the 3D object, the CGH is generated through the numerical simulation of diffraction propagation and interference superposition from the emitted light wave of the 3D object. The degree of freedom to control the accommodation and depth range is thus higher. Therefore, the CGH can offer precise wavefront control, fine focus control, free from vergence-accommodation conflict, and no spatial-angular resolution trade-off.1
To date, there have been numerous algorithmic frameworks to generate the CGH. The deep-learning-based convolutional neural network (CNN) has emerged as an effective tool for improving the computation speed of CGH generation in recent years since its parallel operational framework and complex structure are based on convolutional layers.4
On the other hand, in order to mimic correct focus cues as well as defocus blurs as real-world observations from human eyes, the 3D targets should have a random phase to enable a diffusive surface to enlarge the numerical aperture in propagation and spread light into high-frequency hologram patterns. In this way, current deep-learning-based methods fail to establish relations between a fully diffusive 3D wavefront with totally random phase and high-frequency hologram patterns. So the CGH is usually generated by using conventional numerical propagation algorithms based on wave-optics diffraction theory. Basically, the 3D object is modeled into a collection of point-cloud data to mimic the emission of light. Each object point has a diffracted wavefront with specific amplitude and phase in the hologram plane. The CGH is generated by adding all of the wavefront diffracted from all the object points. The point-cloud-based method usually demands a very dense set of point-sources to render continuous depths, which requires a large computing budget. So the computation time of the diffraction-simulation-based CGH is quite slow compared with CNN-based CGH computation. Although several acceleration schemes have been proposed, such as the lookup table 14
Sign up for Advanced Photonics Nexus TOC. Get the latest issue of Advanced Photonics Nexus delivered right to you!Sign up now
In this paper, we present a simple and high-speed diffraction-simulation-based CGH generation method that enables only one-step diffraction calculation from the RGB depth (RGBD) image to the hologram, rather than repetitive diffraction calculation from point-clouds or layer-images. We propose a split Lohmann lens-based diffraction model based on a Fourier holography system between an RGB image and the hologram plane. In this diffraction model, the light-wave propagation from the RGB image to the hologram is modulated by a predesigned and depth-dependent virtual split -Lohmann lens phase, the generated CGH can display the image contents with spatially varying focal length, therefore providing a true 3D display experience with dense sampling of focal planes. The proposed method has a near-analytical mapping of input RGBD content to the hologram patterns modulated on the SLM. This ultralight computational footprint allows us to easily generate a high-resolution CGH at real-time speeds with commodity hardware.
2 Method
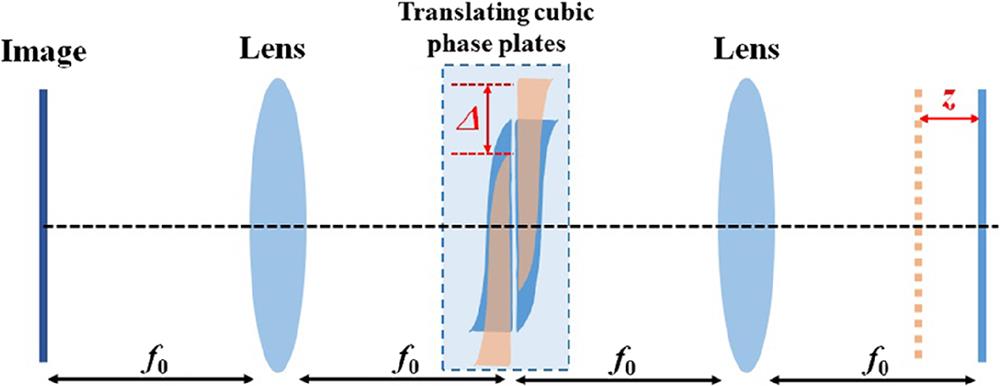
In a typical optical imaging system, the Lohmann lens provides an approach for realizing focus-tunable lenses using two translating cubic phase plates,26 as shown in Fig. 1. The underlying principle is the interaction of two translating cubic phase plates that are stacked together, with height maps and , where determines the curvature of the cubic phase plate. Therefore, the resulting phase modulation induced by the stacked cubic phase plates is
![]()
Figure 1.Implementation of focus-tunable function using Lohmann lenses.
Ignoring the constant terms of in Eq. (2), we find that the effect of the translated phase plates is to add a quadratic phase onto the propagation wavefront, which is identical to the effect of a lens with a focal length equal to . This quadratic phase modulation to the wavefront results in an axial translation of the projected image from the focal plane of the second lens. Specifically, assuming both of the lenses have a focal length of , the image is axially translated to
The second equation in Eq. (3) is derived by substituting . Different focal lengths of can be adjusted simply by changing the amount of translation between two cubic phase plates.
The principle of the Lohmann lens can be employed in computer holography, where the CGH is generated by numerically simulating the coherent diffraction propagation from image plane to the hologram plane through the Lohmann lens-based Fourier holography system. As shown in Fig. 2(a), the image wavefront constituting the image intensity and the random initial phase is calculated to the hologram plane using Fourier transform; then the resulted wavefront is multiplied by a phase modulation of the digital Lohmann lens of Eq. (2). Therefore, the computational generation of hologram is expressed as
![]()
Figure 2.CGH generation using Lohmann lens-based diffraction model. (a), (b) Analysis of CGH generation and reconstruction for focus-tunable holographic display. (c) Simulated results reconstructed from holograms generated using different translation amounts in a virtual Lohmann lens model.
By adjusting the parameter of the curvature of the cubic phase and the translation amount in Eq. (3), the CGH can reconstruct the target image at a desired distance away from the back focal plane of the Fourier lens optically, as shown in Fig. 2(b). We numerically reconstruct the CGH in a Fourier holographic display system to prove the focus tunable ability. In the simulated reconstruction from the CGH, we first Fourier-transform the hologram to the back focal plane of the Fourier lens; then we employ the angular spectrum method (ASM) to numerical propagate the wavefront to the target distance27 and observe the resulting light field. The CGH in the simulation has with pixel pitch. The wavelength is 532 nm. Figure 2(c) shows four cases of the simulated reconstruction. In each case, the CGH is calculated under a particular choice of translation amount while fixing and . We set , 0.0006, , and , and the displacement of the clearly reconstructed images from the Fourier plane are at the plane of , , 4, and 12 mm according to Eq. (3).
However, the above process can only generate a CGH that displays a two-dimensional (2D) image at different focal distances in Fourier holography. In order to enable a 3D display where different parts of the image can simultaneously reconstruct at different distances, we here propose to extend the diffraction model with a digital Lohmann lens into a more advanced version, dubbed the split Lohmann lens-based diffraction model. As shown in Fig. 3, we split the two virtual cubic plates comprising the Lohmann lens while retaining their collocation by placing them at either end of a relay system. According to the Fourier analysis theory, we introduce the translation of the two cubic plates by using virtual linear phase shift modulation to its frequency domain counterpart, where the slope of the linear phase modulation controls the amount of the translation.28 Essentially, this is to introduce an extra phase in the Fourier plane of one cubic plate to modulate its wavefront and therefore can laterally shift the cubic plate with the other counterpart in the output of the relay. Instead of using a global phase ramp in the frequency domain, we design a new type of virtual phase modulation profile where the ramp is locally varied according to the desired 3D display requirement. That is, depending on the slope of phase ramp modulation locally, we can induce different choices of focal length of the digital Lohmann lens and encode different powers of focus tunable lens functions into the hologram wavefront simultaneously. Using such spatially varied phase ramp in a virtual split Lohmann lens configuration is equivalent to changing the focal length for each point of the target 3D volume (more detail for explaining the focal control is presented in Sec. 4.3), thereby achieving content optically focused at varying physical depth when displaying the CGH. The local slope of the phase ramp is calculated according to the digitized depth information of the target 3D volume (namely, the depth map of RGBD data) and embedded into the calculation of the CGH, as mentioned above. As a result, we can propagate and encode the light wave from the RGBD content to the hologram in only one-step backward diffraction computation in our proposed split Lohmann lens-based diffraction model, opening up a new way of simple and high-speed calculation of CGH for holographic 3D display. The total computation time only depends on the resolution (pixels) of the hologram pattern.
![]()
Figure 3.Fast 3D hologram generation using the split Lohmann lens-based diffraction model including depth-dependent virtual phase modulations. (a) Analysis of wavefront propagation from the target to the hologram in split Lohmann lens-based diffraction. By introducing a virtual phase modulation with piecewise slope in the frequency domain between two virtual cubic phase plates, we enable spatially varying axial shifts on the display of the generated hologram. We refer to this procedure as split Lohmann computer holography. (b) An illustration of the fast one-step pipeline of the CGH generation algorithm.
Followed by the above analysis, we summarize the whole calculation of the hologram in the split Lohmann lens-based diffraction model in Fig. 3(b). In a monochromatic case for simple illustration, we convert the RGB image into a gray-scale one. The image is assigned with a random phase ranging in and we first perform a Fourier transform to its Fourier domain, where a cubic phase is added to the wavefront. Then, a second Fourier transform is performed to the conjugate plane of the image, the wavefront of which is multiplied by the phase with various ramp distributions according to the depth information, and then continue to Fourier-transform to the hologram plane, followed by the multiplication of the second cubic phase, and obtain the final complex hologram . Applying a 2D fast Fourier transform (FFT) algorithm and ignoring constants, the whole calculation can be expressed as
It should be noted that the employment of translating two virtual cubic phase plates for focus-tunable purposes can also be achieved using an Alvarez lens.29,30 The underlying principle between Lohman and Alvarez lens is similar. The key difference between them arises from how they deal with the translation direction of two virtual cubic phases. The Lohman lens requires the translation of two cubic plates along both the and axes with equal amounts. In contrast, Alvarez uses a slightly different arrangement that requires translation along the axis instead.31 So our CGH generation idea can also be implemented with an Alvarez lens-based diffraction model with little difference.
In the calculation of Eq. (5), it is important to determine the virtual phase with a locally varied slope according to the depth information of the target 3D volume. In order to shift one point of the target 3D volume along the optical axis to it desired depth, we need to introduce a displacement from the focal plane of the Fourier lens. We then use Eq. (3) to calculate the slope parameter corresponding to the particular point,
Consequently, given the input depth distribution of the target 3D volume, we assign an axial displacement map for all the target points simply with , where defined the depth range of the 3D target, and subsequently a phase slope profile is calculated by replacing in Eq. (6) with as
We can now calculate the virtual phase modulation term in Eq. (5) as
Compared with the conventional layer-based CGH generation method, the unique advantage of our method is that it can generate 3D CGH in only a one-step diffraction calculation instead of replicative diffraction between multiple layered images and holograms, and therefore can achieve very fast computation speed. The total computation time is proportional to the layer numbers in the layer-based method, while in our method the time is constant if the resolution (pixels) of the hologram is given. Therefore, our method can increase computation speed by several orders of magnitude. We show the comparison of runtime of generating CGH using two methods. In the layer-based method, we decompose the 3D content into layer images according to the depth map, whereas in the proposed method we quantize the depth map into levels. In the comparison of runtime, we set the value of from to , and the computations are performed with the images of , , and (1080 p) pixels, respectively. As shown in Fig. 4, the calculation time is proportional to the layer numbers in the layer-based method, while in our method the runtime is invariant (0.07 s for , 0.29 s for , and 0.52 s for 1080 p on average) due to the one-step computation of Eq. (5). So high-speed computation is achieved using our method. All the calculations are implemented on the platform MATLAB R2019a and Intel Core i5-1035G4 CPU (1.10 GHz) with 8.00 GB RAM. The computation performance can be further improved with more advanced hardware.
![]()
Figure 4.Comparison of CGH computation run time between the proposed method and layer-based method.
We further compare the runtime of our CGH calculation in the split Lohmann lens-based diffraction model with the other two fast CGH generation algorithms. One is the novel lookup table (NLUT) method for a point-cloud 3D object,15 and the other is the nonuniformly sampled wavefront recording plane (NS-WRP) method applied to RGBD data.32 We calculate the CGH from the 3D target sampled with pixel numbers of , , and , respectively. The comparison results of runtime are shown in Table 1. It can be seen that our method can achieve a very fast speed of CGH generation, since it only involves three FFTs and three matrix multiplications. The speed of NLUT is quite limited due to the reliance on the repetitive addition of the precalculated fringe patterns. The NS-WRP method utilizes the manipulation of sampling and WRP to accelerate the CGH calculation and have competitive calculation speed. But the requirement of additional calculation of several nonuniform FFTs imposes intrinsic limitations to further improvement of computation speed.
| Pixel numbers | Proposed | NLUT | NS-WRP | Layer-based |
| 512 × 512 | 0.07 | 36.09 | 0.83 | 5.04 |
| 1024 × 1024 | 0.29 | 166.81 | 3.52 | 20.11 |
| 1920 × 1080 | 0.52 | 316.46 | 6.97 | 42.63 |
Table 1. Comparison of CGH generation time (s).
3 Experiments and Results
To evaluate the theoretical performance of the proposed CGH generation method, we first perform the simulation test of the calculation and reconstruction of CGH from two types of 3D targets. In the first type, the target 3D volume is consisted of four multiple patterns at different depths. Figures 5(a) and 5(b) show the gray-scale intensity image and its corresponding depth map of a target 3D volume. Figure 5(c) shows the locally varied virtual phase modulation profile calculated from the depth map using Eq. (8). The depth map contains four depth levels, so it is revealed that the varied phase ramp has four independent parts corresponding to the depth map. In the second simulation test case, we use RGBD data of a 3D scene with much more dense depth as input. The intensity image and depth map are shown in Figs. 5(d) and 5(e). The depth map is quantized to 20 levels instead of the original 256 gray scale to maintain visual acuity. Figure 5(f) shows the corresponding virtual phase modulation profile calculated from the depth map using Eq. (8). In each simulation case, we calculate the complex hologram using our proposed split Lohmann-based one-step computation from Eq. (5). Reconstruction is performed by inverting the hologram generation process, i.e., first Fourier-transforming the hologram to the focal plane of the lens, and then continuing to propagate to the individual desired planes using ASM diffraction calculation. Figures 5(g) and 5(h) show the reconstructed results at four different planes spaced 8 mm apart centered from the focal plane of the Fourier lens. We can observe that the desired content is correctly focused at their given depth when the rest parts become blurred. The simulation results with more quantitation level of the depth map are presented in the following section. As a comparison, Figs. 5(i) and 5(j) show the simulated reconstructions from the CGH that are calculated using the conventional layer-based method.21,22 We set the number of depth layers from the RGBD data. For the simulation results in Figs. 5(g) and 5(i), we perform the quantitative evaluation by calculating the root-mean-square (RMS) and peak signal-to-noise ratio (PSNR) between each focused letter and the metric letter in the target RGBD image. The values are marked in Figs. 5(g) and 5(i). We can see that the reconstruction quality of our method is slightly lower than that of the layer-based method. As we mentioned before, in the calculation, the translation of two virtual cubic phases introduced an additional linear phase term to the CGH, leading to an unwanted lateral shift of the reconstructed image. So for the 3D target, the images are reconstructed along a direction which has a very small angle with the optical axis ( direction). This off-axis reconstruction can be ignored visually, since the shift amount is very small, but actually brings artifacts in the reconstruction. The magnified details of the reconstructed letter “A” in both methods are plotted in Figs. 5(g) and 5(i). From the details we can find more artifacts in the reconstruction of letter patterns by our method. Nonetheless, our method can still achieve acceptable reconstruction quality while having a significantly faster computational speed.
![]()
Figure 5.Numerical reconstructions of split Lohmann CGH and layer-based CGH. (a)–(c) The intensity image, depth map, and locally varied virtual phase of the multiplane 3D model “ABCD.” (d)–(f) The intensity image, depth map, and locally varied virtual phase of the 3D model “cars.” The depth map is quantized to 20 levels. (g), (h) The simulated reconstructions from the split Lohmann CGH. (i), (j) The simulated reconstructions from the layer-based CGH. The RMS and PSNR values are evaluated for each focused letter to quantitatively measure the reconstruction quality.
Experimental demonstration is necessary to further concretely validate the proposed high-speed CGH generation method. Our experimental setup is shown in Fig. 6(a). We integrated a relay system and a Fourier holography setup into the path of a laser beam providing coherent illumination at a wavelength of 532 nm and collimated on a reflective liquid crystal on silicon SLM (Holoeye LETO, ). The laser source is linearly polarized to the axis (horizontal) to match the incident polarization of the SLM. A beam splitter splits the collimated beam and directs it toward the SLM. In order to display a phase-only CGH on the SLM, we extract the phase component from the complex amplitude of the hologram calculated by Eq. (5). After SLM modulation, the hologram wavefront is first relayed by a relay optical configuration, where the undiffracted light beam is reduced with a reverse pinhole made by depositing a 2 mm black dot in the center of an optical flat. The output wavefront of the relay configuration is then reconstructed through an achromatic Fourier lens. To record the 3D volumetric intensity generated, 2D images are captured at varying depth planes after the Fourier lens while moving a CMOS sensor axially within the target 3D volume. The temporal multiplexing method is used to weaken the speckle noise33 by sequentially loading 20 phase-only CGHs at a 60 Hz rate. Figures 7(a)–7(d) show the results when the CMOS sensor is axially moved at , , , and , respectively. The optical results are in good agreement with the simulation ones presented in Figs. 5(g) and 5(h). We can observe the in-focus and out-of-focus contents of the reconstructions in each case and correctly experience clear and blur changes, confirming that the CGHs generated rapidly by our method can provide correct focus cues for these 3D targets.
![]()
Figure 6.Experimental results of monochromatic holographic 3D display. (a) Optical setup. (b)–(e) Optical reconstructions of 3D objects recorded by axially moving the CMOS sensor.
![]()
Figure 7.Experimental results of full-color holographic near-eye display. (a) Schematic of holographic near-eye display prototype. An eyepiece lens is employed to magnify the 3D images, which are then recorded by adjusting the focus of the camera lens. (b)–(e) Two examples of RGBD input for the calculation of split Lohmann CGHs. (f)–(k) Experimental results of three focal sweep records when the camera is focusing on 2.5D, 1.0D, and 0D, respectively.
We further build another type of full-color holographic near-eye display prototypes for CGH testing. The optical setup is shown in Fig. 8. The SLM is synchronized with a Fisba RGBeam fiber-coupled laser diode. The laser consists of three precisely aligned diodes operating at 450, 520, and 638 nm and provides per-diode power control. The fiber-coupled laser is mounted using a ferrule connector/physical contact adapter, placed at the front focal plane of an lens that results in an expanded and collimated illumination beam on the SLM. The CGHs for red, green, and blue channels are calculated separately using the proposed method under different wavelength values and displayed on the SLM sequentially for color mixing.34 The time sequence of the SLM display is synchronized with the fiber-coupled laser diode using the transistor–transistor logic signal. The reconstructed color 3D images are photographed using a color camera (mounted with a 35 mm focal length C-mount camera lens) with a resolution of to mimic the human eyes. An additional eyepiece lens () is placed before the camera to magnify the reconstructed 3D images. The temporal multiplexing method is also used for speckle noise suppression. The parameters related to the CGH calculation including an eyepiece are discussed in the Supplementary Material. Figure 9 shows the captured color 3D images with focus and defocus cues. The distances for nearest and farthest contents are 2.5D (diopter) and 0D from the camera. The experimental photographs show that our system successfully deliver 3D contents with natural accommodation cues and therefore outperforms the current holographic 3D display techniques in terms of fast CGH generation algorithms.
![]()
Figure 8.Performance of image shift in CGH reconstruction. (a) Variation of shift along with the value of depth when fixing
![]()
Figure 9.Performance of split Lohmann CGH with different quantization levels of depth map. The depth map is quantized into levels of
4 Discussion
4.1 Effect of the Undesired Lateral Shift
From Eq. (4), we notice that while the translation of the two virtual cubic plates produces a quadratic phase for depth control, it also introduces a linear phase term as , which corresponds to the tilted angle of , so the amount of the unwanted lateral shift in the reconstruction of Fourier plane is calculated by as
As the depth information will affect the slope of the phase profile, so large depth will lead to a large shift. Figure 8(a) shows that the shift increases with the depth of when fixing the value of . However, it is possible to avoid this by reducing as well to cancel the increase of , which is proved in Fig. 8(b) when the depth of is fixed by varying the value of .
4.2 Quantization Level of Depth
Depth resolution is controlled by the precision at which we can implement phase ramps in the virtual split Lohmann lens in the CGH calculation. As a coarse approximation, this is bounded by the number of quantization levels available in addressing the depth map of the target 3D volume, which is typically 8 bits; this sets a maximum of 256 depth planes that we can display. Most applications do not need such a large selection. Usually, 50 quantization levels instead of the original 256 (8 bits) levels are enough, since the number of 50 multifocal planes is always required to maintain visual acuity when a point is in focus at the eye.35 In Fig. 9, we perform the simulation of our method in different quantization levels of the depth map. Figure 9(a) shows four cases of the depth map quantized to the level of , , , and , while Fig. 9(b) shows the corresponding phase ramp with locally varied slope. Figures 9(c)–9(e) show the simulated reconstructions when the camera focuses at three different distances (2.5D, 1.0D, 0D). These results share similar accommodation property for all cases of different depth quantization levels. It should be noted that even in the quantization of 256 levels of the depth map, the computation time for generating CGH is the same as that of four quantization levels in our method, exhibiting a pretty fast runtime of CGH computation for very dense depth renderings of target 3D volume for holographic display.
4.3 Analysis of Depth Control and Limitations of Diffraction Model
We first provide a detailed breakdown of wavefront modulation and propagation in the split Lohmann lens-based diffraction model. This analysis will provide a mechanism to reason about how to achieve the control of depth for each object point through our proposed CGH generation algorithm. Figure 10(a) shows the propagation of light wave from two distinct object points. The image at the plane of P1, consisting of two separate points, is Fourier-transformed to the plane of P2. Due to the virtual cubic phase, the light wave for each point is then spread over a certain area at the plane of P3, denoted as the point spread function (PSF). The light wave of each PSF is modulated by local linear phase ramp to laterally shift its wavefront to the plane of P4, which is the hologram plane. After multiplication with the second cubic phase, the wavefront of each point finally forms an individual fringe pattern. Each fringe pattern functions as the lens with a different focal power. This process can be easily extended to more points for normal RGBD data. The fringe pattern of the lens phase responsible for single-point depth control can be individually dominated by designing a local phase ramp at the P3 plane, without influencing the wavefront from other points. The superposition of lens patterns from all points produces the final hologram. So basically, our method converts the calculation of the propagation and superposition from all the object points one by one into a simultaneous calculation process in a highly parallel way, allowing for fast one-step backward diffraction computation. The key point of our method is the design of a phase profile with spatially varied slope at the plane of P3 to locally modulate the PSF wavefront corresponding to each point, and in turn to adjust the corresponding lens pattern at the hologram plane for the power of independent depth control.
![]()
Figure 10.Analysis of split Lohmann lens-based diffraction model. (a) Illustration of light-wave propagation from two distinct object points, demonstrating that the split Lohmann CGH can control the depth for each target object point. (b) Illustration of the artifacts where the target points are reconstructed at multiple planes due to the overlapping of their PSF at the plane of P3.
The above analysis assumes that the PSF at P3 from each point is totally separate from each other so that the local phase slope can only modulate individual PSF wavefronts without cross talk. However, this is not often the case. For an RGBD image with continuous contents, the object points are always close to each other and overlap occurs between their PSFs at P3. This phenomenon gives rise to a limitation in spatial selectivity for depth. For example, if the depth across points is continuous and smooth-varied, the PSFs coming from the adjacent points can approximately share the same phase ramp and the influence of overlapping can be ignored, which is the case in most of our experiments. However, if there is depth discontinuity or the point is at the depth edge between two regions, the PSF cannot be modulated correctly. Depending on the amount of overlap, the PSF could be modulated by several slope phases, and therefore we might observe that the target point is focused at multiple planes as shown in Fig. 10(b). Nonetheless, these artifacts analyzed for a points source example are less dramatic for scenes with dense textures. We find the artifacts to be innocuous and mildly distracting at best across the scenes that we tested on.
The maximum depth range of the reconstructed 3D images is determined by the parameters of the split Lohmann lens in the CGH calculation. Basically, given the pixel pitch at the plane of P3 as , the phase gradient cannot exceed in order to avoid the aliasing effect. This constrains
Combining Eq. (10) with Eqs. (3) and (6), we can bound the depth range of axial displacement as
We can see that a large depth range can be achieved with a large or a more powerful cubic phase (smaller ).
It should be noted that our method does not implement any occlusion cues, since it is a type of “projection” realization of multifocal display, i.e., contents on one depth do not block light from others. However, since holography can multiplex the wavefront coming from any spatial location, it is possible to calculate CGH in the split Lohmann lens-based model for multiplane contents with occlusions. This can be potentially achieved by the calculation of several RGBD data and multiplex their final wavefront at the hologram plane in an optimal design.
4.4 Adaption to Fresnel Holography
It should be emphasized that the use of the split Lohmann lens for multifocal 3D display has been reported by Qin et al.28 In their work, they deploy the optical arrangement of the split Lohmann lens to achieve depth selection and control directly on a traditional display panel. In our work, we convert the light propagation in optically arranged split Lohmann lens system into a whole computational framework, which can achieve fast calculation of wavefront propagation from RGBD data to hologram. Our work on split Lohmann computer holography allows for compact optical configuration where only the SLM and Fourier lens are used for the display of the hologram. Meanwhile, the computation procedure of the split Lohmann lens modulation does not involve aberration, which aris from mis-alignment of physical components that exists in the optical arrangement. More importantly, since the work of Qin et al. is based on spatially incoherent propagation and modulation in the split Lohmann lens, our holographic display depends on diffraction and coherent superposition of light waves; therefore it is possible to further extend to Fresnel holography optics, since the conversion of Fourier holography and Fresnel holography can be implemented by adding a virtual quadratic phase to the wavefront.27 As shown in Fig. 11(a), starting from the Fourier hologram on the SLM, we have the reconstructed image at the focal (Fourier) plane calculated as
![]()
Figure 11.Reconstruction of a split Lohmann CGH in Fresnel holography. (a) Conversion of Fourier holography to Fresnel holography by adding a virtual quadratic phase to the Fourier hologram. (b) Simulated reconstruction from Fourier hologram. (c) Simulated reconstruction from comverted Fresnel hologram.
The phase term in Eq. (13) can be ignored if we only focus on the intensity of the reconstructed image. So Eqs. (12) and (13) state that the addition of quadratic phase term can transform the original Fourier hologram into a Fresnel hologram , which can reconstruct the same image intensity in free-space Fresnel diffraction. Similarly, the image reconstructed at any plane away from the focal plane in the original Fourier holography system will also be translated into a new particular plane along the optical axis. Figure 11(b) shows the simulated reconstruction from the Fourier hologram at the focal plane with , , and . Figure 11(c) shows the simulated reconstruction at the distance of from the Fresnel hologram . These results validate the feasible conversion of Fourier-to-Fresnel model in split Lohmann computer holography. More explorations of split Lohman lens-based Fresnel holography models for compact and lensless holographic display can be considered as future work.
5 Conclusion
We have developed split Lohmann computer holography, a new approach for fast one-step hologram generation. By virtually modulating the light-wave propagation in the split Lohmann lens-based diffraction model using two cubic phases and one depth-dependent phase, the hologram can be generated in a one-step forward diffraction propagation, instead of repeatable diffraction calculations from point-clouds or multi-images in the conventional diffraction-based method. Our method operates with a fixed computation time that is predetermined by the hologram size and independent of the depth quantization levels, and therefore can generate a 3D hologram rapidly with dense depth sampling. We have assessed the proposed method in simulation and an experimental prototype system. Split Lohmann computer holography potentially applies to systems well beyond holographic 3D displays. It provides the ability to sculpt 3D light waves associated with different spatial locations in real time and can be used to multitrap optical tweezers and neural photostimulation.
Chenliang Chang is a professor at the University of Shanghai for Science and Technology. He received his PhD in optics and electronics from Southeast University in 2015. He was a visiting scholar at University of Michigan from 2012 to 2013, and a postdoc associate research fellow at University of Illinois Urbana Champaign and at University of California, Los Angeles, from 2019 to 2020. He is the author of more than 50 journal papers and authored more than 10 patents. His current research interests include computer holography, complex wavefront shaping, 3D display, and computer vision.
Dawei Zhang received his PhD from Shanghai Institute of Optics and Fine Mechanics, Chinese Academy of Sciences, in 2015. He is a professor at the University of Shanghai for Science and Technology. He has published more than 100 journal papers. His research interests include optical imaging and display, micronano optical devices and applications. He is a member of the Ministry of Education and Shanghai Key Lab of Modern Optical Systems.
Biographies of the other authors are not available.
References
[26] A. Lohmann. A new class of varifocal lenses. Appl. Opt., 9, 1669-1671(1970).
[27] J. W. Goodman. Introduction to Fourier Optics(2005).
[28] Y. Qin et al. Split-Lohmann multifocal displays. ACM Trans. Graphics, 42, 57(2023).
[29] L. W. Alvarez. Development of variable-focus lenses and a new refractor. J. Am. Optometr. Assoc., 49, 24-29(1978).

Set citation alerts for the article
Please enter your email address
© Copyright 2018-2021 | Chinese Laser Press. All Rights Reserved 沪ICP备15018463号-20