
Xing Long, Yicheng Hu, Yibing Wang, Changhui Li. Noncontact ultrasound sensing based on Mach–Zehnder homodyne interferometer for photoacoustic imaging[J]. Chinese Optics Letters, 2024, 22(3): 031702
- Chinese Optics Letters
- Vol. 22, Issue 3, 031702 (2024)
Abstract
1. Introduction
Ultrasound (US) sensing and imaging play an important role in various fields, including nondestructive detection in industry and clinical US diagnosis[1,2]. Besides the routine clinical US imaging, photoacoustic (PA) imaging (PAI) is an emerging promising imaging mode that can provide functional imaging information with specific optical absorption[3,4]. Compared to US, which detects the echoed US signal, PAI detects US generated inside the tissues after the objects absorb the energy of electromagnetic pulses. Both US and PAI modalities rely on the detection of US waves, with piezoelectric-based transducers being the most commonly used detectors for the applications. Owing to the significant attenuation of megahertz US in the air, piezoelectric-based transducers require either close contact with the target surface or the application of US coupling medium, such as water.
The requirement of contact presents several limitations in biomedical imaging[5]. First, contact may not be suitable or permissible in certain clinical applications, such as patients with severe skin burns, sensitive skin areas, free flaps, and intraoperative brain vascular detection. Second, with regard to multimodality imaging, the physical contact requirements make it inconvenient to be integrated with other noncontact imaging modalities, including X-ray computed tomography (CT), magnetic resonance imaging (MRI), and other optical imaging modes. Third, it is not suitable to perform free-moving animal studies with a bulky US or PAI system in contact with the animal body. Therefore, noncontact US sensing systems designed for biomedical imaging are greatly desired.
Several techniques have been developed to realize noncontact US sensing, including air-coupled detection and optical detection. For air-coupled detection, high-frequency US is strongly attenuated in air, allowing only low-frequency US (typically less than 1 MHz) to travel a limited distance in the air, so this method is constrained to low-frequency ultrasonic detection[6–10]. In addition, due to a large impedance mismatch, only a tiny fraction of US can pass through the air gap, leading to low system sensitivity. Several noncontact optical interferometric detection methods have been developed to detect US-induced surface vibration, including heterodyne detection and homodyne detection methods[11–28]. The heterodyne detection usually requires frequency shifting of the reference beam through an acoustic-optic modulator (AOM) and complex demodulation circuits. Zhang et al. reported the human laser-induced US imaging with a commercial laser Doppler vibrometer instrument that employed heterodyne detection[18], but the system bandwidth was limited up to 2.5 MHz, much less than the routine clinical US system. Despite the availability of commercial laser Doppler vibrometers with wider bandwidths (), to the best of our knowledge, no works have been reported using these devices for PAI. In contrast, the homodyne detection method employs the interference between the detection beam and reference beam at the same frequency, but it often needs to sacrifice imaging speed to control the system to work at its highest sensitivity. In addition, most of the reported homodyne detectors were demonstrated for PA microscopic (PAM) imaging, which generally requires a high-quality surface to reflect the probe beam. Moreover, noninterferometric photoacoustic (PA) detection techniques, such as speckle pattern analysis[29] and photoacoustic remote sensing (PARS)[30,31], have garnered interest in recent years. However, their ability to resolve the temporal profile of PA signals along the acoustic axis remains limited. Therefore, both US and PAI require a noncontact US sensing method that can work on uneven surfaces with high sensitivity and wide bandwidth.
Sign up for Chinese Optics Letters TOC. Get the latest issue of Chinese Optics Letters delivered right to you!Sign up now
In this study, we demonstrate a noncontact ultrasound sensing (NCUS) method based on a Mach–Zehnder homodyne interferometer with zero-crossing triggering. The system utilizes a long coherent laser to allow the detection of light scattered from a dynamic range of optical path length differences on rough surfaces[24]. The estimated noise equivalent pressure (NEP) was calculated to be nearly 730 Pa at around 5 MHz and the bandwidth reached 1 to 8.54 MHz at . By using the developed noncontact US sensing detector scanning as a linear array in a PA computed tomography (PACT) system, we successfully imaged crossed hairs and leaf vein skeleton with phase correction. The noncontact PACT system shows great potential in future practical applications of US sensing and PAI.
2. Materials and Methods
2.1. Noncontact US detection method
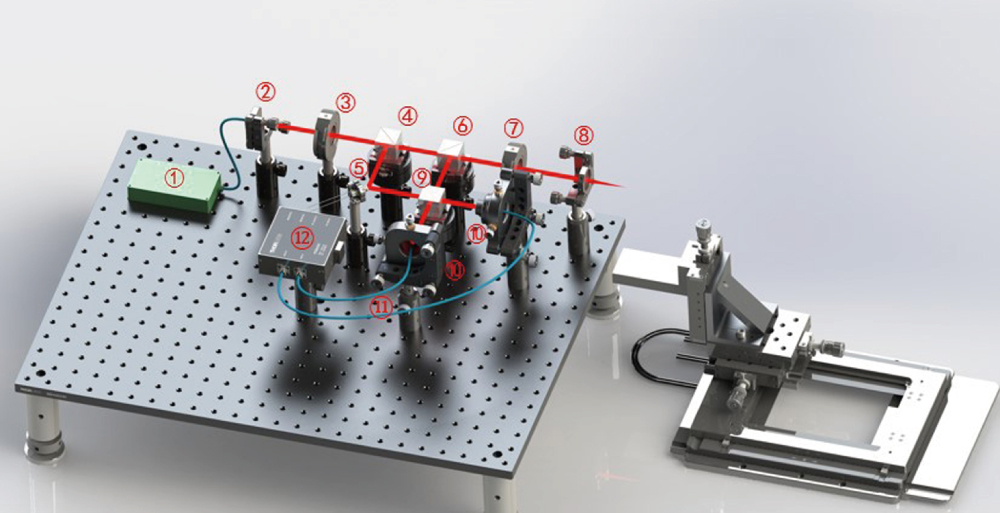
The schematic of noncontact US detection system setup is shown in Fig. 1. It is based on a Mach–Zehnder homodyne interferometer with zero-crossing triggering. A 1550 nm continuous long-coherent laser with narrow intrinsic linewidth and ultralow low-frequency noise (PPCL550, Pure Photonics; linewidth, 10 kHz; output power, 20 mW; stability of wavelength, ) was used as the probe beam. The corresponding coherence length of the laser was calculated to be 9.54 km, allowing a constant high sensitivity of the noncontact system[32] in a large dynamic range of optical path length difference. It is more suitable for actual natural rough surfaces[24] and significant geometric fluctuations on the surface of the human body. A half-wave plate (WPF2212-1550-M25.4, Union Optic, China) and a custom-made polarization beam splitter were combined to adjust the light intensity ratio of the reference arm and detection arm. In the reference arm, a mirror was attached to piezoelectric stacks, so the vibration frequency and amplitude of the mirror can be changed by adjusting the voltage and frequency applied to the piezoelectric stacks. The maximum vibration frequency of the piezoelectric stacks to drive the mirror can reach 1 kHz, which can significantly accelerate the acquisition time of detection system. In the detection arm, the combination of polarization beam splitter and quarter-wave plate was used as an optical isolator (OIS9012-780, Union Optic). A convex lens with 40 mm focal length slightly focuses light on the surface of detecting objects. The interfered beam was divided into two ways to enter the balanced photodetector (PDB435C, Thorlabs) through fiber collimators (AFC110PC-1550, Union Optic) and the optical fibers (DH-FMM400-FC-1C, Daheng Optics, China). The balanced photodetector can effectively suppress common mode noise and provide high signal gain.
![]()
Figure 1.Schematic of noncontact US detection system.
When no US waves are present, the interference signal is mainly the low-frequency disturbance signal induced by environmental factors, including environmental vibration, room temperature fluctuation, and air flow. With US waves existing, the interference signal is modulated by the target’s surface vibration displacement. The relationship between displacement of surface vibration and the US pressure can be presented as[33]
From Eq. (4), the sensitivity of detected light intensity varies with the ambient environment. Only at the zero-crossing point, in which , does the detection system work at the highest sensitivity.
2.2. Noncontact PACT method
Figure 2 illustrates the complete setup of the noncontact PACT system. A short-pulsed 532 nm laser (IS811-E, EdgeWave, Germany; pulse width, 7 ns; single-pulse energy, 5 mJ) was employed to excite the PA signal. A photodiode (DET10A/M, Thorlabs) received part of the light separated by a beam splitter to synchronize the signal acquisition. The two-axis motor stage (MS-2000, Applied Scientific Instrumentation) was used to scan the sample along the axis. The signal detected by the balanced photodetector was split into two pathways. One was detected by a field programmable gate array (FPGA) development board (Cyclone IV AX515, Altera) for detecting the zero-crossing point of the low-frequency signal induced by environmental disturbances, generating a 5 V transistor–transistor logic (TTL) voltage signal to trigger the pulsed laser. The other pathway was utilized for the acquisition of the PA signal. The low-frequency noise caused by environmental disturbance was filtered by a 0.75 to 10 MHz bandpass filter. Then the acquired PA signal was recorded by a data acquisition (DAQ) card with a sampling rate of 200 MHz (CompuScope 14200, Gage, Canada, 14-bit). The translation stage and acquisition card were controlled by LabVIEW software.
![]()
Figure 2.Noncontact PACT system setup. NDF, neutral density filter; HWP, half-wave plate; PBS, polarization beam splitter; M, mirror; BS, beam splitter; QWP, quarter-wave plate; L, lens; FC, fiber collimator; OF, optical fiber; BPD, balanced photodetector; PD, photodiode; DAQ, data acquisition card.
3. Results
The sensitivity of the noncontact US detection system was measured by a calibrated commercial 5-MHz US transducer (Panametrics-NDT V310, Olympus NDT), as shown in Fig. 3(a). During the calibration, the transducer was driven by a pulser-receiver (5072PR, Olympus) to generate the US wave in a water tank, and the US signal was received using a commercial hydrophone (HGL-1000, ONDA) first, to measure the pressure amplitude of the US signal. Then the US transducer was placed at the same distance from hydrophone to excite the noncontact US detection system, causing surface vibrations on a thin polyethylene film window with a customized reflective tape[19]. As shown in Fig. 3(a), the tape is made of a layer of tiny spherical glass beads with an average diameter of 40–50 µm partially embedded in a polymer layer, which can significantly enhance the light reflection[34]. The detected US temporal signal by the noncontact US detection system is shown in Fig. 3(b), with its corresponding frequency spectrum. No averaging was performed during measurement. The center frequency of the spectral response is around 2 MHz with a bandwidth of 0.4 to . We suspected the lowered central frequency is due to the reflective tape that contains multilayer materials, which acts like a low-pass filter. The signal-to-noise ratio (SNR) without averaging was about 23 dB, and the NEP was calculated to be 703 Pa through dividing the SNR by pressure amplitude of the US signal.
![]()
Figure 3.Sensitivity determination of NCUS system. (a) Schematic of sensitivity determination (including the microscopic view of the reflective tape); (b) temporal and corresponding frequency response curve of NCUS system to 5 MHz US through a 0.75–10 MHz bandpass filter.
To investigate the bandwidth of the system, a short-pulsed laser (ns) was employed to excite a 20 µm-thick polyethylene wrap film to generate a broadband PA signal, as shown in Fig. 4(a). A water tank was wrapped with film on both sides and filled with deionized (DI) water. The probe beam detected the PA signal on the other side of the phantom, where the reflective tape was not used. Figure 4(b) shows the detected PA time-domain signal and the corresponding frequency spectrum. The frequency spectrum is normalized to the peak value of about 4 MHz, showing that the bandwidth is 1–8.54 MHz at .
![]()
Figure 4.Schematic of PA signal response and bandwidth. (a) Schematic of laser-induced ultrasound (LUS) signal response of 20 µm thick black polyethylene wrap film; (b) detected PA time-domain signal and corresponding frequency-domain response of NCUS system.
Next, PAI was performed using the noncontact US detector to receive the PA signal. The system setup is shown in Fig. 5(a), in which a pulsed laser with 532 nm wavelength and a high repetition rate was used to excite the imaging sample. Instead of scanning the probe beam over the target, as shown in Fig. 5(a), we emulated a linear array US probe by moving the excitation beam with the imaging target in a water tank using a translation stage while keeping the probe beam stationary. The element size of the “equivalent linear array” is the size of the optical focal point, which is about 64 µm in diameter, and the pitch equals the scanning step size. The reflective tape was used to enhance the reflected light. To evaluate the axial resolution of the noncontact PACT system, a human hair phantom was used. The hair was immersed in the water tank at a depth of approximately 5 mm and was positioned parallel to the array alignment. Using a 20 µm step size, we assessed 1000 points, completing the imaging in around 300 s. Although the maximum acquisition rate of the system is limited by both pulse repetition rate of the excitation laser and the vibration rate of the piezoelectric stack, in order to have a higher pulse energy of the laser, the piezoelectric stack was not used during experiments.
![]()
Figure 5.(a) Schematic of PACT experiment by NCUS; (b) original signal of the 1000 detection elements with phase correction and 2 MHz high-pass filtering; (c) reconstruction results of one human hair with phase correction; (d) axial resolution of NCUS system is about 300 µm; (e) original signal of the 1000 detection elements with 2 MHz high-pass filtering without phase correction; (f) reconstruction results of one human hair. Scale bars: 2 mm.
As the phase of PA signal could vary at different zero-triggering points when the ambient environment has a large vibration, which may influence the beam forming in PA image reconstruction, the phase of the PA signal is adjusted to remain constant between consecutive recordings. In scenarios where phantoms or biological tissues display intricate patterns, a human hair can be strategically placed on the complex phantom to aid in the process of phase correction. The raw data obtained from the array after correction of phase and 2 MHz high-pass filtering is shown in Fig. 5(b); the corresponding reconstruction result is shown in Fig. 5(c). The PA image was reconstructed using a delay-and-sum reconstruction algorithm. The lateral resolution, determined through fitting the edge spread function extracted from the yellow profile of Fig. 5(c), was measured to be approximately 500 µm. Figure 5(d) displays the reconstructed PA value along the red line, revealing an axial resolution of approximately 300 µm. The raw PA data received before phase correction is shown in Fig. 5(e); the corresponding reconstruction result is shown in Fig. 5(f). The phase misalignment caused errors in reconstruction results.
Then two phantoms with more complex structures, a crossed hair and a leaf skeleton phantom, were imaged using the noncontact PAI system. Both phantoms were positioned in the water tank. The excitation laser energy reaching the sample surface was about 3 mJ, and the area of the laser spot was about . For imaging the crossed hair phantom, a step size of 200 µm and points number of 100 were used, with an average of 20 times at each point. The acquisition time was about 20 s. The PA image reconstruction results of crossed hair correspond well with the photograph, as shown in Figs. 6(a) and 6(b), respectively. Next, a leaf vein skeleton was imaged. The photograph of the leaf vein skeleton and the corresponding reconstructed PA image are shown in Figs. 6(c) and 6(d). Because of the small size of the excitation light spot, only a small area of the main vein and one branch were illuminated; other small branches could not be reconstructed because of the weak and high frequency of the PA signal. The photograph of the leaf skeleton corresponds well with the main vein of the reconstructed image.
![]()
Figure 6.(a) Photograph of the crossed hair; (b) image reconstruction results of the crossed hair after passing through 2 MHz high-pass filter; (c) photograph of leaf vein skeleton; (d) image reconstruction results of leaf vein skeleton after passing through 1 MHz high-pass filter. Scale bars: 1 mm.
4. Discussion and Conclusions
In this study, we proposed a noncontact US detection system based on a Mach–Zehnder homodyne interferometer. The system uses a long-coherent laser with narrow intrinsic linewidth to realize long-distance detection on a rough object surface. The sensitivity reaching up to 703 Pa at around 5 MHz and bandwidth up to 1–8.54 MHz have shown significant improvement compared to previous noncontact PACT systems[17,18], and the improvement of bandwidth will bring more important significance to the system’s clinical application. The scanning of the detection beam performed as an acoustic linear array to achieve PACT and imaging reconstruction. Furthermore, the proposed phase correction method effectively addressed the issue of a possible phase change in homodyne interferometric systems, thus providing a solid foundation for accurate PACT reconstruction.
There are several potential improvements and extensions that can be built upon the current system and methods presented in this work. In future research, first, as the mechanical properties of the reflective film may affect the detection bandwidth of the system, acting as a low-pass filter when US-induced vibrations propagate to the surface of the imaging target, one possible approach to mitigate the impact could be the application of a retroreflective spray material on the skin surface. One type of retroreflective spray contains similarly sized glass beads as retroreflective tape which is thinner and lacking the additional polymer layer. This could not only enhance the reflective efficiency but also potentially reduce the effects of the acoustic impedance mismatch and acoustic damping associated with reflective tape. Another type of retroreflective tape resembles thin paint with a lighter color, which can significantly increase the reflectivity of the skin surfaces. Second, all experiments in this work are performed in a water bath. Future work will focus on phantoms, small animals, and human skins. The detection light spot will be systematically scanned point-by-point across the entire detection surface using a scanning galvanometer to acquire three-dimensional PA data. In addition, a highly optically absorbing medium can be applied onto the surface of the imaging target to be illuminated by a pulsed laser with strong absorption at the specific wavelength, so the laser-induced US can be excited on the surface of the imaging target and the penetration depth of probe beam can also be minimized. By adjusting the laser wavelengths, co-registered PA tomography and laser-induced US imaging can be achieved, which is important for dual-mode US/PA tomography in the clinical field.
References

Set citation alerts for the article
Please enter your email address
© Copyright 2018-2021 | Chinese Laser Press. All Rights Reserved 沪ICP备15018463号-20