
Daoqian Yang, Zhongjiang Chen, Da Xing. A novel needle probe for deeper photoacoustic viscoelasticity measurement[J]. Chinese Optics Letters, 2022, 20(8): 081701
- Chinese Optics Letters
- Vol. 20, Issue 8, 081701 (2022)
Abstract
Keywords
1. Introduction
The elastic and viscous characteristics of biological tissues are important parameters to reflect the biomechanical properties, and we can detect changes in biomechanical properties to reflect the degree of tissue pathology[
Through the ultrathin needle probe, optical coherence tomography (OCT) can obtain three-dimensional structural or functional information of tissues and organs deep inside the organism in a minimally invasive way[
In this Letter, we present a minimally invasive needle probe (outside diameter, 0.7 mm) for deeper photoacoustic viscoelasticity (PAVE) measurements. A set of gelatin phantoms and biological tissues validated the feasibility of this needle probe. Meanwhile, experimental results from in vivo animal models provide great potential for tumor boundary detection deep inside biological tissues in medical applications.
Sign up for Chinese Optics Letters TOC. Get the latest issue of Chinese Optics Letters delivered right to you!Sign up now
2. Methods
When an intensity-modulated continuous laser is utilized to excite absorptive isotropic viscoelastic materials, light intensity is modulated in the form of
Depth-resolved PAVEI used to be performed by a spectral domain low coherence interferometry (SDLCI) device[
![]()
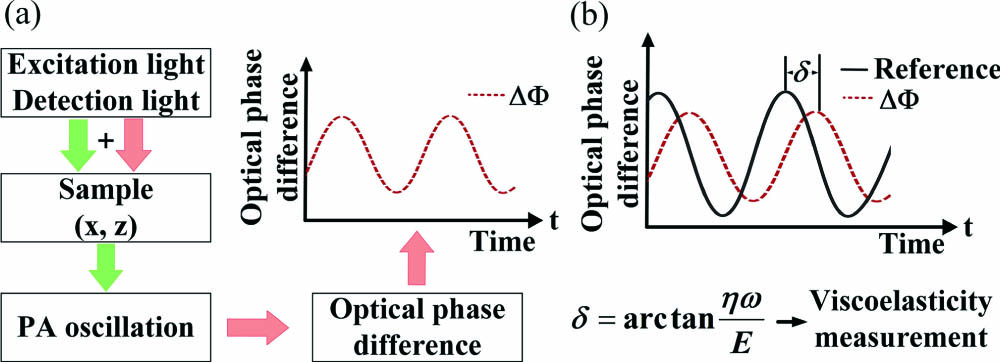
Figure 1.(a) Diagram of the optical phase difference oscillation process induced by PA excitation. ΔΦ is the optical phase difference oscillation curve at the (x, z) position within the sample. The green and red arrows represent excitation and detection lights, respectively. (b) Extraction of viscosity-elasticity ratio at the (x, z) point.
Figure 2(a) illustrates a schematic diagram of the needle probe, which includes a needle (0.7 mm outer diameter) with a side output window, a customized prism (45° reflection angle), a GRIN lens (0.5 mm diameter and 1.5 mm focal distance), a single-mode fiber, and a capillary tube. The GRIN lens was used to focus the output laser and collect the returned detection light. The prism was used to reflect the laser to excite the tissue. The prism and the GRIN lens were bonded with an ultraviolet (UV) adhesive that is interfaced with a single-mode fiber, and the fiber was inserted into a capillary tube to ensure maximum collection of scattering light. Then, the probe is encased within a 22 G needle. An image of the assembled needle probe is shown in Fig. 2(b). After the above process, the needle probe was installed on the motorized pull-back stage assembly and connected to the sample arm of the SDLCI system. Figure 2(c) shows the schematic layout of the SDLCI system. A continuous pump laser at 532 nm is being modulated by a chopper (MC2000B, Thorlabs), which is coupled to a wavelength division multiplexer (WDM, WD202A2-FC, Thorlabs) by a multimode fiber. In the SDLCI system, the light source is a super luminescent diode (SLD1325, Thorlabs) with a central wavelength of 1325 nm and a full width at half-maximum (FWHM) bandwidth of 94 nm. The measured axial resolution is 11.7 µm in air. After passing through an isolator, the light was coupled to a 50/50 fiber coupler and was separated into a reference arm and sample arms. Simultaneously, the excitation beam is coupled to the sample arm via a WDM and then coupled to a needle probe. The interference light signal is detected by a homemade spectrometer, which includes a collimator, a spectro-grating (1145 lines/mm), a doublet lens, and a line scan CCD (GL2048R, Sensors Unlimited). In order to enable SDLCI detection and PA excitation at the same time, the output signal of the chopper is used for the trigger signal of the data acquisition card (DAQ, PCIe-1433, National Instruments). For maximum suppression of the jitter of the external environment, the entire system is placed on an air-floating optical platform. A phase-sensitive method was adopted to obtain the phase sensitivity of the system. We measured three thousand A-lines using a static mirror as a sample to obtain the phase deviation. The phase sensitivity of the SDLCI system was measured as 9.1 mrad; this is equivalent to a displacement sensitivity of 949 pm, as shown in Fig. 2(d).
![]()
Figure 2.(a) Schematic design of the needle probe. GRIN lens, gradient-index rod lens; SMF, single-mode fiber. (b) Picture of the assembled 0.7 mm needle probe with the side window. (c) Layout of the experimental setup. O1–O4, objective lenses; C, chopper; WDM, wavelength division multiplexer; PC1, PC2, fiber polarization controllers; FC, fiber coupler; C1, collimator; M, mirror; DAQ, data acquisition system. (d) Measured phase histogram of the static reflector of the SDLCI system with standard deviation σ = 0.0091 rad.
3. Experiments
To verify the feasibility of needle depth PAVE measurement, a set of gelatin phantoms was prepared. The schematic diagram of the gelatin phantoms is illustrated in Fig. 3(a). The gelatin phantoms were made with a mixture of Indian red ink, intralipid solution, distilled water, and gelatin powder. Indian red ink (0.2%) was applied to supply optical absorption, and intralipid solution (0.3%) was used to increase light scattering to improve the signal-to-noise ratio (SNR). The gelatin powder concentrations of the three gelatin phantoms were 45% (), 33% (), and 14% (). These phantoms have the same optical absorption coefficient but different viscoelasticity, which were stacked together to form two boundaries. After completing the above process, the experiment was carried out. The needle probe was inserted in the phantoms along the black dotted line over a distance of 15 mm, with a speed of 0.05 mm/s and a discrete step of 0.2 mm. Three-cycle phase oscillation curves for all depths were acquired by intensity-modulated continuous laser-induced PA oscillations at 1000 A lines at each excitation position (M-mode) with the SDLCI system. Figure 3(b) illustrates the optical phase oscillation curve and the extraction process of the mechanical phase delay at the positions marked with three black arrows in Fig. 3(a). The phase delay of the three optical phase oscillation curves is calculated by the method of quadrature demodulation with the reference curve[
![]()
Figure 3.(a) Schematic of gelatin phantoms. (b) Three optical phase difference oscillation curves at the three black arrows marked in (a). (c) Distribution of mechanical phase delays along the needle insertion path. M, the average of mechanical phase delay. (d) Comparison of trends between internal friction angle obtained with the rheometer and mechanical phase delay measured with the PA needle for phantoms.
To illustrate the ability of the needle probe to detect the phase delay of different biological tissues and to distinguish tissue interfaces by different biomechanical properties, we validated it with porcine muscle and myocardium. PA excitation and SDLCI detection were performed during the slow insertion of the needle probe into the tissue. Figure 4(a) presents the distribution with mechanical phase delays along the needle probe trajectory. The average phase delay for muscle is 64°, which is higher than the 44° for myocardium. As we expected, it is clear that there is significant phase delay variation tendency between muscle (1–5 mm) and myocardium (5–10 mm), which indicates that muscle has greater viscoelasticity than myocardium. Further, the accuracy of the results was verified by a rheometry (MARS III).
![]()
Figure 4.(a) Distribution of mechanical phase delays along the needle insertion path. M, the average of the mechanical phase delay. (b) Comparison of trends between the internal friction angle obtained by the rheometer and the mechanical phase delay measured by the PA needle for muscle and myocardium of porcine.
Figure 4(b) shows the statistical results of the mechanical phase delay and the internal fraction angle. As can be seen, both have the same variation tendency, indicating that the needle probe has the ability to distinguish mechanical contrast and determine biological tissue interfaces.
Next, to further illustrate the ability of the needle probe to detect tumor interfaces in vivo, we used a nude mouse model of hepatocellular carcinoma (HCC). A mouse model of HCC was established by injecting a Hepg-2 tumor cell suspension (0.1 mL, ) into the normal tissue of the mouse leg. The mouse was deeply anesthetized with a single dose of pentobarbital and secured on a platform. Then, the needle probe was inserted at 0.05 mm/s under ultrasound guidance and advanced toward the tumor border. Figure 5(a) shows an ultrasound image of the tumor and surrounding normal tissues captured during needle insertion, with the probe running from right to left about 1 cm below and parallel to about 1.5 mm of the mouse’s leg surface. The tumor mass presents as a hypoechoic region in the image, which indicates that the contrast between the tumor and the surrounding normal tissue is high, and the tumor interfaces can be clearly identified. The blood in the tissue provides light absorption, and PA oscillations are detected by the SDLCI system. When the needle passes through the tumor interfaces, the mechanical phase delay decreases significantly, as shown in Fig. 5(a). This suggests that the tumor may be stiffer than the muscle. The average phase delays of muscle and tumor are 49° and 28°, respectively. To verify the accuracy of the results, we measured the internal fraction angle of the tissues using a rheometer (MARS III), which agrees well with the mechanical phase delay in Fig. 5(b). According to the variation tendency of the mechanical phase delay between the tumor and surrounding normal tissue, we can clearly distinguish the tumor interfaces in deeper tissues.
![]()
Figure 5.(a) Sonogram captured with an ultrasound-guided needle in mouse tissue. (b) Distribution of mechanical phase delays along the needle insertion path. M, the average of mechanical phase delay. (c) Comparison of trends between the internal friction angle obtained with rheometer and the mechanical phase delay measured with the PA needle for normal tissue and tumor.
4. Conclusion
In summary, we have developed and demonstrated a PAVE measurement needle probe that allows the characterization of the viscoelasticity at a depth of 1 cm within the sample. The needle probe combines the techniques of PAVEI and SDLCI. The effectiveness was verified by the detection of gelatin phantoms and in vitro biological tissues. The results show that the needle probe has the ability to characterize the mechanical properties of deep tissues. In addition, the experiment results of the in vivo animal model show that it has great potential for tumor boundary detection. The interference signal is unstable during experiments, mainly due to low SNR and partly due to jitter in the experimental environment. However, the needle probe comprising miniaturized focusing optics consisting of coreless fiber and GRIN fiber may improve SNR and reduce the probe diameter[
In conclusion, we present for the first time, to the best of our knowledge, a needle probe that measures PAVE at a depth of 1 cm below the sample surface. This needle probe opens up a new approach to clinical potential differentiated tumor boundaries through the different viscoelasticity of biological tissues. We believe that this technique can be used to detect tumor boundaries in deeper tissues, such as gliomas or breast tumors intraoperatively.
References
[1] J. F. Greenleaf, M. Fatemi, M. Insana. Selected methods for imaging elastic properties of biological tissues. Annu. Rev. Biomed. Eng., 5, 57(2003).
[2] R. M. Sigrist, J. Liau, A. El Kaffas, M. C. Chammas, J. K. Willmann. Ultrasound elastography: review of techniques and clinical applications. Theranostics, 7, 1303(2017).
[3] D. M. McGrath, N. Ravikumar, I. D. Wilkinson, A. F. Frangi, Z. A. Taylor. Magnetic resonance elastography of the brain: an in silico study to determine the influence of cranial anatomy. Magn. Reson. Med., 76, 645(2016).
[4] W. M. Allen, K. Y. Foo, R. Zilkens, K. M. Kennedy, Q. Fang, L. Chin, B. F. Kennedy. Clinical feasibility of optical coherence micro-elastography for imaging tumor margins in breast-conserving surgery. Biomed. Opt. Express., 9, 6331(2018).
[5] W. M. Allen, L. Chin, P. Wijesinghe, R. W. Kirk, B. Latham, D. D. Sampson, B. F. Kennedy. Wide-field optical coherence micro-elastography for intraoperative assessment of human breast cancer margins. Biomed. Opt. Express., 7, 4139(2016).
[6] R. M. Lerner, S. R. Huang, K. J. Parker. “Sonoelasticity” images derived from ultrasound signals in mechanically vibrated tissues. Ultrasound Med Biol., 16, 231(1990).
[7] M. Fatemi, J. F. Greenleaf. Ultrasound-stimulated vibro-acoustic spectrography. Science, 280, 82(1998).
[8] G. Gao, S. Yang, D. Xing. Viscoelasticity imaging of biological tissues with phase-resolved photoacoustic measurement. Opt. Lett., 36, 3341(2011).
[9] C. Chen, Y. Zhao, S. Yang, D. Xing. Mechanical characterization of intraluminal tissue with phase-resolved photoacoustic viscoelasticity endoscopy. Biomed. Opt. Express, 6, 4975(2015).
[10] P. Wang, Z. Chen, D. Xing. Multi-parameter characterization of atherosclerotic plaques based on optical coherence tomography, photoacoustic and viscoelasticity imaging. Opt. Express, 28, 13761(2020).
[11] Y. Zhao, C. Chen, S. Yang, D. Xing. Mechanical evaluation of lipid accumulation in atherosclerotic tissues by photoacoustic viscoelasticity imaging. Opt. Lett., 41, 4522(2016).
[12] D. Jin, F. Yang, Z. Chen, S. Yang, D. Xing. Biomechanical and morphological multi-parameter photoacoustic endoscope for identification of early esophageal disease. Appl. Phys. Lett., 111, 103703(2017).
[13] Q. Wang, Y. Shi, F. Yang, S. Yang. Quantitative photoacoustic elasticity and viscosity imaging for cirrhosis detection. Appl. Phys. Lett., 112, 211902(2018).
[14] F. Yang, Z. Chen, D. Xing. Single-cell photoacoustic microrheology. IEEE Trans. Med. Imaging, 39, 1791(2019).
[15] S. Du, Z. Chen, D. Xing. Spectral interferometric depth-resolved photoacoustic viscoelasticity imaging. Opt. Lett., 46, 1724(2021).
[16] C. P. Liang, J. Wierwille, T. Moreira, G. Schwartzbauer, M. S. Jafri, C. M. Tang, Y. Chen. A forward-imaging needle-type OCT probe for image guided stereotactic procedures. Opt. Express, 19, 26283(2011).
[17] X. Yang, D. Lorenser, R. A. McLaughlin, R. W. Kirk, M. Edmond, M. C. Simpson, D. D. Sampson. Imaging deep skeletal muscle structure using a high-sensitivity ultrathin side-viewing optical coherence tomography needle probe. Biomed. Opt. Express, 5, 136(2014).
[18] H. Ramakonar, B. C. Quirk, R. W. Kirk, J. Li, A. Jacques, C. R. Lind, R. A. McLaughlin. Intraoperative detection of blood vessels with an imaging needle during neurosurgery in humans. Sci. Adv., 4, eaav4992(2018).
[19] X. Li, C. Chudoba, T. Ko, C. Pitris, J. G. Fujimoto. Imaging needle for optical coherence tomography. Opt. Lett., 25, 1520(2000).
[20] W. A. Reed, M. F. Yan, M. J. Schnitzer. Gradient-index fiber-optic microprobes for minimally invasive in vivo low-coherence interferometry. Opt. Lett., 27, 1794(2002).
[21] Y. Mao, S. Chang, S. Sherif, C. Flueraru. Graded-index fiber lens proposed for ultrasmall probes used in biomedical imaging. Appl. Opt., 46, 5887(2007).
[22] D. Lorenser, X. Yang, R. W. Kirk, B. C. Quirk, R. A. McLaughlin, D. D. Sampson. Ultrathin side-viewing needle probe for optical coherence tomography. Opt. Lett., 36, 3894(2011).
[23] N. Iftimia, J. Park, G. Maguluri, S. Krishnamurthy, A. McWatters, S. H. Sabir. Investigation of tissue cellularity at the tip of the core biopsy needle with optical coherence tomography. Biomed. Opt. Express, 9, 694(2018).
[24] K. M. Kennedy, R. A. McLaughlin, B. F. Kennedy, A. Tien, B. Latham, C. M. Saunders, D. D. Sampson. Needle optical coherence elastography for the measurement of microscale mechanical contrast deep within human breast tissues. J. Biomed. Opt., 18, 121510(2013).
[25] R. A. McLaughlin, B. C. Quirk, A. Curatolo, R. W. Kirk, L. Scolaro, D. Lorenser, D. D. Sampson. Imaging of breast cancer with optical coherence tomography needle probes: feasibility and initial results. IEEE J. Sel. Top. Quantum Electron, 18, 1184(2011).
[26] A. Curatolo, R. A. McLaughlin, B. C. Quirk, R. W. Kirk, A. G. Bourke, B. A. Wood, D. D. Sampson. Ultrasound-guided optical coherence tomography needle probe for the assessment of breast cancer tumor margins. Am. J. Roentgenol., 199, W520(2012).
[27] M. Villiger, D. Lorenser, R. A. McLaughlin, B. C. Quirk, R. W. Kirk, B. E. Bouma, D. D. Sampson. Deep tissue volume imaging of birefringence through fibre-optic needle probes for the delineation of breast tumour. Sci. Rep., 6, 28771(2016).

Set citation alerts for the article
Please enter your email address
© Copyright 2018-2021 | Chinese Laser Press. All Rights Reserved 沪ICP备15018463号-20