
A. Corvino, M. Reimold, E. Beyreuther, F.-E. Brack, F. Kroll, J. Pawelke, J. D. Schilz, M. Schneider, U. Schramm, M. E. P. Umlandt, K. Zeil, T. Ziegler, J. Metzkes-Ng. miniSCIDOM: a scintillator-based tomograph for volumetric dose reconstruction of single laser-driven proton bunches[J]. High Power Laser Science and Engineering, 2024, 12(2): 02000e17
- High Power Laser Science and Engineering
- Vol. 12, Issue 2, 02000e17 (2024)
Abstract
Keywords
1. Introduction
Laser plasma accelerators (LPAs) for protons have progressed to the point where various applications benefiting from the particular source characteristics are pursued as independent research fields[1]. Ultra-high dose rate radiobiology was promoted as a key application for LPA protons early on[2]. LPA proton bunches, with up to
Radiobiological studies and other experiments relying on the generation of application-specific volumetric dose distributions (e.g., material analysis[18]) from single LPA proton bunches call for a reliable method to measure said volumetric dose distributions. For analysis purposes, a volumetric dose distribution is generally divided into lateral components and a depth dose profile, the latter being determined by the spectral components contained in the proton bunch depositing its energy in the sample. In contrast to spectrally stable proton sources such as (radiotherapy) cyclotrons, the inherent bunch-to-bunch fluctuations of the spectral intensity present at LPA proton sources require characterization with single-bunch resolution. The available methods include stacks of radiochromic films (RCFs)[19], ultrasound-based methods[14,15] or the prediction of the depth dose distributions based on a spectral time-of-flight (ToF) measurement[17]. With currently achievable mm-scale spatial dose distributions, sub-mm spatial resolution with a sensitivity of approximately 100 mGy is required, ideally with the capability for approximately Hz repetition rate operation. Plastic scintillators, widely applied for LPA proton detection[20–28], make an ideal candidate for a detector with these properties. They offer an instantaneous light output on the ns-timescale after dose deposition, have a density close to water and can flexibly be applied in shapes adapted to the specific detector setup. Due to their transparency and hence high transmission for their own emitted spectrum, optical scintillators are optimal for tomography methods applied to spatially resolve volumetric distributions.
In this publication, we present the compact and robust miniSCIDOM, a scintillator-based tomograph for the reconstruction of dose distributions generated by single LPA proton bunches. The detector principle is based on emission tomography from a hexagonally shaped scintillator, as prototyped by Kroll et al.[29] for quality assurance at medical proton accelerators. Adaption of the approach to LPA requirements allows for the miniaturization to a reconstruction volume of approximately 1 cm
Sign up for High Power Laser Science and Engineering TOC. Get the latest issue of High Power Laser Science and Engineering delivered right to you!Sign up now
2. Detector design and data processing
2.1. Detector setup
The miniSCIDOM detector (Figure 1) consists of a signal emitting and a signal detecting component and has a footprint of 70 mm diameter and a height of 370 mm. The signal emitting component comprises a plastic scintillator (EJ-200, Eljen Technologies[30]) in the shape of a regular hexagonal prism with 10 mm hexagon side length and a thickness of 11 mm. When ionizing radiation impinges on the scintillator, it emits (luminescent) light (
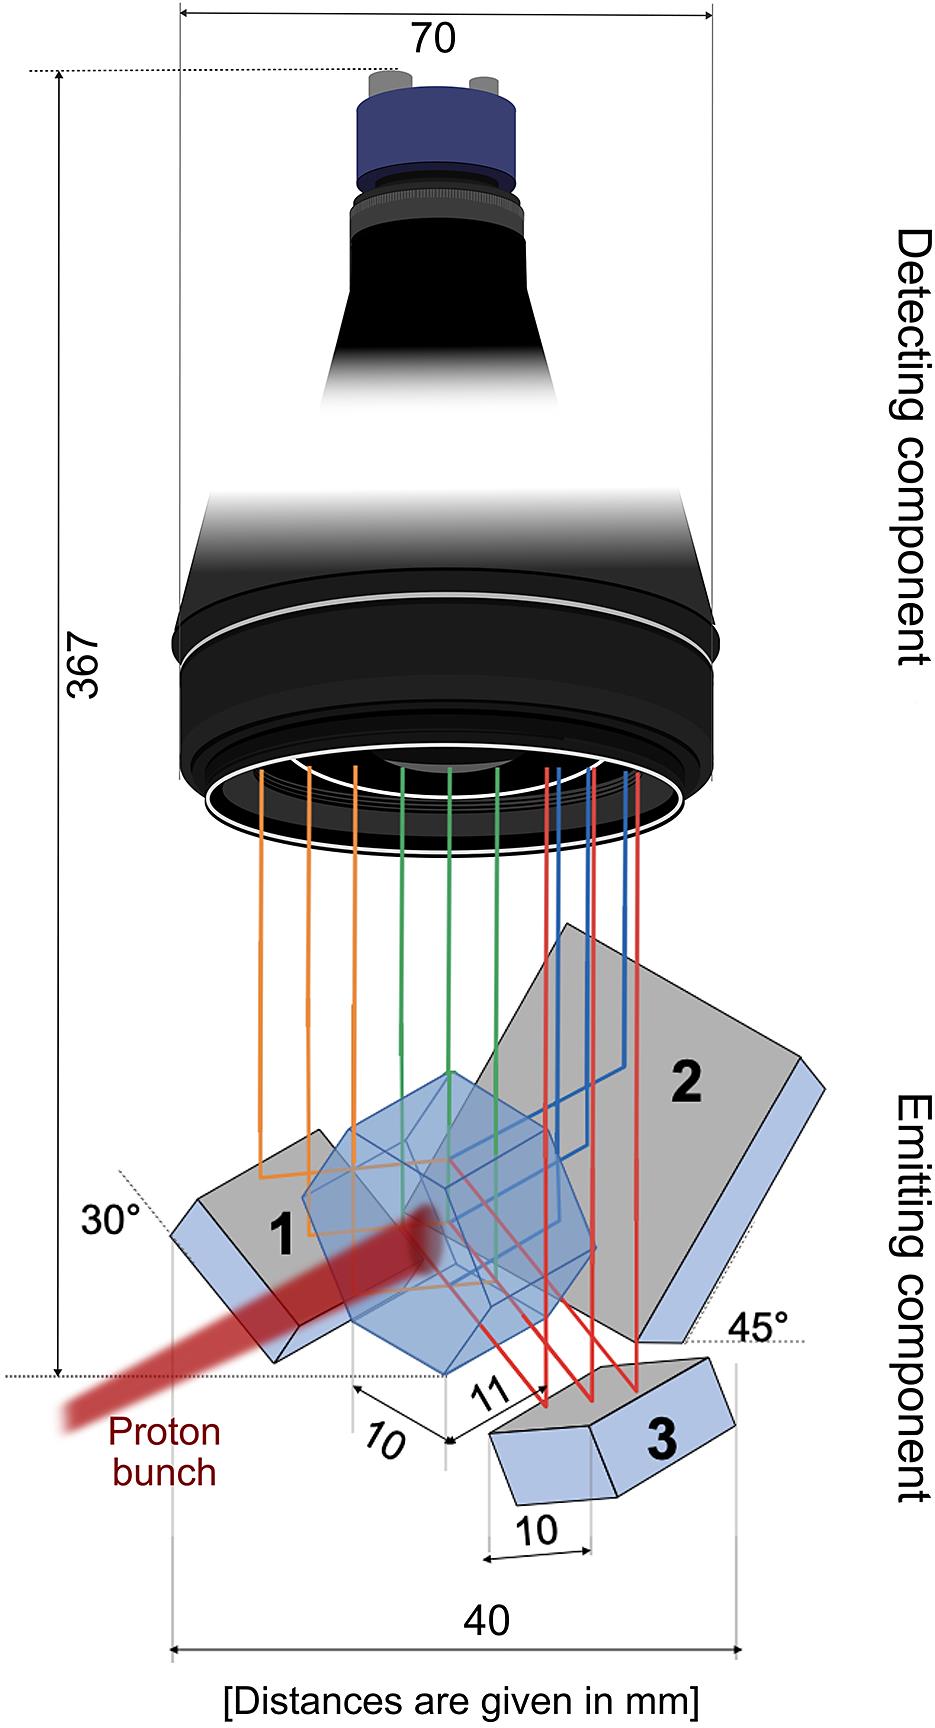
Figure 1.The miniSCIDOM detector consists of a plastic scintillator shaped like a regular hexagonal prism. It is imaged via three mirrors, a bi-telecentric objective and a CCD camera.
The core detecting component is a bi-telecentric objective (TC13056, Opto Engineering), which only accepts rays parallel to its main optical axis and hence images 2D parallel projections of the scintillation light. A charge-coupled device (CCD) camera coupled directly to the objective records a single image containing all four projections. The objective is designed for a fixed object distance of 157.8 mm and features a fixed magnification of 0.084 so that the camera pixel size (approximately 5
2.2. Signal reconstruction
The scintillator and imaging geometry defines three projection angles around the beam axis (0°, 120°, 240°) and a fourth projection along the beam axis. Figure 2(a) shows these four projections recorded in a single camera image. The coloured boxes mark the regions of interest (ROIs) for each projection that contribute to the reconstruction of the volumetric light distribution and define the reconstruction volume. The reconstruction algorithm performs best in the region where all projections overlap (Figures 2(b) and 2(c)), which results in a usable detector aperture of 10 mm diameter. The scintillator length of 11 mm is equivalent to the range of protons with a kinetic energy of 35 MeV.
![]()
Figure 2.Signal reconstruction. (a) False-colour raw data CCD camera image and selection of the different regions of interest (ROIs) for the four projections. The signal outside the ROI for the 0° projection corresponds to the signal imaged through the scintillator hexagon faces adjacent to the scintillator surface analysed for a specific projection. (b) Beam axis view of the scintillator with the lateral projection regions marked. The region where the lateral projections overlap (red hexagonal marking) is the lateral reconstruction area. (c) Volumetric representation of the reconstruction volume.
An iterative algorithm based on maximum-likelihood expectation maximization (MLEM) has been implemented in Python 3 to reconstruct the volumetric light distribution from the imaged projections. The iterative algorithm corrects a predicted volumetric light distribution by comparing the respective predicted projections with the measured projections and by subsequently applying a correction matrix to the predicted light distribution. To estimate the uncertainty for the reconstructed volumetric light distribution, the ratio of predicted and measured projections is used, averaged over all four projections (Figure 2(a)).
The reconstruction itself is preceded by several image preprocessing steps. Firstly, the ROIs (as shown in Figure 2(a)) are selected from the raw images by setting the ROI coordinates manually to correct for displacements or tilts introduced by the detector setup. The projection images are then filtered for noise reduction caused by salt-and-pepper noise (hot pixels) using a median filter (
2.3. Correcting for ionization quenching
The light distribution emitted by a plastic scintillator upon irradiation with an energetic proton bunch is not linearly proportional to the absorbed dose. This results from an effect termed ‘ionization quenching’, which describes the scintillator’s light output dependency on ionization density along the proton track. As the ionization density increases towards a proton’s stopping point, the contribution of non-radiative de-excitation of the scintillator increases, leading to a decrease of light output[31]. Ionization quenching can be quantified by a first-order model by Birks:
When employing plastic scintillators to measure and reconstruct spatial dose distributions generated by protons, ionization quenching needs to be taken into account. Correction for the effect as described by Equation (1) requires prior knowledge of the local LET distribution within the scintillator volume and hence of the proton spectrum generating the respective dose distribution. In general, Monte Carlo (MC) simulations of the incoming proton bunch and the full beam transport at the accelerator setup are required to derive LET values for light output corrections.
![]()
Figure 3.miniSCIDOM depth dose measurements at a proton therapy cyclotron. The data show the miniSCIDOM reconstruction (marked as MS in the legend, light blue), the simulated depth dose curve (red), the radiochromic film (RCF) measurement (green), the simulated fluence-weighted linear energy transfer (LET, pink) and the LET-corrected miniSCIDOM measurement (orange). The depth dose profiles for the miniSCIDOM and RCF are averaged over a circular ROI with 5 mm diameter. All depth dose curves are individually normalized. (a) Pristine Bragg peak (PBP) irradiation of the miniSCIDOM. (b) Spread-out Bragg peak (SOBP) irradiation of the miniSCIDOM.
3. miniSCIDOM characterization at a proton therapy cyclotron
3.1. Experiment
Characterization measurements with the miniSCIDOM were performed at the University Proton Therapy Dresden (UPTD, Dresden, Germany). Here, an experimental hall equipped with a horizontal fixed-beam proton beamline for the isochronous cyclotron Cyclone 230 (Proteus Plus clinical facility, IBA) is available for multidisciplinary research[33]. Besides determining the spatial resolution properties of the detector, a key task of the experiment was to precisely measure the ionization quenching as it affects the reconstruction of volumetric dose distributions. To consider both the case of a locally almost uniform and a locally mixed LET, the miniSCIDOM was exposed to monoenergetic protons generating a pristine Bragg peak (PBP) in the scintillator volume as well as polyenergetic protons forming a so-called spread-out Bragg peak (SOBP). The latter case corresponds to the realistic scenario in which the miniSCIDOM is implemented at the LPA proton beamline[4].
To measure a PBP, protons with a kinetic energy of 90 MeV irradiated the miniSCIDOM after traversing a set of range absorbers (45 mm of polycarbonate (PC) and 5.2 mm of acrylic glass) applied to place the PBP inside the miniSCIDOM reconstruction volume. SOBP measurements used the double-scattering setup described in Ref. [33] to generate a 20 mm wide SOBP from monoenergetic 150 MeV protons, shifted into the miniSCIDOM reconstruction volume by a 90 mm thick PC range absorber. For both setups, a final aperture with 7 mm diameter was placed in front of the miniSCIDOM to restrict the lateral beam profile to the reconstruction volume.
To derive the dose deposition inside the scintillator and the according LET distribution, both irradiation scenarios (comprising the proton bunch parameters and the beamline setup) were modelled using the MC simulation toolkit TOPAS[34]. The simulations were benchmarked against measurements of the final volumetric dose distributions at the miniSCIDOM position using stacks of RCF (type EBT3, GafChromic[35]). For both cases, the fluence-weighted
3.2. Results: ionization quenching
Figure 3 summarizes simulation and experimental results showing the depth dose distributions of the PBP and SOBP and the
Differences between the miniSCIDOM and simulated distribution remain in the entrance region and behind the PBP’s distal edge (depth
3.3. Results: spatial resolution
The spatial resolution of the miniSCIDOM was tested with a perforated aluminium collimator inserted into the proton beam path in front of the detector, generating proton minibeams with 600
![]()
Figure 4.Characterization of the spatial resolution with a perforated aluminium collimator, generating proton minibeams with 600  m diameter and 1 mm centre-to-centre spacing. (a) Measurement with a stack of radiochromic films (RCFs), where representative slices for the top, side and beam axis views are shown. (b) Measurement with the miniSCIDOM detector, where representative slices for the top, side and beam axis views derived from the reconstruction are shown. (c) Comparison between lateral profiles through the top views for the RCF and miniSCIDOM. The profiles are obtained at a fixed depth position (
Besides the minibeam broadening, comparison of the top and beam axis views clearly shows a stronger merging of the individual proton minibeams in the case of the miniSCIDOM. Whereas the signal recorded with the RCF shows a peak-to-valley ratio of 5, it is reduced to 1.6 for the miniSCIDOM (Figure 4(c)). The effect is dominated by scattering of the scintillation light inside the scintillator volume, but a contribution from the limited number of projections available for signal reconstruction cannot be excluded. The lateral spatial resolution of the miniSCIDOM detector does not depend on the spectral distribution of the proton bunches applied and is hence the same for LPA protons.
4. miniSCIDOM operation at a laser plasma accelerator proton source
4.1. Experiment
The miniSCIDOM detector was integrated into the ALBUS-2S beamline[6] operated at the Draco PW high-power laser system at Helmholtz-Zentrum Dresden–Rossendorf[37,38]. Based on the chromatic focusing properties of two pulsed solenoids, ALBUS-2S produces homogeneous mm-scale volumetric dose distributions at an in-air irradiation site from the angular and spectral broadband LPA proton bunch (Figure 5(a)). Spectral filtering apertures and scattering foils finetune the transported proton spectrum to form an application-adapted dose distribution[4]. For the miniSCIDOM tests, single-peak proton bunches centred around 22 MeV with a bandwidth (FWHM) of approximately 10 MeV and a dose of approximately 1 Gy are applied. The bunch duration at the irradiation site is 20 ns, yielding a bunch dose rate of
![]()
Figure 5.miniSCIDOM measurements at an LPA proton source. (a) Experimental setup including the LPA proton source driven by the Draco PW laser system and the ALBUS-2S beamline. A time-of-flight (ToF) spectrometer serves as a spectrally resolving beam monitoring system. (b) Comparison of an RCF stack irradiation with seven proton bunches and the according depth dose simulated based on the seven proton bunch spectra measured by the ToF spectrometer. The error bar associated with the simulated dose represents the sum of the energy uncertainty and proton number calibration uncertainty. The error bar associated with the measured dose represents the calibration uncertainty of 6%. (c) Absolutely calibrated ToF proton energy spectra ( ) for three single proton bunches as prepared by the ALBUS-2S beamline. The error bars take into account the spectral resolution of the ToF spectrometer and the uncertainty of the absolute calibration of the spectra. (d) Comparison of the depth dose distribution inside the miniSCIDOM as predicted based on the measured ToF proton spectra and the measurement with the miniSCIDOM. The error bars for the ToF measurement represent the propagation of the uncertainties in the spectral measurement. (e) For proton bunch 3, the depth dose curves from the miniSCIDOM measurement (MS, light blue) and the ToF-based prediction (blue) are shown. Moreover, the depth dose distribution is simulated including ionization quenching (red), and a correction for ionization quenching (orange) based on the fluence-weighted linear energy transfer (LET, pink) is applied to the miniSCIDOM data.
A scintillator-based ToF spectrometer, installed downstream from all beam shaping elements, is the established spectral beam monitoring device at ALBUS-2S. It provides online transmission measurements of each single proton bunch sent to the irradiation site[17]. A benchmarked workflow for post-processing of the ToF spectra enables the MC simulation-based (FLUKA version 4-0.0[39]) forward-calculation of the depth dose distribution at the irradiation site as resulting from a specific spectral proton bunch distribution[17]. The forward-calculations are benchmarked against measurements of the depth dose distribution with stacks of RCFs, as illustrated in Figure 5(b). Note that the RCF stack was irradiated with seven consecutive proton bunches from the ALBUS-2S beamline to reach a dose level at which the dose uncertainty of the calibrated RCF stacks is reduced to the level of 6%. The forward-calculation based on the individually measured ToF spectra considers each of the proton bunches applied to the RCF stack. The forward-calculation reproduces the measured depth dose distribution well within the dose uncertainty range of the RCF stack measurement, confirming the depth dose prediction capabilities of the ToF spectrometer. It is hence the ideal reference device for miniSCIDOM measurements testing the reconstruction capabilities of depth dose distributions from ultra-high dose LPA proton bunches and ionization quenching in a mixed-LET irradiation field.
4.2. Results: ionization quenching
The miniSCIDOM was placed at the irradiation site behind a stainless steel aperture (8 mm thickness) with 7 mm diameter, matching the irradiated detector volume with its reconstruction volume. Three individual proton bunches differing in spectral shape were consecutively applied to the miniSCIDOM, the according spectra measured with the ToF spectrometer being shown in Figure 5(c). To generate depth dose distributions from the miniSCIDOM measurements, the volumetric scintillation light distributions were reconstructed. The uncertainty of the reconstructed volumetric light distribution amounts to less than 4%. Subsequently, the signal was evaluated along the beam axis (depth direction) and averaged over a lateral circular ROI with 5 mm diameter centred on the beam axis. Figure 5(d) compares the depth dose distributions for the three proton bunches measured with the miniSCIDOM detector with the forward-calculated depth dose distributions based on the spectra in Figure 5(c). For representation, the miniSCIDOM depth dose curves are normalized to the according ToF-measured data. Both curves show a perfect shape agreement within the error bars of the forward-calculation. This result emphasizes the applicability of the miniSCIDOM detector in measuring depth dose distributions at LPA proton sources, down to dose levels of 100 mGy as present in the distal edge region of the dose distributions measured. The lower detection threshold of the detector results from the scintillator’s conversion efficiency to optical emission from deposited energy, the efficiency of the imaging system and the CCD camera’s sensitivity. It is in agreement with the detector’s intended application for radiobiological studies with LPA protons.
It needs to be highlighted that the agreement of the results from miniSCIDOM-measured and forward-calculated depth dose distributions is unexpected according to the findings from the cyclotron measurements, which clearly show the requirement for an ionization quenching correction for the miniSCIDOM measurements. A representative proton bunch is analysed in more detail in Figure 5(e), where the light and dark blue lines reproduce the data for bunch 3 from Figure 5(d). The fluence-weighted
5. Discussion of dose rate effects
Besides presenting the dose reconstruction capabilities of the miniSCIDOM detector, the main result of this study concerns the unexpected ionization quenching behaviour observed at the LPA proton source. In contrast, for the proton therapy cyclotron data, ionization quenching is perfectly described by Birks’ model. Applying similar final energy spectra at both proton sources (i.e., similar proton range in the scintillator) leaves the time dependence of dose deposition inside the scintillator as the main difference between both irradiation setups. At the proton therapy cyclotron, 2 ns long bunches at 106 MHz repetition rate are generated. Here the dose rate range of
The dose deposition dynamics for LPA protons is derived from the ToF measurements and according MC simulations. Figure 6(a) shows the depth-resolved dose application on the ns-timescale for an LPA proton bunch. For the analysis, the scintillator depth is divided into 28 virtual layers and the temporal dose deposition for each layer is evaluated. As expected, lower-energy protons arrive last and deposit the majority of dose in the miniSCIDOM’s entrance region, which hence accumulates the dose over the longest time. From the information encoded in Figure 6(a), the depth-resolved dose rate is calculated as the ratio between 80% of the total absorbed dose per layer and the time it takes for the absorbed dose to rise from 10% to 90% (Figure 6(b)). The peak dose rate achieved inside the scintillator volume is approximately
![]()
Figure 6.Analysis of the dose deposition dynamics at the LPA proton source based on Monte Carlo (MC) simulations for bunch 3 from
The current state of research for ultra-high dose rate irradiation of scintillators is sparse and the topic is to our knowledge mainly discussed in the context of dosimetry and beam monitoring for ultra-high dose rate radiation triggering of the radiobiological FLASH effect[3]. Ref. [40] suggests that a saturation of the scintillator light output at ultra-high dose rate irradiation similar to ionization quenching might happen. According data only exist for electron irradiations and Di Martino et al.[41] have shown for an organic scintillator-based device that saturation sets in above a dose rate of
An effect also discussed in the context of ultra-high dose rates is whether the ultra-high instantaneous flux of protons through the scintillator can lead to an overlap of neighbouring proton tracks. A proton track is here defined as the volume around a single proton path in which the dose is deposited via secondary electrons. The consequences of track overlap include firstly a change in local LET compared to the prediction for a single proton. Secondly, the assumption of independent particles as underlying the MC simulations employed to predict the LET would not be valid anymore. The proton distance for the miniSCIDOM irradiation with LPA protons is estimated based on the depth-resolved proton current (Figure 6(c)) and the scintillator’s response time of
In summary, at this point we cannot explain the experimental observation on altered ionization quenching behaviour at an LPA proton source. However, we hope that the high interest in ultra-high dose rate radiation characterization (from, e.g., the LPA source and FLASH community) will generate further data and hence insight in the near future.
6. Conclusions
The miniSCIDOM detector fulfils the diagnostic requirements arising when employing LPA proton sources for radiobiological studies, that is, a sub-mm spatial resolution for volumetric dose distributions up to approximately 1 cm
With the measured data indicating a linearity of dose deposition in the scintillator and light output, calibration of the device to provide dose values is in principle possible. Furthermore, the observed deviation from expected ionization quenching behaviour suggests the miniSCIDOM as a platform to study ultra-high dose rate effects in plastic scintillators.
References
[1] F. Albert, M. E. Couprie, A. Debus, M. C. Downer, J. Faure, A. Flacco, L. A. Gizzi, T. Grismayer, A. Huebl, C. Joshi, M. Labat, W. P. Leemans, A. R. Maier, S. P. Mangles, P. Mason, F. Mathieu, P. Muggli, M. Nishiuchi, J. Osterhoff, P. P. Rajeev, U. Schramm, J. Schreiber, A. G. Thomas, J. L. Vay, M. Vranic, K. Zeil. New J. Phys., 23, 031101(2021).
[2] S. C. Wilks, A. B. Langdon, T. E. Cowan, M. Roth, M. Singh, S. Hatchett, M. H. Key, D. Pennington, A. Mackinnon, R. A. Snavely. Phys. Plasmas, 8, 542(2001).
[3] N. Esplen, M. S. Mendonca, M. Bazalova-Carter. Phys. Med. Biol., 65, 23TR03(2020).
[4] F. Kroll, F. E. Brack, C. Bernert, S. Bock, E. Bodenstein, K. Brüchner, T. E. Cowan, L. Gaus, R. Gebhardt, U. Helbig, L. Karsch, T. Kluge, S. Kraft, M. Krause, E. Lessmann, U. Masood, S. Meister, J. Metzkes-Ng, A. Nossula, J. Pawelke, J. Pietzsch, T. Püschel, M. Reimold, M. Rehwald, C. Richter, H. P. Schlenvoigt, U. Schramm, M. E. Umlandt, T. Ziegler, K. Zeil, E. Beyreuther. Nat. Phys., 18, 316(2022).
[5] G. Aymar, T. Becker, S. Boogert, M. Borghesi, R. Bingham, C. Brenner, P. N. Burrows, O. C. Ettlinger, T. Dascalu, S. Gibson, T. Greenshaw, S. Gruber, D. Gujral, C. Hardiman, J. Hughes, W. G. Jones, K. Kirkby, A. Kurup, J. B. Lagrange, K. Long, W. Luk, J. Matheson, P. McKenna, R. McLauchlan, Z. Najmudin, H. T. Lau, J. L. Parsons, J. Pasternak, J. Pozimski, K. Prise, M. Puchalska, P. Ratoff, G. Schettino, W. Shields, S. Smith, J. Thomason, S. Towe, P. Weightman, C. Whyte, R. Xiao. Front. Phys., 8, 567738(2020).
[6] F. E. Brack, F. Kroll, L. Gaus, C. Bernert, E. Beyreuther, T. E. Cowan, L. Karsch, S. Kraft, L. A. Kunz-Schughart, E. Lessmann, J. Metzkes-Ng, L. Obst-Huebl, J. Pawelke, M. Rehwald, H. P. Schlenvoigt, U. Schramm, M. Sobiella, E. R. Szabó, T. Ziegler, K. Zeil. Sci. Rep., 10, 9118(2020).
[7] G. A. Cirrone, G. Petringa, R. Catalano, F. Schillaci, L. Allegra, A. Amato, R. Avolio, M. Costa, G. Cuttone, A. Fajstavr, G. Gallo, L. Giuffrida, M. Guarrera, G. Korn, G. Larosa, R. Leanza, E. L. Vecchio, G. Messina, G. Milluzzo, V. Olsovcova, S. Pulvirenti, J. Pipek, F. Romano, D. Rizzo, A. D. Russo, S. Salamone, V. Scuderi, A. Velyhan, S. Vinciguerra, M. Zakova, E. Zappalà, D. Margarone. Front. Phys., 8, 564907(2020).
[8] T. F. Rösch, Z. Szabó, D. Haffa, J. Bin, S. Brunner, F. S. Englbrecht, A. A. Friedl, Y. Gao, J. Hartmann, P. Hilz, C. Kreuzer, F. H. Lindner, T. M. Ostermayr, R. Polanek, M. Speicher, E. R. Szabó, D. Taray, T. Tokés, M. Würl, K. Parodi, K. Hideghéty, J. Schreiber. Rev. Sci. Instrum., 91, 063303(2020).
[9] J. Bin, L. O. Huebl, J. H. Mao, K. Nakamura, L. D. Geulig, H. Chang, Q. Ji, L. He, J. D. Chant, Z. Kober, A. J. Gonsalves, S. Bulanov, S. E. Celniker, C. B. Schroeder, C. G. R. Geddes, E. Esarey, B. A. Simmons, T. Schenkel, E. A. Blakely, S. Steinke, A. M. Snijders. Sci. Rep., 12, 1484(2022).
[10] C. Richter, L. Karsch, Y. Dammene, S. D. Kraft, J. Metzkes, U. Schramm, M. Schürer, M. Sobiella, A. Weber, K. Zeil, J. Pawelke. Phys. Med. Biol., 56, 1529(2011).
[11] P. Chaudhary, G. Milluzzo, H. Ahmed, B. Odlozilik, A. McMurray, K. M. Prise, M. Borghesi. Front. Phys., 9, 624963(2021).
[12] G. Milluzzo, G. Petringa, R. Catalano, G. A. Cirrone. Eur. Phys. J. Plus, 136, 1170(2021).
[13] M. Reimold, S. Assenbaum, C. Bernert, E. Beyreuther, F.-E. Brack, L. Karsch, S. D. Kraft, F. Kroll, A. Nossula, J. Pawelke, M. Rehwald, H.-P. Schlenvoigt, U. Schramm, M. E. P. Umlandt, K. Zeil, T. Ziegler, J. Metzkes-Ng. Phys. Med. Biol., 68, 185009(2023).
[14] D. Haffa, R. Yang, J. Bin, S. Lehrack, F. E. Brack, H. Ding, F. S. Englbrecht, Y. Gao, J. Gebhard, M. Gilljohann, J. Götzfried, J. Hartmann, S. Herr, P. Hilz, S. D. Kraft, C. Kreuzer, F. Kroll, F. H. Lindner, J. Metzkes-Ng, T. M. Ostermayr, E. Ridente, T. F. Rösch, G. Schilling, H. P. Schlenvoigt, M. Speicher, D. Taray, M. Würl, K. Zeil, U. Schramm, S. Karsch, K. Parodi, P. R. Bolton, W. Assmann, J. Schreiber. Sci. Rep., 9, 6714(2019).
[15] S. Gerlach, M. Pinto, N. Kurichiyanil, C. Grau, J. Hérault, M. Hillbrand, P. R. Poulsen, S. Safai, J. M. Schippers, M. Schwarz, C. S. Søndergaard, F. Tommasino, E. Verroi, M. Vidal, I. Yohannes, J. Schreiber, K. Parodi. Phys. Med. Biol., 66, 079501(2021).
[16] L. D. Geulig, L. Obst-Huebl, K. Nakamura, J. Bin, Q. Ji, S. Steinke, A. M. Snijders, J.-H. Mao, E. A. Blakely, A. J. Gonsalves, S. Bulanov, J. van Tilborg, C. B. Schroeder, C. G. R. Geddes, E. Esarey, M. Roth, T. Schenkel. Rev. Sci. Instrum., 93, 103301(2022).
[17] M. Reimold, S. Assenbaum, C. Bernert, E. Beyreuther, F.-E. Brack, L. Karsch, S. Kraft, F. Kroll, M. Loeser, A. Nossula, J. Pawelke, T. Püschel, H.-P. Schlenvoigt, U. Schramm, M. Umlandt, K. Zeil, T. Ziegler, J. Metzkes-Ng. Sci. Rep., 12, 21488(2022).
[18] M. Barberio, S. Veltri, M. Scisciò, P. Antici. Sci. Rep., 7, 40415(2017).
[19] P. R. Bolton, M. Borghesi, C. Brenner, D. C. Carroll, C. De Martinis, F. Fiorini, A. Flacco, V. Floquet, J. Fuchs, P. Gallegos, D. Giove, J. S. Green, S. Green, B. Jones, D. Kirby, P. McKenna, D. Neely, F. Nuesslin, R. Prasad, S. Reinhardt, M. Roth, U. Schramm, G. G. Scott, S. Ter-Avetisyan, M. Tolley, G. Turchetti, J. J. Wilkens. Phys. Med., 30, 255(2014).
[20] J. S. Green, M. Borghesi, C. M. Brenner, D. C. Carroll, N. P. Dover, P. S. Foster, P. Gallegos, S. Green, D. Kirby, K. J. Kirkby, P. McKenna, M. J. Merchant, Z. Najmudin, C. A. J. Palmer, D. Parker, R. Prasad, K. E. Quinn, P. P. Rajeev, M. P. Read, L. Romagnani, J. Schreiber, M. J. V. Streeter, O. Tresca, C.-G. Wahlström, M. Zepf, D. Neely, 8079, 807919(2011).
[21] J. Metzkes, L. Karsch, S. D. Kraft, J. Pawelke, C. Richter, M. Schürer, M. Sobiella, N. Stiller, K. Zeil, U. Schramm. Rev. Sci. Instrum., 83, 123301(2012).
[22] J. Metzkes, K. Zeil, S. D. Kraft, L. Karsch, M. Sobiella, M. Rehwald, L. Obst, H.-P. Schlenvoigt, U. Schramm. Rev. Sci. Instrum., 87, 083310(2016).
[23] N. P. Dover, M. Nishiuchi, H. Sakaki, M. A. Alkhimova, A. Y. Faenov, Y. Fukuda, H. Kiriyama, A. Kon, K. Kondo, K. Nishitani, K. Ogura, T. A. Pikuz, A. S. Pirozhkov, A. Sagisaka, M. Kando, K. Kondo. Rev. Sci. Instrum., 88, 073304(2017).
[24] M. Huault, D. De Luis, J. I. Apiñaniz, M. De Marco, C. Salgado, N. Gordillo, C. Gutiérrez Neira, J. A. Pérez-Hernández, R. Fedosejevs, G. Gatti, L. Roso, L. Volpe. High Power Laser Sci. Eng, 7, e60(2019).
[25] K. M. Schwind, E. Aktan, R. Prasad, M. Cerchez, D. Eversheim, O. Willi, B. Aurand. Rev. Sci. Instrum., 90, 053307(2019).
[26] M. J.-E. Manuel, H. Tang, B. K. Russell, L. Willingale, A. Maksimchuk, J. S. Green, E. L. Alfonso, J. Jaquez, L. Carlson, D. Neely, T. Ma. Rev. Sci. Instrum., 91, 103301(2020).
[27] M. Hesse, T. Ebert, M. Zimmer, S. Scheuren, M. Roth. Rev. Sci. Instrum., 92, 093302(2021).
[28] D. A. Mariscal, B. Z. Djordjevíc, E. S. Grace, R. Hollinger, T. Ma, G. G. Scott, H. Song, R. A. Simpson, J. J. Rocca, S. Wang. Plasma Phys. Control. Fusion, 63, 114003(2021).
[29] F. Kroll, J. Pawelke, L. Karsch. Med. Phys., 40, 082104(2013).
[31] J. Birks. The Theory and Practice of Scintillation Counting(1964).
[32] L. Torrisi. Nucl. Instrum. Methods Phys. Res. Sect. B, 170, 523(2000).
[33] S. Helmbrecht, M. Baumann, W. Enghardt, F. Fiedler, M. Krause, A. Lühr. J. Instrum., 11, T11001(2016).
[36] E. A. K. Smith, C. Winterhalter, T. S. A. Underwood, A. H. Aitkenhead, J. C. Richardson, M. J. Merchant, N. F. Kirkby, K. J. Kirby, R. I. Mackay. Biomed. Phys. Eng. Express, 8, 015024(2021).
[37] U. Schramm, M. Bussmann, A. Irman, M. Siebold, K. Zeil, D. Albach, C. Bernert, S. Bock, F. Brack, J. Branco, J. P. Couperus, T. E. Cowan, A. Debus, C. Eisenmann, M. Garten, R. Gebhardt, S. Grams, U. Helbig, A. Huebl, T. Kluge, A. Köhler, J. M. Krämer, S. Kraft, F. Kroll, M. Kuntzsch, U. Lehnert, M. Loeser, J. Metzkes, P. Michel, L. Obst, R. Pausch, M. Rehwald, R. Sauerbrey, H. P. Schlenvoigt, K. Steiniger, O. Zarini. J. Phys. Conf. Ser., 874, 012028(2017).
[38] T. Ziegler, D. Albach, C. Bernert, S. Bock, F. E. Brack, T. E. Cowan, N. P. Dover, M. Garten, L. Gaus, R. Gebhardt, I. Goethel, U. Helbig, A. Irman, H. Kiriyama, T. Kluge, A. Kon, S. Kraft, F. Kroll, M. Loeser, J. Metzkes-Ng, M. Nishiuchi, L. Obst-Huebl, T. Püschel, M. Rehwald, H. P. Schlenvoigt, U. Schramm, K. Zeil. Sci. Rep., 11, 7338(2021).
[39] G. Battistoni, J. Bauer, T. T. Boehlen, F. Cerutti, M. P. Chin, R. D. S. Augusto, A. Ferrari, P. G. Ortega, W. Kozlowska, G. Magro, A. Mairani, K. Parodi, P. R. Sala, P. Schoofs, T. Tessonnier, V. Vlachoudis. Front. Oncol., 6, 116(2016).
[40] M. Hamel. Plastic Scintillators(2022).
[41] F. Di Martino, P. Barca, S. Barone, E. Bortoli, R. Borgheresi, S. De Stefano, M. Di Francesco, L. Faillace, L. Giuliano, L. Grasso, S. Linsalata, D. Marfisi, M. Migliorati, M. Pacitti, L. Palumbo, G. Felici. Front. Phys., 8, 630534(2020).
[42] V. Favaudon, J.-M. Lentz, S. Heinrich, A. Patriarca, L. de Marzi, C. Fouillade, M. Dutreix. Nucl. Instrum. Methods Phys. Res. Sect. A, 944, 162537(2019).
[43] L. Plante, F. A. Cucinotta. New J. Phys., 11, 063047(2009).
[44] P. D. Vera, I. Abril, R. Garcia-Molina. Radiat. Res., 190, 282(2018).
[45] T. Ogawa, Y. Hirata, Y. Matsuya, T. Kai. Sci. Rep., 11, 24401(2021).
[46] M. S. Kreipl, W. Friedland, H. G. Paretzke. Radiat. Environment. Biophys., 48, 349(2009).

Set citation alerts for the article
Please enter your email address
© Copyright 2018-2021 | Chinese Laser Press. All Rights Reserved 沪ICP备15018463号-20