Abstract
To further advance nanomaterial applications and reduce waste production during synthesis, greener and sustainable production methods are necessary. Pulsed laser ablation in liquid (PLAL) is a green technique that enables the synthesis of nanoparticles. This study uses synchronous-double-pulse PLAL to understand bubble interaction effects on the nanoparticle size. By adjusting the lateral separation of the pulses relative to the maximum bubble size, an inter-pulse separation is identified where the nanoparticle size is fourfold. The cavitation bubble pair interaction is recorded using a unique coaxial diffuse shadowgraphy system. This system allows us to record the bubble pair interaction from the top and side, enabling the identification of the bubble’s morphology, lifetime, volumetric, and displacement velocity. It is found that the collision and collapse of the bubbles generated at a certain inter-pulse separation results in a larger nanoparticle size. These results mark a significant advancement by controlling the abundance of larger nanoparticles in PLAL, where previous efforts were primarily focused on reducing the average nanoparticle size. The experimentally observed trends are confirmed by numerical simulations with high spatial and temporal resolution. This study serves as a starting point to bridge the gap between upscaled multi-bubble practices and fundamental knowledge concerning the determinants that define the final nanoparticle size.1. INTRODUCTION
Pulsed laser ablation in liquid (PLAL) has emerged as a promising method for nanoparticle synthesis, owing to its environmental friendliness, versatility, and direct synthesis path that eliminates the need for purification of the produced nanoparticles. This technique has been successfully applied to synthesize nanoparticles from metals [1], oxides [2], semiconductors [3], and organic materials [4] in a wide variety of liquids ranging from water to organic solvents [5], making it an attractive option for applications that require high-purity colloidal nanoparticles [6]. Moreover, PLAL not only allows the synthesis of ligand-free nanoparticles but also in situ functionalization based on the selected solvent [7] and/or added electrolytes or ligands [8,9]. It offers the ability to tune the surface chemistry as well as the elemental composition of the nanoparticles through careful control of the synthesis conditions [10]. The nanoparticles’ atomic elemental composition can be finely tuned by the initial composition of the bulk target employed [11] or the target elemental distribution [12], even allowing the controlled synthesis of core-shell bimetallic structures [13]. Single-step nanoparticle production, surface ligands, and nanoparticle composition control, together with the upscalability of the process to meet industrial requirements [14–18], have widened the applications of PLAL-synthesized nanoparticles. As a result, PLAL-synthesized nanoparticles have been employed in various fields, including catalysis [19,20], biotechnology [21,22], photovoltaics [23], nanomedicine [24], and additive manufacturing [25]. Nanocatalysts’ efficiency, for instance, can be significantly improved by employing PLAL-generated ligand-free nanoparticles to increase the active sites, together with a defined and narrow size distribution that maximizes the surface-to-volume ratio [19,26]. Consequently, the efficient production of stable nanoparticles with defined particle sizes to ensure proper functionality is an important topic and has attracted significant interest [27–29].
Overall, nanoparticle applications in critical human development technologies such as energy, health, and structural materials depend on the possibility of generating nanomaterials with controlled size, composition, and surface chemistry in a scalable manner. PLAL fulfills most of those conditions and has been demonstrated to allow an upscalable synthesis of colloidal nanoparticles suitable for the described applications. However, a critical challenge remains in controlling the size distribution of PLAL-synthesized nanoparticles, which is crucial for their functionality and performance in the mentioned applications. Solving this challenge is vital for establishing PLAL as a standard nanoparticle synthesis technique in many fields, particularly those that rely on controlled particle size and surface chemistry.
Previous approaches to influence nanoparticle size distribution in PLAL required the addition of polymers [30], biomolecules [31], or anions [32] during synthesis. This way, monomodal nanoparticles with low polydispersity can be produced by size quenching, but the particular advantages of laser-generated colloids, i.e., their purity and surface activity, can be compromised. Modification of the PLAL early dynamics represents an alternative approach to control nanoparticle size distribution without the addition of extra chemicals. The high-intensity pulse interacting with the target induces a fast phase transition at the liquid–target interface [33]. The interaction leads to material melting and phase explosion, forming a dense high pressure and temperature plasma [34]. The generated plasma plume interacts with the surrounding liquid leading to the ablated material cooling and solvent vaporization forming the cavitation bubble [35]. Nanoparticle formation takes place along different pathways, including particles of a few tens of nanometers directly ejected from the instability of the superheated target molten layer [36] and within the cavitation bubble that acts as a micro-reactor for nanoparticle nucleation [33]. Consequently, cavitation bubble features such as dimension, shape, composition, and dynamics directly influence PLAL nanoparticle formation [37]. For instance, the size and volume of the cavitation bubble are influenced by PLAL conditions such as the viscosity of the liquid media and the laser fluence [38,39]. In general, an increase in the cavitation bubble average size and the resulting nanoparticle size distributions are reported at higher fluences [40]. So far, the following approaches for influencing cavitation bubbles during PLAL have been proposed: the application of external pressure [41], temperature control [42], and generation of ultrasonic waves in the surrounding fluid [43,44]. By suppressing cavitation bubble size and collapse time, external pressure and the liquid column above the target correlate with the size distribution reduction of nanoparticles formed in PLAL [29]. Temperature variations affect fluid properties, such as compressibility and viscosity, consequently indirectly modifying particle formation dynamics and the nanoparticle size [42]. Through ultrasonic wave excitation in the surrounding media, the plasma formation and cavitation bubble collapse phases are modified [44]. Within the different parameters influencing the cavitation bubble in PLAL, temporal and spatial control of the incident pulses has been barely studied, even though it represents a developed approach to modify laser ablation dynamics in air [45–47], influencing the process productivity. Temporally, double-pulse experiments with delays ranging from the ps [48] to the ms [49,50] time scale have shown that nanoparticle bimodality can be reduced by the second pulse interaction with the emerging spallation layer before cavitation bubble formation [48]. While μs-ms delayed pulses offer the possibility to interact with the emerging cavitation bubble modifying the produced nanoparticles size [49], synchron double-pulse PLAL with controlled spatial separation has not been studied yet, even though modification of the laser spatial intensity profile has been proven to influence cavitation bubble formation and dynamics in water [51,52].
The cavitation bubble lifespan ranging from the initial ns after the pulse impact on the target, up to the μs range [53], together with its spatial variation during the growth-collapse-rebound phases makes it difficult to direct the characterization during the complete nanoparticle formation process and ejection. To address this limitation, computational efforts have been combined with advanced characterization techniques to reveal the temporally resolved cavitation bubble effect on the PLAL synthesized nanoparticles. Molecular dynamics simulations have been employed to reveal the early cavitation bubble dynamics and nanoparticle formation, revealing the origin of the nanoparticle size bimodality observed in picosecond PLAL by different pathways of nanoparticle production mechanism [53–57]. The primary particles, with diameters below 10 nm, are initially ejected to the liquid around five nanoseconds after pulse interaction with the target due to the instability of the target molten layer [33]. The secondary particles within the bubble, typically , are hot in the range of nanoseconds, barely cool down, and continue to grow into the microsecond scale. The temporal (ns-μs) and spatial (μm-mm) cavitation bubble scales make it difficult for the experimental efforts to reveal nanoparticle formation within its evolution. The required sub-ns temporal resolution to characterize the complete cavitation bubble and nanoparticle formation lifetime has been only recently experimentally accessed by ps resolved pump–probe microscopy experiments [53], confirming the mechanisms previously described by computational methods [56] such as the plasma formation, dilution, and spallation layer generation and disintegration, as well as the shock wave propagation and cavitation bubble formation in the initial nanoseconds after pulse interaction. Alternative approaches to analyze the cavitation bubble dynamics and nanoparticle formation are small angle X-ray scattering (SAXS) [58], time-resolved shadowgraphy [59], and optical emission spectrometry (OES) [43]. Although SAXS is a powerful way to characterize particle formation inside the cavitation bubble, detailed analysis is difficult due to the lack of sufficient temporal and spatial resolution. As well as being more effective at the early stages of bubble dynamics, OES analysis has a limited spatial resolution. Alternatively, shadowgraphy is the most commonly used technique for analyzing cavitation bubble [60], as it offers an acceptable compromise among experimental complexity, temporal resolution (20 ns), and spatial resolution (2 μm) [61].
An approach to understand single cavitation bubble dynamics with a higher temporal and spatial resolution is the development of numerical simulations. Cavitation bubble dynamics in the vicinity of a solid wall have been studied extensively in the past years in Ref. [62] and references within. Excellent agreement has been found between experimental and numerical results. For bubbles close to the wall (close to the target), wall-directed ultra-fast needle jets form due to the impact of radial inflow on the symmetry axis [62,63]. Bubbles that expand further away from the wall show more regular jet characteristics due to the pressure difference over the bubble surface and the formation of a liquid film between the bubble and wall [62]. These jets occur on different scales and show a much lower peak velocity than the needle jets. Less detailed analysis is available for in-phase and anti-phase interactions of multiple bubbles [64–69]. It has been found that a weak and a strong interaction regimes exist for bubble pairs near a wall [69]. The strong regime is characterized by flat bubble shapes with an intermediate liquid film that can rupture, leading to coalescence of the bubble. In the weak regime, the bubbles remain separated from each other over the entire evolution and form a jet toward each other during the collapse phase. This jet formation is similar to the regular jet of single cavitation bubbles expanding sufficiently far away from a solid wall [65]. The time and length scales of the evolution can be well described by an analytical model including the pressure influence of the secondary bubble [69]. Han et al. [64] have studied characteristics of in-phase and anti-phase bubble pairs. They observed that for anti-phase pairs a counter-jet develops from the secondary toward the primary generated bubble, which can be magnified by a third anti-phase bubble [66]. In numerical analysis of bubble pairs, the boundary integral method (BIM) has mainly been employed with simplifications on the used equation of state [64,67,70]. These simplifications can strongly influence the bubble evolution, especially in the late collapse stages [62,71]. Furthermore, a finite volume discretization of the governing equations is beneficial compared to BIM by implicitly handling complex surface topologies [62]. Even though there is a growing interest in understanding multiple cavitation bubble dynamics, the influence of the spatial distribution of the cavitation bubbles in multi-pulse PLAL on nanoparticle size distribution remains a challenge due to the lack of experimental or numerical approaches describing those PLAL conditions.
Overall, there is a missing link between two distinct knowledge fields in PLAL. On the one hand, there is the PLAL’s maturity in the achieved upscaling regime that requires millions of “bubble reactors” initiated per second. And on the other hand, the basic understanding of the particle formation mechanism during PLAL has reached a high level as well, in particular for individual bubbles. For example, laser synthesis upscaling requires higher laser powers, often achieved by higher repetition rates. During MHz repetition rate PLAL, every microsecond a new bubble is created, which requires a supersonic lateral offset of the ablation spot tunable from several to hundreds of micrometers [72]. Hence, depending on the repetition rate and the cavitation bubble’s lifetime, dozens of bubbles will interact with each other during upscaled laser synthesis. Hence, the question arises of how these bubbles interact with each other and whether the interaction will affect the PLAL-yielded particle size. This multiparametric question may be reduced in time and space, starting with a pair of synchronized bubbles, at defined lateral offset.
In this contribution, a coaxial shadowgraphy setup is developed in order to visualize and better comprehend the dynamic of PLAL cavitation bubble pair interaction on gold as well as a transparent YAG crystal surface. As the bubble pair’s dynamics and their morphology will be characterized, the imaging has been realized both from the top- and side-view angles. This novel setup is employed to monitor the cavitation bubble evolution in micrometric spatially resolved pulse-pair PLAL experiments, where two synchronized laser pulses of the same energy are used to irradiate the targets. In this configuration, two simultaneous cavitation bubbles form a bubble pair. The behavior of laser-induced cavitation bubbles can be altered by controlling the distance between them. The proximity between the bubbles determines whether and how they interact with each other, leading to variations in their long-term behavior. Nanoparticle analytics of both the hydrodynamic and primary particle diameters will give insights if the modified bubble dynamics affect nanoparticle growth. The observed trends are compared to high-resolution numerical simulations of bubble pairs based on a fully compressible finite-volume discretization.
2. MATERIALS AND METHODS
A. PLAL Nanoparticle Synthesis Setup
The PLAL setup employed for gold (Au) and yttrium aluminum garnet (, YAG) colloidal nanoparticles production consists of a 10 ps, 100 kHz, 160 W Nd:YAG laser (Edgewave PX400-3-GH). The targets are ablated in ultra-pure, deionized water (MilliQ, Millipore) for 5 min inside a batch chamber with an incorporated stirrer to ensure concentration homogenization and nanoparticle shielding reduction (as shown in Fig. 10 in Appendix A). Note that addition of micromolar saline, often used in PLAL of gold for agglomeration and growth inhibition (size quenching) [28], was omitted to allow the attribution of particle aggregation/growth to bubble dynamics without cross-effects by in situ surface charge delivery. It is also important to note that using a nanosecond laser may produce different results due to its longer pulse duration and distinct dynamics. A galvanometric scanner (ScanLab, hurrySCAN 30) operating at equipped with an -Theta lens () directs the ps pulses onto the Au and YAG targets (pulse energies of 320 μJ and 470 μJ, and a focal spot size with a diameter of 122 μm and 54 μm, respectively; equivalent to fluence values of ). The selected materials allow us to illustrate the versatility of the proposed method—Au as a benchmark and the most studied material in PLAL and YAG as a transparent ceramic material, allowing top-view shadowgraphy. The produced samples with this method are later referred to as single pulse ablation or zero spatial separation.
B. Micrometer-Resolved Spatially Separated Double-Pulse PLAL
The described standard PLAL system is complemented with an electro-optic module that allows spatial beam multiplexing with adjustable temporal and spatial separation. Temporally synchronized double pulses with identical pulse energy () are generated with varying inter-pulse distances to investigate the effect of simultaneous bubble pair interaction on the individual bubble dynamics and the produced nanoparticles [Fig. 1(a)]. Since the cavitation bubble size depends on the target material, solvent, laser pulse energy, and pulse duration [6,57], the spatial inter-pulse distances () are selected taking as reference the single cavitation bubble height at the maximum expansion () produced with the same pulse energy on each material, 320 μJ for Au and 470 μJ for YAG. The resulting bubble heights are 300 μm and 190 μm for Au and YAG, respectively (Fig. 11, Appendix B, Au ). Based on those values, Fig. 1(b) illustrates how the distance between bubbles is determined. The size of the cavitation bubble depends on the material and the applied laser pulse energy. To analyze the double bubble dynamics independently, there must be a constant relationship between the spatial pulse spacing and the maximum size of the cavitation bubble. Thus, the distance between two cavitation bubbles is determined by the maximum height of a single cavitation bubble () induced by defined laser pulse energy. The spatial inter-pulse distances evaluated in this study are , 600, and 1400 μm for Au, and , 460, and 1075 μm for YAG, corresponding to approximately single-pulse, 2 times, and 4 times for each material, respectively. To avoid the influence of successive pulses on the double-bubble interaction, the laser repetition rate was manually reduced to 10 kHz by a digital delay generator (DDG) (Stanford Research DG535) in order to provide a wide temporal window between pulses that allows complete bubble evolution until the next double-pulse irradiation event. The typical bubble lifetime for Au and YAG is 45 μs and 40 μs, respectively, far shorter than the provided 100 μs temporal delay. Despite this, it is worth noting that, in combination with this temporal delay, the scanner also provides a 300 μm beam displacement.
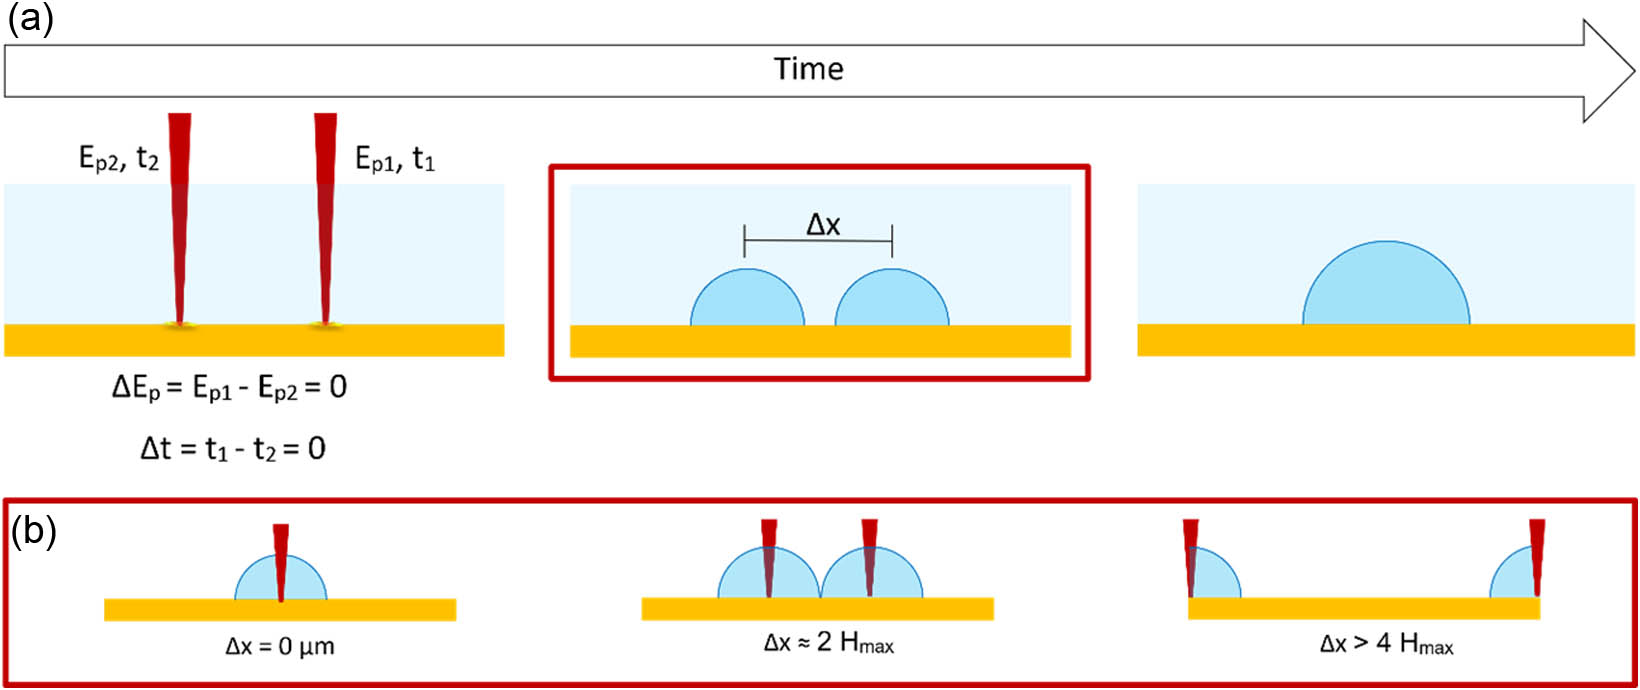
Figure 1.(a) Synchronized bubble pairs are generated with the same pulse energy (). Configuration to be examined with the process parameters , , . (b) The size of the cavitation bubble depends on the material and the applied laser pulse energy. For independent analysis of double bubble dynamics, the relationship between the spatial pulse spacing and the maximum size of the cavitation bubble should be constant. Therefore, the maximum height of a single cavitation bubble () induced by a defined laser pulse energy is used as a parameter for choosing the distance between two cavitation bubbles for each material. The spatial pulse spacings for this study correspond to approximately 0, 2, or 4 times for each material.
C. Spatially Separated Double-Pulse PLAL Colloidal Nanoparticle Characterization
The produced colloidal nanoparticle size distribution and morphology characterization were conducted by scanning transmission electron microscopy (STEM, Apreo S LoVac, Thermo Fisher Scientific, 30 kV acceleration voltage). Colloids were drop-casted on a carbon-coated copper grid and measured within three days after synthesis to ensure minimum particle growth effect. High-angle annular dark-field imaging (HAADF) mode is chosen for Au nanoparticle analysis due to the improved contrast that enables the identification of the small nanoparticles. To verify the particle size distribution, for each double-pulse spatial separation experiment, approximately 1000 nanoparticles were measured and analyzed by ImageJ (ParticleSizer).
An analytical disk centrifuge (ADC, CPS, DC24000) was used to study the hydrodynamic nanoparticle diameter. The rotor speed is set at 24,000 r/min for all measurements, the density gradient is built up with sucrose, and reference standard colloid (PVC, 0.237 μm) is injected before every measurement in order to increase accuracy. Mass-weighted size distributions are calculated by the device’s software directly. Seven samples were analyzed for each double-pulse separation to determine the reproducibility and uncertainty of the particle size determination. We conducted a variance analysis for the ADC results by Tukey’s least significant difference (LSD) test at a 5% level of significance using the statistical analysis package of OriginPro 2022.
For further hydrodynamic size distribution analysis within 1 nm to 7 nm, an analytical ultra-centrifuge (AUC, Beckmann Coulter Proteomelab XL-I, An-50 Ti rotor) was employed at 30,000 r/min. The statistical resolution of AUC is superior to that of STEM, which is known to be the ideal method for mass-weighted sizing ultra-small nanoparticles.
Through the integration of these techniques, particle size can be thoroughly analyzed. ADC measurements provide the hydrodynamic particle modal diameter that represents the size distribution peak size. Additionally, the STEM outcomes are used to characterize the Feret diameter of the particles, which offers an alternative method of measuring particle size based on the longest distance along the particle’s boundary. These complementary metrics are crucial in scientific analysis, providing diverse viewpoints on particle characterization and allowing us to gain a comprehensive understanding of the particle’s size distributions.
D. Cavitation Bubble Dynamics Recorded by Shadowgraphy Imaging
Double cavitation bubble dynamics were analyzed at , , and inter-pulse distances. To obtain a coaxial view of the bubble interaction, a high-intensity xenon flash lamp was used as a light source (Hamamatsu, L4633-01) and a fast-gated intensified charge-coupled device (ICCD) camera as a detector (Andor i-Star, DH334T-18H-13) modifying the setup to capture images in two different configurations. The detailed schematic of the shadowgraphy setup for the top-view and side-view is illustrated in Figs. 2(a) and 2(b), respectively. To ensure homogeneous scattering of the flashlight and improved image quality, an engineered top-hat diffuser glass (Thorlabs ED1-C50-MD) was implemented, which partially provides visibility inside the cavitation bubbles by enabling light to enter the bubble from various angles, thereby enhancing the inner visible area. As YAG crystals only absorb around 16% of the pulse energy at the laser wavelength employed (1064 nm), the flash system was shielded from transmitted laser pulses using a short-bandpass filter (Thorlabs FESH0750). In order to capture images from the top view, a long-pass dichroic mirror (Thorlabs DMLP900R) was placed at 45° in front of the ablation chamber to allow the laser pulses to pass through and reflect the visible light to the camera. It should be noted that top-view shadowgraph imaging is not applicable to gold or any other opaque materials. Furthermore, a telecentric lens (Sill Optics, Correctal T/1.5, and Edmund Optics, 4X, 65 mm CompactTL Telecentric Lens) is positioned in front of the camera sensor [Fig. 2(a)].

Figure 2.Schematic diagram of coaxial diffuse shadowgraphy system: (a) for top-view angle; (b) for side-view angle. By placing a dichroic mirror at 45° in front of the glass cell, picosecond laser pulses can pass through, ablate the YAG target, and generate cavitation bubbles. The mirror also reflects the visible flashlight into the camera lens, capturing shadowgraph images from the top-view. (c) Schematic of the side- and top-view imaging geometry and related two-dimensional shadowgraph projections.
In the side-view shadowgraphy setup configuration, the IR filter and dichroic mirror were removed, and the flashlight system was placed in front of the lens [Fig. 2(b)]. A single image is recorded per laser shot, and the target is shifted by typically 400 μm after each exposure to avoid the effects of surface changes on cavitation bubble dynamics. Related control experiments are summarized in Fig. 12 in Appendix C. The laser parameters are described in Sections 2.A and 2.B for the single and double cavitation bubble dynamics, respectively. The camera was employed as a digital delay generator (DDG) to send independent trigger signals to the flash lamp and laser at a designed delay time. The laser was always triggered with 0 delay. The camera and flashlight triggered simultaneously together with a variety of delay times from 200 ns to 5 μs steps to capture the temporal double cavitation bubble interaction evolution. All shadowgraph images are labeled with their delay time. The exposure time was 200 ns for all images. Figure 2(c) shows a schematic of the double configuration shadowgraphy setup, allowing us to record a two-dimensional shadowgraph from both the side- and top-view angles. Note that the term “coaxial” pertains to the alignment of the camera’s field of view, illumination source, and image acquisition without inherently implying simultaneous image capture timing.
E. Numerical Simulations of the Double Cavitation Bubble Dynamics
Numerical simulations were conducted to clarify the importance of the bubble evolution on the particle size distribution. Especially, the relevance of the different phenomena that occur during the bubble lifetime was investigated. Due to the complex and challenging three-dimensional setup, the cavitation bubble dynamics was assessed in a reduced three-dimensional axisymmetric space. This allows us to elucidate the underlying jetting phenomena of bubble pairs that emerge for the investigated lateral pulse distances without the inclusion of three-dimensional wall effects. Although the presence of the wall influences the dynamics of detached bubbles significantly, attached bubbles with zero standoff distance are only slightly affected and resemble an unbounded evolution in time and length scale [62]. Possible discrepancies are different bubble shapes [73] or induced ultra-fast needle jets in the very late collapse stages [62,63]. In the current setup, wall effects are only included in the simulation with a lateral pulse distance of to highlight the different jetting phenomena between single cavitation bubbles and spatially separated, simultaneously expanding bubble pairs. For the simulations, the initial experimental conditions were used as calibration to approximately match the time and length scales of a single cavitation bubble with . Therefore, an initially high-energetic spherical gas bubble () expands into a resting liquid at ambient conditions (). Both the gas bubble and surrounding liquid are modeled with the Noble-Abel stiffened gas equation of state [74], , where , , are the fluid density, pressure, and internal energy, respectively, is the ratio of specific heats, is a constant background pressure, and is the minimal specific volume. In the current simulations, the liquid is modeled as a Tait liquid with , and [75]. Inside the bubble, the employed values were . The employed grid resolution uses 25–30 cells per initial radius. Details on the implementation, numerical setup, and validation of the flow solver for cavitation bubble dynamics can be found in Ref. [62].
3. RESULTS AND DISCUSSION
The synchronous pulses with equal energy and varying spatial separation () allow investigation of the effect of spatially dependent synergy between the two bubbles on the cavitation bubbles dynamics and the produced Au nanoparticles. The studied distances are , 600, and 1400 μm corresponding to 0 (reference single pulse ablation), 2, and 4 times the maximum height of a single bubble, respectively.
The ADC measurements, shown in Fig. 3(a), allow the characterization of the Au nanoparticle fraction comprised in the 5–300 nm range. The results indicate that the mass-weighted hydrodynamic gold nanoparticle diameter significantly increases for (). The nanoparticle diameter increases from the mean peak value of at to at (). A further increase of the inter-pulse lateral distance to generates a similar nanoparticle size distribution as the initial case with a mean peak value of [Figs. 3(a)–3(c)].
Figure 3.Particle size analysis of Au nanoparticles synthesized for , 600, and 1400 μm. (a) Hydrodynamic mass-weighted particle diameter distributions measured by analytical disk centrifuge for Au nanoparticles. (b) Mean peak diameter value analyzed by Tukey’s least significance difference (LSD) test based on ADC measurements. Probability of F-test (). (c) The number-weighted primary particle diameter distributions for Au were obtained from particle size analysis of particles from the STEM images for varied . (d)–(f) HAADF-STEM images of Au nanoparticles synthesized for , 600, and 1400 μm inter-pulse distances. The scale bar is the same for all images.
The evaluation of the nanoparticle fraction below 5 nm is performed by AUC measurements that complement the ADC measurements in the lower size range due to the detection limit of ADC at low hydrodynamic diameters. It should be taken into account that low concentrations of the samples derived from accumulated single pulse ablation lead to strong noise in the sedimentation curves of the AUC measurements. Nevertheless, the results (as shown in Fig. 13 in Appendix D) exhibit the presence of larger Au nanoparticles with a sharp peak at 5 nm for the compared to the mean values of 2 nm for , and 1.5 nm for . The trend in the nanoparticle size fraction below 5 nm is similar to the one observed for the 5–140 nm fraction, where the double-pulse inter-pulse spatial separation of () appears as a sweet spot with larger nanoparticles compared to and .
To confirm the statistical significance of the obtained results, the boxplots in Fig. 3(b) illustrate the differences in mean size values versus pulse distances for the ADC measurements. The results of the statistical analysis of variance (ANOVA) are shown in Fig. 14 in Appendix E. They confirm that Au nanoparticles synthesized for inter-pulse distances of () have significantly () larger mean nanoparticle diameter than that of and . Hydrodynamic diameter analysis cannot differentiate between agglomeration/aggregation of primary particles or primary particle diameter increase. Hence, STEM analysis provides evidence that also the primary particle diameter increases at conditions [Fig. 3(c)]. Similar to ADC measurements, a significant increase in Au nanoparticle size at () is observed in STEM images [Figs. 3(d)–3(f)]. The combined AUC, ADC, and STEM results allow us to conclude that both the hydrodynamic and the primary particle diameter significantly increase at lateral inter-pulse distances of but are unaffected at 0 or . Under these conditions, larger solid spheres and stronger aggregation/agglomeration are created by the bubble dynamics.
Now that the influence of the cavitation bubble pair separation on the nanoparticle size distribution has been proven for Au as a reference material in PLAL, the method is extended to the material YAG to prove the transferability of the bubble pair effects on the nanoparticle size beyond metal nanoparticles to the oxide ceramic YAG with completely different optical and physicochemical properties.
The inter-pulse distance for YAG is defined based on the cavitation bubble maximum height () from a single bubble YAG in water. The equivalent distances to the Au experiment result for YAG result in , 460, and 1075 μm corresponding to standard single pulse PLAL, 2 times, and 4 times , respectively [Fig. 4(a)]. YAG nanoparticle characterization by STEM indicates that increasing the pulse distance to results in a significant increase of the average primary nanoparticle diameter from at to at (). As observed for Au, when the inter-pulse distance is increased to (), the nanoparticle size distribution becomes similar to the case, . As reported by Kim and Ryu [76], an average size of is expected for PLAL-generated YAG nanoparticles in deionized water, which agrees with the results obtained for and . At these distances ( or ), the bubble pairs do not interact; hence, neither the dynamics is modified nor the nanoparticle formation mechanism. Furthermore, the YAG nanoparticles produced remain spherical as illustrated in Figs. 4(b)–4(d).
Figure 4.(a) Number-weighted primary particle diameter distributions for YAG obtained from particle size analysis of particles from the STEM images for several . (b)–(d) STEM images of YAG nanoparticles synthesized at , 460, and 1075 μm inter-pulse distances. Scale bar is the same for all images.
The results prove that inter-pulse separations of represent a sweet spot where the nanoparticle formation mechanism is modified, generating a significant increase in the nanoparticle size (both the hydrodynamic and primary particle diameter) up to a 3.68 factor. This observed unprecedented nanoparticle size regulator mechanism in PLAL, purely based on laser beam manipulation, provides opportunities to influence nanoparticle size (in particular, creating larger particles) without compromising the purity and surface ligands of the produced colloids. However, even though the process has been proven to be material independent with a constant parameter such as inter-pulse distance relative to the cavitation bubble maximum height, the undergoing mechanism is unclear, and only the hypothesis of the generated cavitation bubble interaction supports the finding. To address the fundamental understanding of the process, a coaxial shadowgraphy technique combined with high-resolution numerical simulations is implemented to investigate and analyze the interaction between two cavitation bubbles and their influence on nanoparticle formation. This system is adapted to, for the first time, capture the top viewpoint evolution of the laser-induced cavitation bubble on a solid surface during PLAL. Figures 5(a) and 5(b) exhibit the cavitation bubbles’ top and side views induced on the YAG crystal surface underwater. The coaxial top view in combination with the lateral shadowgraphy represents an advantage in the matching experiment with modeling the 3D evolution of the cavitation bubbles.
Figure 5.Shadowgraph imaging to exhibit the temporal evolution of cavitation bubble dynamics generated at , 460, and 1075 μm inter-pulse distances, and visualize the interaction of the two simultaneously generated cavitation bubbles produced with the same pulse energy (470 μJ for each cavitation bubble) on the YAG crystal surface from (a) top-view and (b) side-view. The 1000 μm scale bar is the same for all image series in (a) and (b). Magnifications of the bubble pair images at , 38 μs shortly before their collapse are highlighted.
Comparing the two viewing angles, Figs. 5(a) and 5(b), it can be observed that the shadowgraph from above contributes significantly to a more detailed analysis of the interaction between the cavitation bubble pairs. A substantial part of the dynamics’ phenomenology is hidden when characterized by the standard PLAL bubble shadowgraphy side-view. The bubble shape for () experiences shrinkage and collapse clearly observed in the top-view [Fig. 5(a)]. Comparison of the coaxial shadowgraph images at different inter-pulse distances provides valuable information. The cavitation bubble dynamic similarities for the bubble pair at and the single bubble at can be noticed from both top and side view angles. From the geometrical point of view, the bubble pair of does not indicate any interaction impact on each other until the collapse phase. Only in the 38 μs time frame with the appearance of the horizontal jet formation phenomena can the change of the shape of the bubbles be seen compared to the same time frame for the single bubble at . The top-view angle shows this phenomenon more precisely. In addition, the attraction between the cavitation bubble pair and their rough dynamics at is also well captured at both view angles compared to the other two spatial distances. The bubble pair movement toward each other and the bubble interaction effect on the geometry of the bubbles are also evident from the side-view. The top-view angle provides clear evidence of impact and the formed horizontal jets’ emergence toward each other at 38 μs, leading to the bubble pair coalescence at the collapse moment. Note that the interaction of free laser-induced bubble pairs (in the water volume without PLAL) is known to create strong effects on both the shape evolution and jet formation, depending on the normalized time, size, and distance [64], but such bubble pair phenomena have not been investigated in the PLAL literature yet.
As discussed before, each view angle gives us two bubble size evolution parameters, bubble horizontal radius, , and bubble vertical radius, (from the top view), as well as bubble half-width, , and bubble height, (from the side view). As shown in Fig. 15 in Appendix F, the exact parameters in relation to the acquired shadowgraphy image view are detailed. The three-dimensional characterization of the cavitation bubble evolution is illustrated in Fig. 16 in Appendix G for all inter-pulse separations. Since the is a single bubble, and the cavitation bubble pairs for and are spatially separated, only the size evolution of one of the bubbles was considered.
Considering that nanoparticle concentration is an essential factor influencing growth and aggregation mechanism within the cavitation bubble, investigating the volume dynamics of the induced cavitation bubbles is of particular importance [29,77,78]. Figure 6 shows the time-resolved cavitation bubble volume evolution for the different inter-pulse separations.
Figure 6.Cavitation bubble volume evolution during PLAL of YAG at different spatial bubble pair distances. Expansion and shrinkage phase for a single cavitation bubble for and one of the bubbles for and 1075 μm.
At inter-pulse distances of and 1075 μm, the expansion time until the bubble maximum size is 20 μs, which is slightly longer than the expansion time until the maximum size for of 18 μs. However, changing the inter-pulse separation does not affect the bubble’s lifetime. Moreover, the evolution of the cavitation bubble radius shown in Fig. 16 in Appendix G and the comparison of the volume evolution for a single bubble for and one of the cavitation bubbles for and shown in Fig. 6 reveal a slightly lower maximum volume and a little larger cavitation bubble volume before the collapse phase between the and the other investigated spatial distances ( and 1075 μm).
In Fig. 7, the cavitation bubble dynamics for the different lateral pulse distances is shown for the side-view shadowgraphy measurements together with the simulation results. Note that a reduced three-dimensional axisymmetric space was employed, which does not allow a direct comparison for the top-view. Upon comparison of experimental and numerical bubble dynamics in Fig. 7, a reasonable agreement is observed for the bubble size and time scale in the expansion phase. Compared with the experimental results, the simulations indicate a delayed collapse phase for initially separated bubbles. This delay agrees with the retarding effect of a wall on the bubble evolution [62,79]. Additionally, the experimental bubbles for the distance migrate stronger toward each other. A possible reason is the reduced axisymmetric setting, which neglects the asymmetry of the experimental setup like far-distant walls and surfaces (i.e., the chamber window and the liquid–air interface). Such liquid layer thickness effects on the PLAL bubble dynamics have been investigated in detail at the example of a wire-shaped target surrounded by a cylindric liquid hull [80,81] or the decreasing liquid layer height over a flat target [82]. Furthermore, neither nanoparticles inside the bubble nor heat transfer between target and bubble is currently included in the simulations. Nevertheless, experiments and simulations agree, and the unique merging and collapsing dynamics/morphologies observed for both for Au and YAG are likely to cause the higher nanoparticle diameters.
Figure 7.Comparison of the cavitation bubble dynamics between experiments (top row for each ) and simulations (bottom row for each ). Only for the single bubble evolution , wall effects are included in the simulations.
For further discussion of the bubble pair dynamics, one needs to distinguish between wall and inter-bubble effects. On the one hand, bubble collapse near static, planar walls (i.e., a target surface) has recently been reported (for bubbles formed above the wall, not by PLAL) to cause (ultra)fast jets directed toward the wall [62,63,83]. Such wall-directed jets are favored, among other conditions, according to simulations of non-PLAL bubbles [62,83], by axial symmetry of the bubble and by breaking of spherical symmetry where the bubble approaches the target surface. In PLAL, breaking of spherical symmetry at the bubble-wall contact has been reported as well to be a key event for bubble collapse. The apparent contact angle between the bubble and wall determines bubble dynamics. The competition between capillary and friction effects becomes evident upon varying viscosity (and surface tension) of the liquid [73]. On the other hand, a neighboring bubble phase boundary (bubble wall), as present in bubble pair experiments, is known to cause jets directed toward the bubble [69,84]. Such inter-bubble jets appear, at defined normalized distances and delay times, also between two spherical bubbles. Qualitatively, they are similar to regular jets that occur for a single cavitation bubble above a static, planar wall [62,64,84].
Details of the occurring jetting phenomena to evaluate its effect on the nanoparticle size distribution are visualized in Fig. 8 for the single bubble and for bubble pairs at and . When a single bubble expands near a solid wall, ultra-fast shock-accelerated needle jets evolve toward the wall in the late collapse stages [62,63,83]. The needle jets are initiated by radial inflow and the formation of a cusp at the bubble head [Fig. 8(a)] [62]. Neither in the experiments nor in the simulations, such cusps are observed in the case of two separated bubbles that expand simultaneously as a bubble pair. In contrast, continuously accelerated regular inter-bubble jets form pointing toward each other [Figs. 8(b) and 8(c)]. Hence, the formation of a wall-directed needle jet is prevented because the formation of the inter-bubble jet disturbs the axial symmetry of the bubble. This is evident from comparing the wall-directed jet of a single cavitation bubble [Fig. 8(a)] with the inter-bubble jet of a far-distant bubble pair [Fig. 8(c)]. We observe different strengths, directions, and bubble morphologies. Thus, an influence on the corresponding nanoparticle distribution would be expected in case the jetting phenomena are responsible for the significant, ablation-material-independent nanoparticle size distribution change. A similar observation is not made for experimentally measured size distributions for the and distances, where similar size distributions are found. Consequently, we hypothesize that the nanoparticle size distribution is independent of the morphology, strength, and size of the generated jet. Comparing the two inter-bubble jet scenarios ( and ), we see qualitative accordance with reduced velocities inside and outside of the more proximate bubbles. This observation agrees with quantitative analysis of the jet characteristics of single cavitation bubbles at a certain distance above a static, planar wall [62,83]. Since there is a significant shift of the nanoparticle size distribution between the two bubble pair distances, such lower jet velocities (or the presence and absence of bubble morphology changes in the experimental shadowgraphy at and , respectively) might affect the nanoparticle formation and growth. We do not have direct experimental evidence that would allow us to pinpoint events inside the bubble. For that purpose, in situ synchrotron probing of the bubble pair interior with high spatial and temporal resolution would be required, along with single-bubble experimental characterization [58,85,86]. However, some general hypotheses may be drawn that may be considered in future in situ experiments or simulations of the bubble’s interior’s mass flow. A main contribution to increase the nanoparticle size may be the formation of vortices after jet penetration that enhance the migration/attraction of the bubbles toward each other. Eventually, these vortices induce the contact of the initially separated bubbles during the first collapse [87] or the coalescence of primary nanoparticles and atom clusters inside the individual bubble. It may be speculated that once the bubbles merge, nanoparticles may be released from one bubble and enter the other with opposite velocity directions. This can lead to nanoparticle interactions supporting additional particle aggregation, agglomeration, and growth. Hence, anticipating this kind of mass flow may explain that bubble pairs that remain separated over the entire evolution (0 and ) show similar particle distributions to single cavitation bubbles, while the experimental conditions where the bubbles merge () result in a larger nanoparticle size distribution.
Figure 8.Contours of the non-dimensional velocity magnitude for the wall-directed and inter-bubble jet regimes. Time instances are given in the upper left corner of each frame, and the black arrows indicate the direction of the velocity. The direction of the jets is indicated with a white arrow. (a) Formation of a wall-directed jet of single cavitation bubble collapsing at a wall with . The wall is placed at the lower edge of each image. (b) Inter-bubble jet formation for a bubble pair with . (c) Inter-bubble jet formation for a bubble pair with . For and , only one of the bubbles is visualized, where the second bubble lies on the left. A wall is omitted due to the employed reduced axisymmetric space.
Figure 9(a) summarizes the influence of the cavitation bubble dynamics as a function of the lateral distance on the PLAL-synthesized Au and YAG nanoparticles in water. Although Tomko et al. reported a qualitative correlation between bubble volume and nanoparticle size changes [29,88], the nanoparticle size increase measured for both materials for a double-pulse separation of does not match the volume dynamic differences measured. Based on cavitation bubble PLAL SAXS measurements, it has been discovered that the bubble interface comprises a firm boundary for the nanoparticle ejection, with most of the secondary particles concentrated near the ablated target surface when the bubble collapses [85,86]. Moreover, as pointed out by Dell’aglio and de Giacomo [89], almost all the nanoparticles remain inside the cavitation bubble until collapse. About 80% of the nanoparticles are released into the liquid at that moment. Therefore, not the bubble’s volume but only the unique interaction dynamics between the two cavitation bubbles for are responsible for this severe particle size growth, as confirmed both by the top- and side-view shadowgraphy setup and the numerical simulations. At , the two bubbles are attracted to each other, a phenomenon that does not occur at longer distances where the nanoparticle size distribution is not affected compared to single pulse PLAL. In Fig. 9(b), the inter-bubble distance (IBD) and the attraction velocity at are calculated based on the YAG-PLAL shadowgraph images [Figs. 5(a) and 5(b)]. The result shows that these bubbles’ lateral position and symmetry remain still until the maximum expansion phase. During shrinkage, they start moving toward each other, changing their symmetry and displacing along the target surface and colliding at a speed of , finally collapsing together. Even though the volume dynamics (volume shrinkage rate) at this collision distance is close to the initial state, the cavitation bubble movement on the surface affects the dynamics and kinetics of nanoparticle growth. Additionally, due to the nanoparticle release in the collapse phase, the collision and collapse of the two bubbles at high speed is another influencing factor. These two factors can both accelerate growth and may play a role in the observed significant increase in particle size. The more distant double cavitation bubbles at collapsed far apart despite slight attraction phenomena (Fig. 17, Appendix H). The cavitation bubble dynamics, in this case, do not differ from the single bubble scenario. Consequently, the nanoparticle size distribution is not expected to be affected, as confirmed experimentally. Simulations showing the trends for the IBD evolution confirm the magnitude of the bubble attraction speed for the scenario [Fig. 9(b)], which completely differs from the static bubbles at 0 and . For the during the expansion phase, the bubble center remains at its stable initial position. The attraction of the bubbles toward each other is only initiated in the late stages of the collapse phase due to the pressure difference between the bubbles and the surrounding liquid. The maximum approaching velocity is reached after inter-bubble-jet penetration, when the bubble movement is intensified by the generated vortices around the torus bubble. As a consequence, (i) symmetry breaking by synchronized bubble pairs at distance, (ii) inter-bubble jetting that may cause flow vortices, (iii) counter-directed mass flow of the bubble pairs’ interior intensifying particle coalescence or aggregation rate, and (iv) merging and collapsing at high speeds during the particle release process may govern the final nanoparticle size by spatially resolved, synchronized double pulse PLAL, independent of the ablated target material.
Figure 9.(a) Impact of bubble-height-normalized lateral inter-pulse distance of synchronized bubble pairs on YAG and Au nanoparticle diameters. Particle size analysis using STEM (primary particle diameter Xc, ) and analytical disk centrifuge (hydrodynamic diameter). (b) YAG bubble pair experiments at ; center to center inter-bubble distance (IBD) measurements (left axis) are plotted as well as attraction velocity of the individual bubbles toward each other (right axis) with the maximum bubble expansion time () referred to as reference bubble lifetime events.
Figure 10.PLAL setup with the batch chamber was controlled by extending the temporal delay between laser pulses beyond the lifetime of the cavitation bubbles with a digital delay generator. In this way, the nanoparticles will not be affected by undesirable cavitation bubble interactions with the next laser pulse.
Figure 11.Observation of cavitation bubble evolution on the surface of Au target after a single pulse PLAL ().
Figure 12.Cavitation bubble height at maximum expansion on Au surface with a delay time of 20 μs, depending on the number of applied pulses at the same spot to examine the nanoparticle (NP) shielding effect and the change in the target surface.
Figure 13.Mass-weighted particle size analysis of Au nanoparticles synthesized at , and 1400 μm using an analytical ultracentrifuge for smaller Au nanoparticles below 7 nm, at 30,000 r/min.
Figure 14.Tukey’s least significance difference (LSD) test, results of statistical analysis of variance (ANOVA). Red squares indicate the significant difference in mean size values between two denoted lateral distances. Probability of F-test ().
Figure 15.Each shadowgraph viewpoint reveals two-dimensional parameters: top view bubble half-width (a) and vertical bubble radius (b); side-view bubble half-width (a’) and bubble height (h)—a and a’ are the same parameter (bubble half-width) from two view angles.
Figure 16.Cavitation bubble three-dimensional radius evolution as a function of time, based on YAG shadowgraph imaging. Each shadowgraph viewpoint reveals two-dimensional parameters: top-view (t.v.) bubble horizontal radius (a) and bubble vertical radius (b); side-view (s.v.) bubble half-width (a’) and bubble height (h) for equivalent to 0, 460, and 1075 μm. a and a’ are the same parameter (bubble half-width) from the two view angles, which used a similarity indicator for the shadowgraphy experiments from two angles.
Figure 17.Center-to-center inter bubble distance (IBD) measurements based on YAG double pulse experiments at and 1075 μm (left axis) are plotted as well as attraction velocity toward induced cavitation bubbles (right axis). All cavitation bubbles collapsed at 40 μs at both and 1075 μm. Unlike pair bubbles at , which collide and collapse together, the more distant double cavitation bubbles at , despite the presence of slight attraction phenomena, collapse departed far away from each other.
4. CONCLUSION
In the emerging field of laser ablation synthesis of colloids, cavitation bubbles are known to play a key role, not only concerning upscaling strategies but also as the “reactors” where the final nanoparticle product is born. From single-bubble experiments, it is known that particle sizes, in particular the secondary particles, undergo changes during the bubble’s lifetime and that particle growth quenching by solutes added to the liquid happens inside the cavitation bubble. However, the impact of bubble engineering on particle size generated by PLAL, specifically in terms of lateral inter-bubble interactions, remains a largely uncharted territory. In this context, synchronized and spatially separated bubble pairs could be viewed as a model system to explore these effects. In the present pilot study, a combined imaging, modeling, and particle characterization analysis of the influence of the synchronized, spatially offset double pulse-induced cavitation bubble dynamics during laser ablation of Au and YAG in deionized water is presented. Through the use of a coaxial time-resolved diffused shadowgraphy imaging setup, the cavitation bubbles’ merging and collapse are observed and evaluated from both side- and top-views. The study reveals that the interaction between two simultaneous cavitation bubbles strongly depends on the lateral offset distance. Additionally, particle size analysis results indicate that the synthesized nanoparticles’ size distribution is affected by the interaction of double bubbles at a lateral distance of , resulting in a significant increase in mean diameter ranging from 3.2 to 3.7 times. This particle size increase is observed regardless of the ablated material, as demonstrated with both a noble metal and an oxide target. The interacting bubbles exhibit symmetry breaking, leading to distinct shrinking and collapse morphologies and dynamics. Interestingly, a unique interaction is observed for both Au and YAG at lateral inter-pulse separations of , impacting the bubble dynamics and resulting nanoparticle size distribution. It is worth noting that the particle growth or coalescence mechanism is affected, leading to an increase not only in hydrodynamic diameter (indicating agglomeration/aggregation) but also in primary particle diameter and a significantly higher abundance of larger spheres when the bubble pair interaction is strong. This observation suggests an irreversible influence on particle growth or coalescence, rather than solely causing hydrodynamic instabilities in the liquid phase. When viewed from a top-view angle at a lateral distance of , inter-bubble jets form just before the collapse phase, converging toward each other and resulting in the coalescence of the bubble pair. During their expansion phase, the cavitation bubbles remain stationary but travel on the surface toward each other at a maximum speed of 90 m/s, potentially modifying the nanoparticle formation mechanism within the bubble interior during merging and collapse, thus leading to increased nanoparticle size. The bubble movement effect on the target surface was characterized by inter-bubble distance measurements. The observed trends have been confirmed by high-resolution numerical simulations, showing that totally different jetting phenomena during the late stages of the bubble collapse set in if a bubble pair is present. Overall, the morphology change, migration of the cavitation bubbles toward each other, and eventual merging significantly affect the nanoparticle size distribution.
This study paves the way toward an expanded understanding of bubble effects on the particle sizes that result from PLAL, beyond today’s knowledge, which is mainly derived from isolated-bubble theoretical and experimental studies. One may consider this as a new approach to manipulate nanoparticle size distribution in PLAL without the addition of extra substances or external pressure/temperature, demonstrating that modification of the interaction between cavitation bubbles significantly influences the nanoparticle formation mechanism as well. Practically, this insight may be used to avoid or induce the nanoparticle size growth by controlling the inter-pulse separation in synchronous double-pulse PLAL. Nevertheless, the bubble-pair model system represents an initial step, and it serves as a foundation from which further investigations can explore temporal offsets between bubble pairs (in the microsecond range) and can examine scenarios involving a greater number of interacting bubbles. These studies would approach situations where multi-beams are combined with high-speed lateral beam displacement, leading to advancements in bubble-engineered PLAL.
Acknowledgment
Acknowledgment. We thank Dr. Kateryna Loza for assistance with the STEM measurements of Au and YAG nanoparticles and Florian de Kock for performing AUC measurements and evaluation.
The authors acknowledge funding by the Deutsche Forschungsgemeinschaft (DFG, German Research Foundation). We further thank the DFG and NRW for funding in the frame of the program “Forschungsgeräte.” B. Gökce additionally acknowledges funding from the DFG, project GO 2566/10-1. The authors gratefully acknowledge support from the Open Access Publication Fund of the University of Wuppertal. The authors gratefully acknowledge the computational and data resources provided by the Leibniz Supercomputing Centre (https://www.lrz.de).
Author Contributions.Farbod Riahi: investigation, validation, visualization, writing original draft, reviewing and editing the manuscript. Alexander Bußmann: investigation, visualization, reviewing and editing the manuscript. Carlos Doñate-Buendia: reviewing and editing the manuscript, supervision. Stefan Adami: reviewing and editing the manuscript, supervision. Nikolaus Adams: conceptualization, reviewing and editing the manuscript, funding acquisition, supervision. Stephan Barcikowski: conceptualization, reviewing and editing the manuscript, funding acquisition, supervision. Bilal Gökce: conceptualization, methodology, reviewing and editing the manuscript, funding acquisition, supervision.
APPENDIX A: DETAILS OF PLAL SETUP
The PLAL nanoparticle setup with the batch chamber is illustrated in Fig. 10.
APPENDIX B: SINGLE CAVITATION BUBBLE EVOLUTION ON Au SURFACE
Single cavitation bubble evolution on Au surface is shown in Fig. 11.
APPENDIX C: MULTIPULSE CUMULATIVE EFFECT
To explore the multipulse cumulative effect, especially in minute-long PLAL experiments, it is necessary to consider the repeated irradiation of the same surface position by multiple pulses sent through a scanner. Two control experiments were carried out. In the first case, to examine the nanoparticle (NP) shielding effect on cavitation bubble size/dynamics, 25 laser shots were fired on the Au target underwater on the same surface spot in a clean glass cell. The generated colloid was removed, and the glass cell was refilled with ultrapure deionized water (Milli-Q) without changing the target position. Then the 26th laser shot irradiated the target at the same spot. The results indicated that overall below 10% bubble height decreased from the 1st to 25th laser shot, and the 8% size increased between the 25th and 26th shot after nanoparticle removal.
In the second scenario, to investigate the surface change effect on cavitation bubble size, 25 laser shots were sent to the same spot, and the target was moved about 400 μm. Then the 26th laser shot was fired at the new place. Similar to the previous case, the results show a decrease of in size from the 1st to 25th laser shot and about a 2% increase after the 26th shot on the new surface spot.
Both control experiments validated the nanoparticle shielding effect and surface effect on cavitation bubble size, which in both cases were insignificant. Nevertheless, to minimize these effects on shadowgraphy results, targets were moved after each acquisition attempt, and the glass cell was cleaned and refilled with ultrapure deionized water after 100 shots.
APPENDIX D: ANALYTICAL ULTRACENTRIFUGE ANALYSIS FOR SMALLER Au NANOPARTICLES
AUC results are highlighted in Fig. 13.
APPENDIX E: ANOVA SIGNIFICANCE DIFFERENCE ANALYSIS FOR Au
Tukey’s LSD test analyzed ANOVA results are shown in Fig. 14.
APPENDIX F: SHADOWGRAPH VIEWPOINT DEPENDENT PARAMETERS
Shadowgraph viewpoints and parameters are illustated with details in Fig. 15.
APPENDIX G: THREE-DIMENSIONAL CAVITATION BUBBLE RADIUS EVOLUTION
Cavitation bubble radius evolutions in X, Y, and Z axes on YAG surface are shown in Fig. 16.
APPENDIX H: YAG DOUBLE-BUBBLE IBD MEASUREMENTS
Inter-bubble distance measurements on YAG target at and 1075 μm and attraction velocity are illustrated in Fig. 17.
References
[1] J. Zhang, J. Claverie, M. Chaker, D. Ma. Colloidal metal nanoparticles prepared by laser ablation and their applications. ChemPhysChem, 18, 986-1006(2017).
[2] V. Amendola, D. Amans, Y. Ishikawa, N. Koshizaki, S. Scirè, G. Compagnini, S. Reichenberger, S. Barcikowski. Room-temperature laser synthesis in liquid of oxide, metal-oxide core-shells, and doped oxide nanoparticles. Chem. Eur. J., 26, 9206-9242(2020).
[3] A. I. Savchuk, A. Perrone, A. Lorusso, I. D. Stolyarchuk, O. A. Savchuk, O. A. Shporta. ZnMnO diluted magnetic semiconductor nanoparticles: synthesis by laser ablation in liquids, optical and magneto-optical properties. Appl. Surf. Sci., 302, 205-208(2014).
[4] G. K. Yogesh, S. Shukla, D. Sastikumar, P. Koinkar. Progress in pulsed laser ablation in liquid (PLAL) technique for the synthesis of carbon nanomaterials: a review. Appl. Phys. A, 127, 810(2021).
[5] H. Zeng, X. W. Du, S. C. Singh, S. A. Kulinich, S. Yang, J. He, W. Cai. Nanomaterials via laser ablation/irradiation in liquid: a review. Adv. Funct. Mater., 22, 1333-1353(2012).
[6] D. Zhang, B. Gökce, S. Barcikowski. Laser synthesis and processing of colloids: fundamentals and applications. Chem. Rev., 117, 3990-4103(2017).
[7] S. Peggiani, P. Marabotti, R. A. Lotti, A. Facibeni, P. Serafini, A. Milani, V. Russo, A. Li Bassi, C. S. Casari. Solvent-dependent termination, size and stability in polyynes synthesized via laser ablation in liquids. Phys. Chem. Chem. Phys., 22, 26312-26321(2020).
[8] D. Amans, C. Malaterre, M. Diouf, C. Mancini, F. Chaput, G. Ledoux, G. Breton, Y. Guillin, C. Dujardin, K. Masenelli-Varlot, P. Perriat. Synthesis of oxide nanoparticles by pulsed laser ablation in liquids containing a complexing molecule: impact on size distributions and prepared phases. J. Phys. Chem. C, 115, 5131-5139(2011).
[9] A. Letzel, S. Reich, T. Dos Santos Rolo, A. Kanitz, J. Hoppius, A. Rack, M. P. Olbinado, A. Ostendorf, B. Gökce, A. Plech, S. Barcikowski. Time and mechanism of nanoparticle functionalization by macromolecular ligands during pulsed laser ablation in liquids. Langmuir, 35, 3038-3047(2019).
[10] F. Davodi, E. Mühlhausen, D. Settipani, E. L. Rautama, A. P. Honkanen, S. Huotari, G. Marzun, P. Taskinen, T. Kallio. Comprehensive study to design advanced metal-carbide@garaphene and metal-carbide@iron oxide nanoparticles with tunable structure by the laser ablation in liquid. J. Colloid Interface Sci., 556, 180-192(2019).
[11] F. Waag, W. I. M. A. Fares, Y. Li, C. Andronescu, B. Gökce, S. Barcikowski. Identification of the main mixing process in the synthesis of alloy nanoparticles by laser ablation of compacted micropowder mixtures. J. Mater. Sci., 57, 3041-3056(2022).
[12] A. Tymoczko, M. Kamp, C. Rehbock, L. Kienle, E. Cattaruzza, S. Barcikowski, V. Amendola. One-step synthesis of Fe–Au core–shell magnetic-plasmonic nanoparticles driven by interface energy minimization. Nanoscale Horiz., 4, 1326-1332(2019).
[13] J. Johny, M. Kamp, O. Prymak, A. Tymoczko, U. Wiedwald, C. Rehbock, U. Schürmann, R. Popescu, D. Gerthsen, L. Kienle, S. Shaji, S. Barcikowski. Formation of Co–Au core-shell nanoparticles with thin gold shells and soft magnetic ϵ-cobalt cores ruled by thermodynamics and kinetics. J. Phys. Chem. C, 125, 9534-9549(2021).
[14] R. Streubel, G. Bendt, B. Gökce. Pilot-scale synthesis of metal nanoparticles by high-speed pulsed laser ablation in liquids. Nanotechnology, 27, 205602(2016).
[15] S. Jendrzej, B. Gökce, M. Epple, S. Barcikowski. How size determines the value of gold: economic aspects of wet chemical and laser-based metal colloid synthesis. ChemPhysChem, 18, 1012-1019(2017).
[16] S. Dittrich, S. Kohsakowski, B. Wittek, C. Hengst, B. Gökce, S. Barcikowski, S. Reichenberger. Increasing the size-selectivity in laser-based g/h liquid flow synthesis of Pt and PtPd nanoparticles for CO and NO oxidation in industrial automotive exhaust gas treatment benchmarking. Nanomaterials, 10, 1582(2020).
[17] C. Doñate-Buendía, M. Fernández-Alonso, J. Lancis, G. Mínguez-Vega. Overcoming the barrier of nanoparticle production by femtosecond laser ablation in liquids using simultaneous spatial and temporal focusing. Photon. Res., 7, 1249-1257(2019).
[18] R. Nadarajah, S. Barcikowski, B. Gökce. Picosecond laser-induced surface structures on alloys in liquids and their influence on nanoparticle productivity during laser ablation. Opt. Express, 28, 2909-2924(2020).
[19] T. Löffler, F. Waag, B. Gökce, A. Ludwig, S. Barcikowski, W. Schuhmann. Comparing the activity of complex solid solution electrocatalysts using inflection points of voltammetric activity curves as activity descriptors. ACS Catal., 11, 1014-1023(2021).
[20] C. Kinnear, T. L. Moore, L. Rodriguez-Lorenzo, B. Rothen-Rutishauser, A. Petri-Fink. Form follows function: nanoparticle shape and its implications for nanomedicine. Chem. Rev., 117, 11476-11521(2017).
[21] C. Doñate-Buendia, R. Torres-Mendieta, A. Pyatenko, E. Falomir, M. Fernández-Alonso, G. Mínguez-Vega. Fabrication by laser irradiation in a continuous flow jet of carbon quantum dots for fluorescence imaging. ACS Omega, 3, 2735-2742(2018).
[22] R. Riedel, N. Mahr, C. Yao, A. Wu, F. Yang, N. Hampp. Synthesis of gold-silica core-shell nanoparticles by pulsed laser ablation in liquid and their physico-chemical properties towards photothermal cancer therapy. Nanoscale, 12, 3007-3018(2020).
[23] C. Petridis, K. Savva, E. Kymakis, E. Stratakis. Laser generated nanoparticles based photovoltaics. J. Colloid Interface Sci., 489, 28-37(2017).
[24] A. L. Bailly, F. Correard, A. Popov, G. Tselikov, F. Chaspoul, R. Appay, A. Al-Kattan, A. V. Kabashin, D. Braguer, M. A. Esteve. In vivo evaluation of safety, biodistribution and pharmacokinetics of laser-synthesized gold nanoparticles. Sci. Rep., 9, 12890(2019).
[25] C. Doñate-Buendia, P. Kürnsteiner, F. Stern, M. B. Wilms, R. Streubel, I. M. Kusoglu, J. Tenkamp, E. Bruder, N. Pirch, S. Barcikowski, K. Durst, J. H. Schleifenbaum, F. Walther, B. Gault, B. Gökce. Microstructure formation and mechanical properties of ODS steels built by laser additive manufacturing of nanoparticle coated iron-chromium powders. Acta Mater., 206, 116566(2021).
[26] R. C. Forsythe, C. P. Cox, M. K. Wilsey, A. M. Müller. Pulsed laser in liquids made nanomaterials for catalysis. Chem. Rev., 121, 7568-7637(2021).
[27] A. E. Nel, L. Mädler, D. Velegol, T. Xia, E. M. V. Hoek, P. Somasundaran, F. Klaessig, V. Castranova, M. Thompson. Understanding biophysicochemical interactions at the nano–bio interface. Nat. Mater., 8, 543-557(2009).
[28] A. Letzel, B. Gökce, P. Wagener, S. Ibrahimkutty, A. Menzel, A. Plech, S. Barcikowski. Size quenching during laser synthesis of colloids happens already in the vapor phase of the cavitation bubble. J. Phys. Chem. C, 121, 5356-5365(2017).
[29] J. Tomko, S. M. O’Malley, C. Trout, J. J. Naddeo, R. Jimenez, J. C. Griepenburg, W. Soliman, D. M. Bubb. Cavitation bubble dynamics and nanoparticle size distributions in laser ablation in liquids. Colloids Surf. A, 522, 368-372(2017).
[30] P. Wagener, G. Brandes, A. Schwenke, S. Barcikowski. Impact of in situ polymer coating on particle dispersion into solid laser-generated nanocomposites. Phys. Chem. Chem. Phys., 13, 5120-5126(2011).
[31] S. Petersen, S. Barcikowski. In situ bioconjugation: single step approach to tailored nanoparticle-bioconjugates by ultrashort pulsed laser ablation. Adv. Funct. Mater., 19, 1167-1172(2009).
[32] C. Rehbock, V. Merk, L. Gamrad, R. Streubel, S. Barcikowski. Size control of laser-fabricated surfactant-free gold nanoparticles with highly diluted electrolytes and their subsequent bioconjugation. Phys. Chem. Chem. Phys., 15, 3057-3067(2013).
[33] A. Kanitz, M. R. Kalus, E. L. Gurevich, A. Ostendorf, S. Barcikowski, D. Amans. Review on experimental and theoretical investigations of the early stage, femtoseconds to microseconds processes during laser ablation in liquid-phase for the synthesis of colloidal nanoparticles. Plasma Sources Sci. Technol., 28, 103001(2019).
[34] A. Chemin, M. W. Fawaz, D. Amans. Investigation of the blast pressure following laser ablation at a solid–fluid interface using shock waves dynamics in air and in water. Appl. Surf. Sci., 574, 151592(2022).
[35] M. Dell’Aglio, A. Santagata, G. Valenza, A. De Stradis, A. De Giacomo. Study of the effect of water pressure on plasma and cavitation bubble induced by pulsed laser ablation in liquid of silver and missed variations of observable nanoparticle features. ChemPhysChem, 18, 1165-1174(2017).
[36] S. Reich, A. Letzel, A. Menzel, N. Kretzschmar, B. Gökce, S. Barcikowski, A. Plech. Early appearance of crystalline nanoparticles in pulsed laser ablation in liquids dynamics. Nanoscale, 11, 6962-6969(2019).
[37] S. Barcikowski, A. Plech, K. S. Suslick, A. Vogel. Materials synthesis in a bubble. MRS Bull., 44, 382-391(2019).
[38] P. Wagener, A. Schwenke, B. N. Chichkov, S. Barcikowski. Pulsed laser ablation of zinc in tetrahydrofuran: bypassing the cavitation bubble. J. Phys. Chem. C, 114, 7618-7625(2010).
[39] S. Reich, P. Schönfeld, A. Letzel, S. Kohsakowski, M. Olbinado, B. Gökce, S. Barcikowski, A. Plech. Fluence threshold behaviour on ablation and bubble formation in pulsed laser ablation in liquids. ChemPhysChem, 18, 1084-1090(2017).
[40] V. Amendola, M. Meneghetti. What controls the composition and the structure of nanomaterials generated by laser ablation in liquid solution?. Phys. Chem. Chem. Phys., 15, 3027-3046(2013).
[41] K. Sasaki, T. Nakano, W. Soliman, N. Takada. Effect of pressurization on the dynamics of a cavitation bubble induced by liquid-phase laser ablation. Appl. Phys. Express, 2, 0465011(2009).
[42] A. Menéndez-Manjón, B. N. Chichkov, S. Barcikowski. Influence of water temperature on the hydrodynamic diameter of gold nanoparticles from laser ablation. J. Phys. Chem. C, 114, 2499-2504(2010).
[43] N. Takada, A. Fujikawa, K. Sasaki. Control of plasma and cavitation bubble in liquid-phase laser ablation using supersonic waves. Jpn. J. Appl. Phys., 50, 126201(2011).
[44] N. Takada, A. Fujikawa, N. Koshizaki, K. Sasaki. Effect of ultrasonic wave on the syntheses of Au and ZnO nanoparticles by laser ablation in water. Appl. Phys. A, 110, 835-839(2013).
[45] C. Kerse, H. Kalaycloⓖ, P. Elahi, B. Çetin, D. K. Kesim, Ö. Akçaalan, S. Yavaş, M. D. Aşlk, B. Öktem, H. Hoogland, R. Holzwarth, F. Ö. Ilday. Ablation-cooled material removal with ultrafast bursts of pulses. Nature, 537, 84-88(2016).
[46] M. E. Povarnitsyn, T. E. Itina, K. V. Khishchenko, P. R. Levashov. Suppression of ablation in femtosecond double-pulse experiments. Phys. Rev. Lett., 103, 195002(2009).
[47] J. Schille, L. Schneider, S. Kraft, L. Hartwig, U. Loeschner. Experimental study on double-pulse laser ablation of steel upon multiple parallel-polarized ultrashort-pulse irradiations. Appl. Phys. A, 122, 644(2016).
[48] C. D. Buendia, M. Spellauge, R. Streubel, F. Riahi, S. Barcikowski, H. P. Huber, B. Gökce. Double-pulse laser ablation in liquids: nanoparticle bimodality reduction by sub-nanosecond interpulse delay optimization. J. Phys. D, 56, 104001(2023).
[49] M. Dell’Aglio, R. Gaudiuso, R. Elrashedy, O. De Pascale, G. Palazzo, A. De Giacomo. Collinear double pulse laser ablation in water for the production of silver nanoparticles. Phys. Chem. Chem. Phys., 15, 20868-20875(2013).
[50] M. López-Claros, M. Dell’Aglio, R. Gaudiuso, A. Santagata, A. De Giacomo, F. J. Fortes, J. J. Laserna. Double pulse laser induced breakdown spectroscopy of a solid in water: effect of hydrostatic pressure on laser induced plasma, cavitation bubble and emission spectra. Spectrochim. Acta B, 133, 63-71(2017).
[51] K. Y. Lim, P. A. Quinto-Su, E. Klaseboer, B. C. Khoo, V. Venugopalan, C. D. Ohl. Nonspherical laser-induced cavitation bubbles. Phys. Rev. E, 81, 016308(2010).
[52] C. Chen, L. V. Zhigilei. Atomistic modeling of pulsed laser ablation in liquid: spatially and time-resolved maps of transient nonequilibrium states and channels of nanoparticle formation. Appl. Phys. A, 129, 288(2023).
[53] M. Spellauge, C. Doñate-Buendía, S. Barcikowski, B. Gökce, H. P. Huber. Comparison of ultrashort pulse ablation of gold in air and water by time-resolved experiments. Light Sci. Appl., 11, 68(2022).
[54] C. Y. Shih, M. V. Shugaev, C. Wu, L. V. Zhigilei. Generation of subsurface voids, incubation effect, and formation of nanoparticles in short pulse laser interactions with bulk metal targets in liquid: molecular dynamics study. J. Phys. Chem. C, 121, 16549-16567(2017).
[55] C. Y. Shih, M. V. Shugaev, C. Wu, L. V. Zhigilei. The effect of pulse duration on nanoparticle generation in pulsed laser ablation in liquids: insights from large-scale atomistic simulations. Phys. Chem. Chem. Phys., 22, 7077-7099(2020).
[56] C. Chen, L. V. Zhigilei. Ultrashort pulse laser ablation in liquids: probing the first nanoseconds of underwater phase explosion. Light Sci. Appl., 11, 111(2022).
[57] C. Shih, R. Streubel, J. Heberle, A. Letzel, M. V. Shugaev, C. Wu, M. Schmidt, B. Gökce, S. Barcikowski, L. V. Zhigilei. Two mechanisms of nanoparticle generation in picosecond laser ablation in liquids: the origin of the bimodal size distribution. Nanoscale, 10, 6900-6910(2018).
[58] S. Ibrahimkutty, P. Wagener, A. Menzel, A. Plech, S. Barcikowski. Nanoparticle formation in a cavitation bubble after pulsed laser ablation in liquid studied with high time resolution small angle X-ray scattering. Appl. Phys. Lett., 101, 103104(2012).
[59] S. Kohsakowski, B. Gökce, R. Tanabe, P. Wagener, A. Plech, Y. Ito, S. Barcikowski. Target geometry and rigidity determines laser-induced cavitation bubble transport and nanoparticle productivity–a high-speed videography study. Phys. Chem. Chem. Phys., 18, 16585-16593(2016).
[60] A. Vogel, W. Hentschel, J. Holzfuss, W. Lauterborn. Cavitation bubble dynamics and acoustic transient generation in ocular surgery with pulsed neodymium:YAG lasers. Ophthalmology, 93, 1259-1269(1986).
[61] J. Long, M. Eliceiri, Z. Vangelatos, Y. Rho, L. Wang, Z. Su, X. Xie, Y. Zhang, C. P. Grigoropoulos. Early dynamics of cavitation bubbles generated during ns laser ablation of submerged targets. Opt. Express, 28, 14300-14309(2020).
[62] A. Bußmann, F. Riahi, B. Gökce, S. Adami, S. Barcikowski, N. A. Adams. Investigation of cavitation bubble dynamics near a solid wall by high-resolution numerical simulation. Phys. Fluids, 35, 016115(2023).
[63] F. Reuter, C. D. Ohl. Supersonic needle-jet generation with single cavitation bubbles. Appl. Phys. Lett., 118, 134103(2021).
[64] B. Han, K. Köhler, K. Jungnickel, R. Mettin, W. Lauterborn, A. Vogel. Dynamics of laser-induced bubble pairs. J. Fluid Mech., 771, 706-742(2015).
[65] P. Cui, Q. X. Wang, S. P. Wang, A. M. Zhang. Experimental study on interaction and coalescence of synchronized multiple bubbles. Phys. Fluids, 28, 012103(2016).
[66] R. Chen, W. Liang, J. Zheng, X. Li, Y. Lin. Experimental study on the interaction of three linearly arranged spark bubbles with controlled phase differences. Phys. Fluids, 34, 037105(2022).
[67] S. W. Fong, D. Adhikari, E. Klaseboer, B. C. Khoo. Interactions of multiple spark-generated bubbles with phase differences. Exp. Fluids, 46, 705-724(2009).
[68] Y. Tomita, K. Sato. Pulsed jets driven by two interacting cavitation bubbles produced at different times. J. Fluid Mech., 819, 465-493(2017).
[69] N. Bremond, M. Arora, S. M. Dammer, D. Lohse. Interaction of cavitation bubbles on a wall. Phys. Fluids, 18, 121505(2006).
[70] R. Han, A. Zhang, Y. Liu. Numerical investigation on the dynamics of two bubbles. Ocean Eng., 110, 325-338(2015).
[71] D. Fuster, C. Dopazo, G. Hauke. Liquid compressibility effects during the collapse of a single cavitating bubble. J. Acoust. Soc. Am., 129, 122-131(2011).
[72] R. Streubel, S. Barcikowski, B. Gökce. Continuous multigram nanoparticle synthesis by high-power, high-repetition-rate ultrafast laser ablation in liquids. Opt. Lett., 41, 1486-1489(2016).
[73] T. Hupfeld, G. Laurens, S. Merabia, S. Barcikowski, B. Gökce, D. Amans. Dynamics of laser-induced cavitation bubbles at a solid–liquid interface in high viscosity and high capillary number regimes. J. Appl. Phys., 127, 044306(2020).
[74] O. Le Métayer, R. Saurel. The Noble-Abel stiffened-gas equation of state. Phys. Fluids, 28, 046102(2016).
[75] Y. Tomita, A. Shima. On the behavior of a spherical bubble and the impulse pressure in a viscous compressible liquid. Bull. JSME, 20, 1453-1460(1977).
[76] K. M. Kim, J. H. Ryu. Synthesis of Y3Al5O12:Ce3+ colloidal nanocrystals by pulsed laser ablation and their luminescent properties. J. Alloys Compd., 576, 195-200(2013).
[77] N. T. K. Thanh, N. Maclean, S. Mahiddine. Mechanisms of nucleation and growth of nanoparticles in solution. Chem. Rev., 114, 7610-7630(2014).
[78] D. Zhang, J. Liu, C. H. Liang. Perspective on how laser-ablated particles grow in liquids. Sci. China Phys. Mech. Astron., 60, 074201(2017).
[79] F. Reuter, Q. Zeng, C. D. Ohl. The Rayleigh prolongation factor at small bubble to wall stand-off distances. J. Fluid Mech., 944, A11(2022).
[80] A. De Giacomo, M. Dell’Aglio, A. Santagata, R. Gaudiuso, O. De Pascale, P. Wagener, G. C. Messina, G. Compagnini, S. Barcikowski. Cavitation dynamics of laser ablation of bulk and wire-shaped metals in water during nanoparticles production. Phys. Chem. Chem. Phys., 15, 3083-3092(2013).
[81] M. Dell’Aglio, A. De Giacomo, S. Kohsakowski, S. Barcikowski, P. Wagener, A. Santagata. Pulsed laser ablation of wire-shaped target in a thin water jet: effects of plasma features and bubble dynamics on the PLAL process. J. Phys. D, 50, 185204(2017).
[82] T. T. P. Nguyen, R. Tanabe-Yamagishi, Y. Ito. Impact of liquid layer thickness on the dynamics of nano- to sub-microsecond phenomena of nanosecond pulsed laser ablation in liquid. Appl. Surf. Sci., 470, 250-258(2019).
[83] C. Lechner, W. Lauterborn, M. Koch, R. Mettin. Jet formation from bubbles near a solid boundary in a compressible liquid: numerical study of distance dependence. Phys. Rev. Fluids, 5, 093604(2020).
[84] P. Cui, Q. X. Wang, S. P. Wang, A. M. Zhang. Experimental study on interaction and coalescence of synchronized multiple bubbles. Phys. Fluids, 28, 012103(2016).
[85] P. Wagener, S. Ibrahimkutty, A. Menzel, A. Plech, S. Barcikowski. Dynamics of silver nanoparticle formation and agglomeration inside the cavitation bubble after pulsed laser ablation in liquid. Phys. Chem. Chem. Phys., 15, 3068-3074(2013).
[86] S. Reich, P. Schönfeld, P. Wagener, A. Letzel, S. Ibrahimkutty, B. Gökce, S. Barcikowski, A. Menzel, T. dos Santos Rolo, A. Plech. Pulsed laser ablation in liquids: impact of the bubble dynamics on particle formation. J. Colloid Interface Sci., 489, 106-113(2017).
[87] F. Reuter, R. Mettin. Mechanisms of single bubble cleaning. Ultrason. Sonochem., 29, 550-562(2016).
[88] J. Tomko, J. J. Naddeo, R. Jimenez, Y. Tan, M. Steiner, J. M. Fitz-Gerald, D. M. Bubb, S. M. O’Malley. Size and polydispersity trends found in gold nanoparticles synthesized by laser ablation in liquids. Phys. Chem. Chem. Phys., 17, 16327-16333(2015).
[89] M. Dell’Aglio, A. de Giacomo. Plasma charging effect on the nanoparticles releasing from the cavitation bubble to the solution during nanosecond pulsed laser ablation in liquid. Appl. Surf. Sci., 515, 146031(2020).


