• High Power Laser and Particle Beams
  • Vol. 35, Issue 3, 031001 (2023)
Zhibo Liu, Qiong Ma, Xun Zhou, Yu Wei, and Hongxiang Kang*
Author Affiliations
  • Institute of Radiation Medicine, Academy of Military Medical Science, Academy of Military Science PLA China, Beijing 108502, China
  • show less
    DOI: 10.11884/HPLPB202335.220292 Cite this Article
    Zhibo Liu, Qiong Ma, Xun Zhou, Yu Wei, Hongxiang Kang. Skin damage in mice induced by different power densities of 1064 nm laser[J]. High Power Laser and Particle Beams, 2023, 35(3): 031001 Copy Citation Text show less
    Experimental diagram of laser irradiation on the skin of mouse
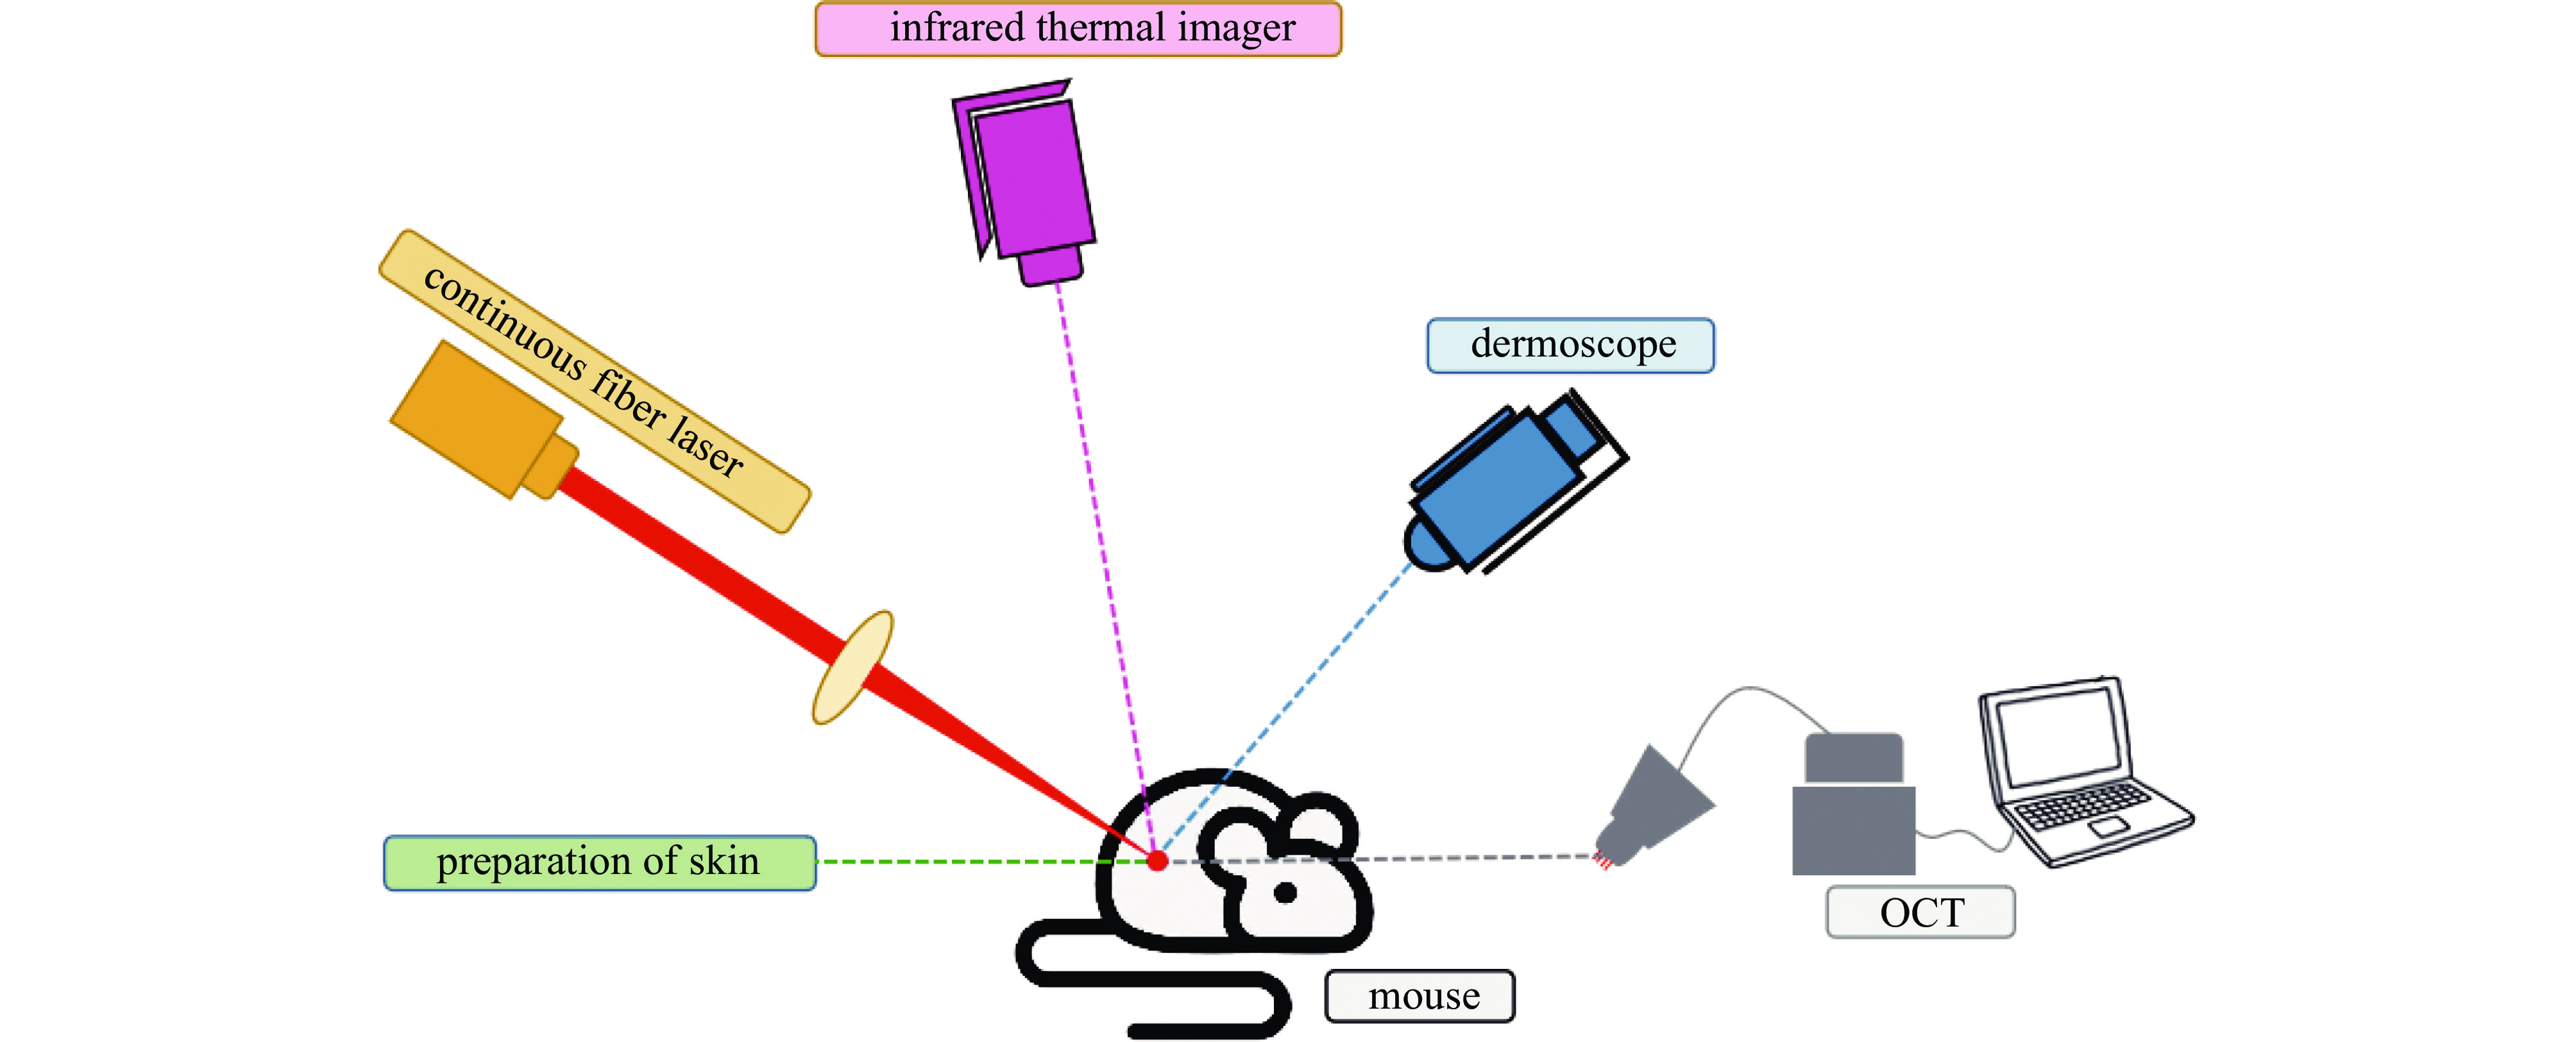
    Fig. 1. Experimental diagram of laser irradiation on the skin of mouse
    Dermoscope images of injury in mice skin at different duration of 1064 nm laser irradiation (400 ms after irradiation; scale bar of dermoscope images: 1 mm)
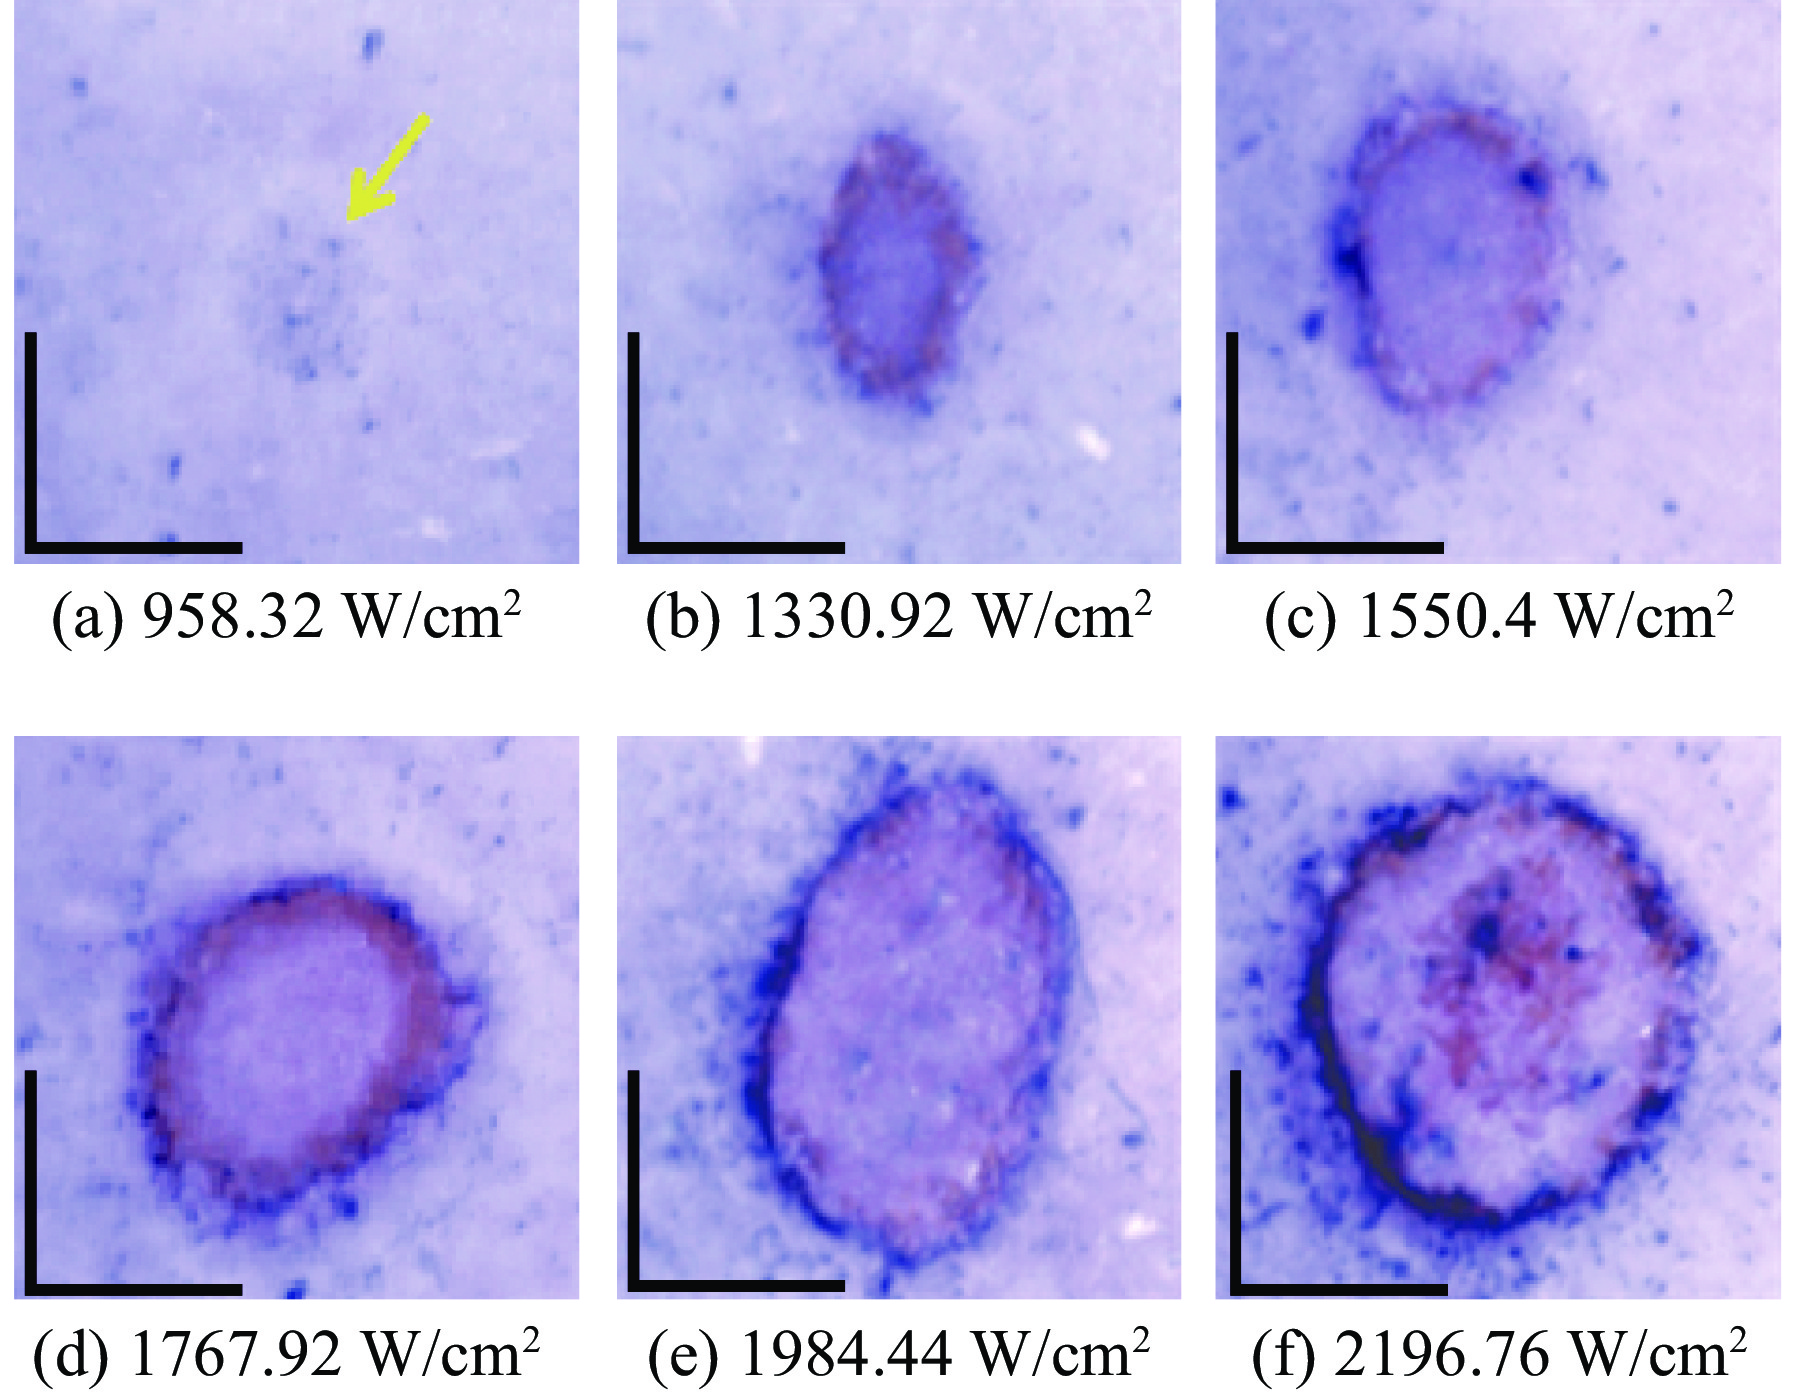
    Fig. 2. Dermoscope images of injury in mice skin at different duration of 1064 nm laser irradiation (400 ms after irradiation; scale bar of dermoscope images: 1 mm)
    Effect of different power density laser irradiation on the skin lesion area of mice
    Fig. 3. Effect of different power density laser irradiation on the skin lesion area of mice
    OCT images of injury in mice skin at different duration of 1064 nm laser irradiation(400 ms after irradiation; scale bar of OCT images:1 mm)
    Fig. 4. OCT images of injury in mice skin at different duration of 1064 nm laser irradiation(400 ms after irradiation; scale bar of OCT images:1 mm)
    Effect of laser irradiation with different power density on the depth of the skin damage in mice
    Fig. 5. Effect of laser irradiation with different power density on the depth of the skin damage in mice
    Pathomorphological changes of skin wounds in mice irradiated by 1064nm laser (hematoxylin-eosin staining ×100)
    Fig. 6. Pathomorphological changes of skin wounds in mice irradiated by 1064nm laser (hematoxylin-eosin staining ×100)
    Temperature-time fitting curve
    Fig. 7. Temperature-time fitting curve
    Temperature-time fitting curve
    Fig. 8. Temperature-time fitting curve
    laser irradiation power density/(W·cm−2) damageappearance
    <958first­degree injuryRedness at laser irradiation, recovered after some time.
    958~1160second­degree injuryWhite blisters, deformed and bulging (crumpled) skin around the injury.
    1160~1370third­degree injuryVaporization of small amounts (or few lesions) on the superficial layer of the skin, blanching skin blisters with a bulging circle around the injury spot, and a shallow pit like focal macule.
    1370~2190fourth­degree injuryThrough the skin up to the fat layer, superficial vaporization was severe, splashing oil droplets, and around the injury with dark yellow eschar as red pit like spots.
    Table 1. Grading of skin lesions in biological skin tissue by 1064 nm laser
    laser irradiation power density/(W·cm−2) Ω
    3741.80×10−5
    5613.00×10−4
    7621.9
    95814
    116327
    1369111
    15541200
    17381.90×108
    19345.50×1014
    Table 2. The corresponding relationship between the degree of skin thermal injury and laser irradiation power
    Zhibo Liu, Qiong Ma, Xun Zhou, Yu Wei, Hongxiang Kang. Skin damage in mice induced by different power densities of 1064 nm laser[J]. High Power Laser and Particle Beams, 2023, 35(3): 031001
    Download Citation