
Xuedong SONG, Yingchao MA, Qi ZHOU, Da LIAN, Luwei YU, Xiaonan MAO. Real-time Bad Pixel Detection and Compensation Method for Short-wave Infrared Camera[J]. Acta Photonica Sinica, 2022, 51(9): 0910004
- Acta Photonica Sinica
- Vol. 51, Issue 9, 0910004 (2022)
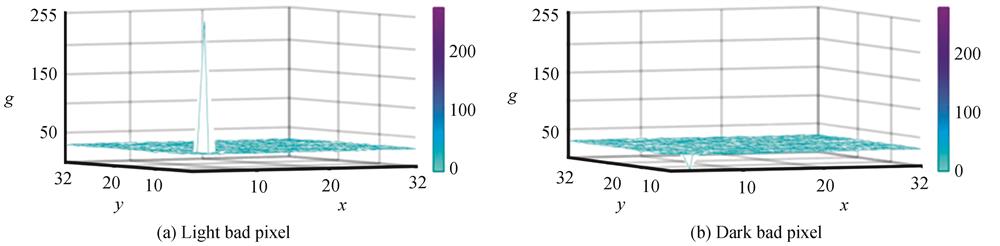
Fig. 1. Bad pixel 3D image
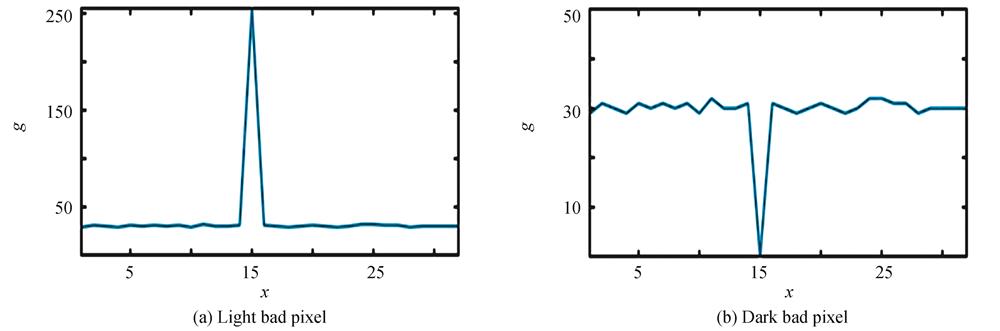
Fig. 2. Gray value curves of bad pixel and neighboring normal pixels
Fig. 3. Gray gradient value curves of bad pixel and neighboring normal pixels
Fig. 4. The infrared image of star target
Fig. 5. 3D image of bad pixel in infrared image
Fig. 6. The detection window of bad pixels
Fig. 7. The compensation window of bad pixels
Fig. 8. Background 1
Fig. 9. Background 2
Fig. 10. The detection results based on gray value of different background
Fig. 11. The detection results based on gray gradient value of different background
Fig. 12. The light bad pixels in both background and star target
Fig. 13. The detection results of bad pixels
Fig. 14. The neighboring bad pxiels
Fig. 15. The detection results of bad pixels
Fig. 16. The compensation results of bad pixels
Fig. 17. The multiple bad pixels in star image
Fig. 18. The detection results of bad pixels
Fig. 19. The compensation results of bad pixels
|
Table 1. The influence of bad pixels on centroid coordinate extraction of star target
|
Table 2. The detection accuracy of bad pixels
|
Table 3. The result of extracting star's centroid coordinates


Set citation alerts for the article
Please enter your email address

© Copyright 2018-2021 | Chinese Laser Press. All Rights Reserved 沪ICP备15018463号-20