
Zhen-Wei Wu, Wei-Hua Wang. Linking local connectivity to atomic-scale relaxation dynamics in metallic glass-forming systems [J]. Acta Physica Sinica, 2020, 69(6): 066101-1
- Acta Physica Sinica
- Vol. 69, Issue 6, 066101-1 (2020)
Fig. 1. Structure factor S (q
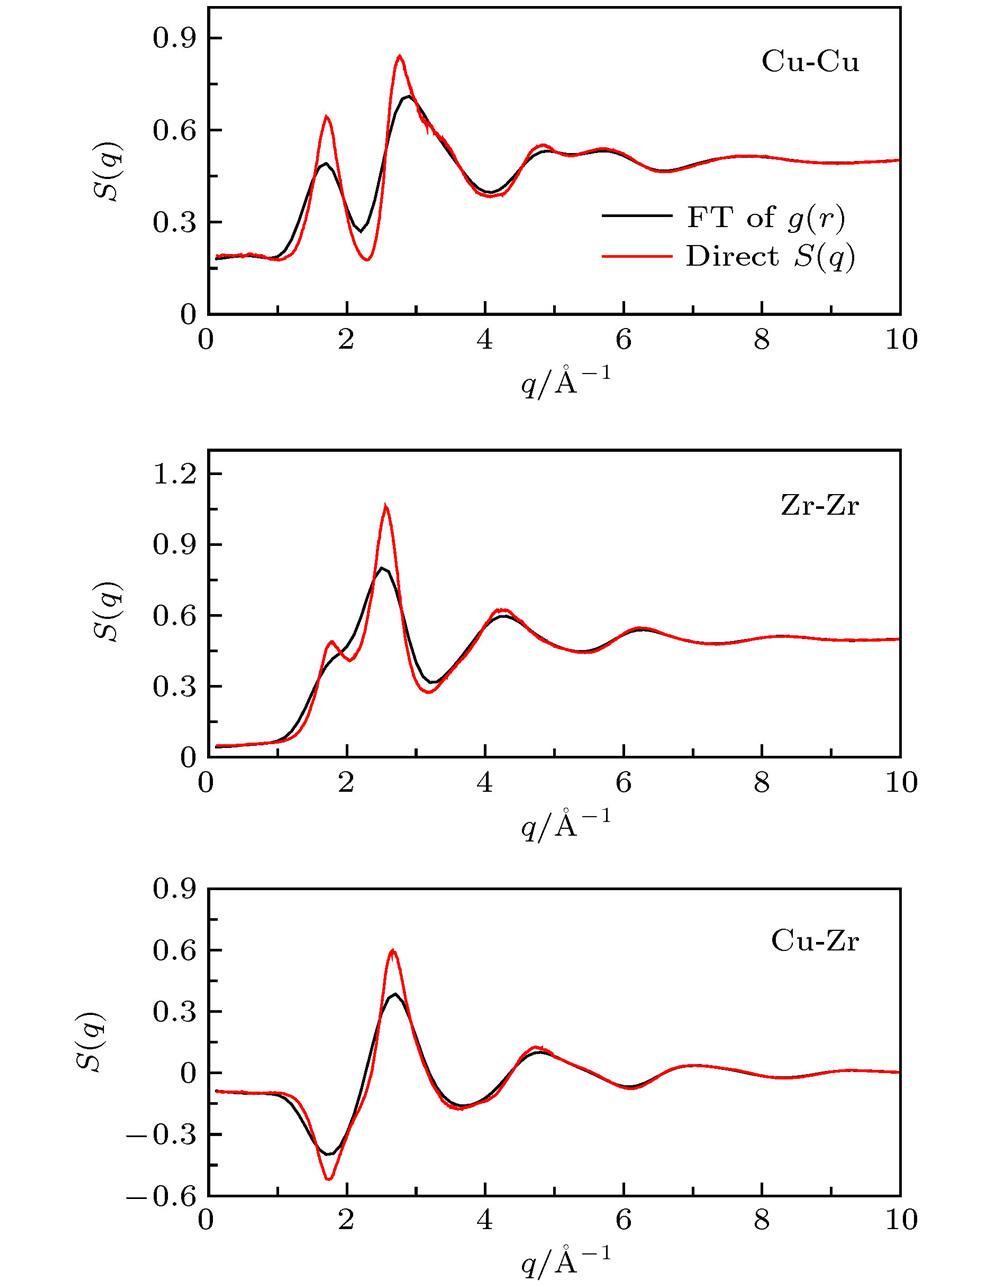
Fig. 2. Structure factors S (q ) of liquid Cu50Zr50 at 1000 K, obtained with different protocols.
Fig. 3. A small example graph (or network) with its adjacency matrix[44].
Fig. 4. Mean-square displacement for Cu/Zr atoms in liquid CuZr alloy at 1000 K.
Fig. 5. Comparison between F (q , t ) and F s(q , t ) at different q values: (a) q = 0.6 Å-1; (b) q = 2.8 Å-1.
Fig. 6. Vibrational density of states for CuZr glass with different protocols, and the test for the present of a boson peak[49].
Fig. 7. Vibrational density of states obtained by calculation of the time Fourier transformation of the velocity auto-correlation function. It can be seen that there is no apparent aging effect at 10 K.
Fig. 8. Illustration of the definition of particles with different connectivities k : Particles in blue are the center of an icosahedral-like cluster.
Fig. 9. Probability that an icosahedron is of type k [49]: (a) T = 1100 K; (b) T = 1000 K; (c) T = 950 K.
Fig. 11. Short-time behavior of the self-intermediate scattering function of particles with different local connectivity k (symbols)[49]. The wave-vector is q = 2.8 Å–1 and T = 1000 K. The solid lines are fits to the data with Eq. (9 ). Also included is F s(q , t ) for the Cu atoms in an icosahedral cluster (dashed red line), the Cu atoms not in an icosahedral cluster (blue dashed line), and all Cu atoms (green). The black dashed line is the correlation function averaged over all atoms. The upper inset shows the same data in a larger time interval.
Fig. 12. Vibrational density of states of particles with different local connectivity k .
Fig. 13. (a) Both the high and low frequency modes, ω H and ω L, increases with increasing k [49]; (b) the fraction of motion C L/H increases for ω L and decreases for ω H; (c) the high frequency mode ω H(q ) is approximately q -independent, characteristic of localization of the vibrational modes; (d) the low frequency mode ω L(q ) increases monotonically with increasing q , characteristic of collective dynamics.
Fig. 14. (a) Long-time decay of the correlation functions at q = 2.8 Å–1 for particles with different k values[49]. The black solid lines are the Kohlrausch-Williams-Watt (KWW) fits. (b) The k dependence of the exponent β . The variation of β reveals a dynamic crossover from stretched (β < 1) exponential relaxation to compressed ( β > 1) one. It can be seen that the cross-over from stretched to compressed exponential depends on q .
Fig. 15. Wave vector q dependence of the relaxation time τ of the final decay of F s(q , t ) for particles having different local connectivities[49]. Here we show qτ as a function of q to make it simpler to see the 1/q law and to distinguish it from the 1/q 2 law.
Fig. 16. Mean squared displacement for different type of atoms at 1000 K[49]

Set citation alerts for the article
Please enter your email address
© Copyright 2018-2021 | Chinese Laser Press. All Rights Reserved 沪ICP备15018463号-20