• Optoelectronic Technology
  • Vol. 43, Issue 2, 133 (2023)
Fei XIONG1, Boyang QU4, Guangnan ZHOU2, Haoran WANG2, Xuping ZHANG2, Lei LIANG2, Jin WANG3, Shisong ZHAO4, Dao ZHANG4, Feng WANG2, and Yixin ZHANG2
Author Affiliations
  • 1Inner Mongolia Electric Power Survey & Design Institute Co., Ltd, Hohhot 000,CHN
  • 2College of Engineering and Applied Sciences,Nanjing University, Nanjing 1003, CHN
  • 3Beijing Aqua Intelligent Technology Co., Ltd, Beijing 102400, CHN
  • 4Nanjing Fiber Photonics Technology Co., Ltd, Nanjing 211135, CHN
  • show less
    DOI: 10.19453/j.cnki.1005-488x.2023.02.005 Cite this Article
    Fei XIONG, Boyang QU, Guangnan ZHOU, Haoran WANG, Xuping ZHANG, Lei LIANG, Jin WANG, Shisong ZHAO, Dao ZHANG, Feng WANG, Yixin ZHANG. A Broken Wire Detection System of PCCP Pipeline Based on Φ‑OTDR and MZI[J]. Optoelectronic Technology, 2023, 43(2): 133 Copy Citation Text show less
    Acoustic signal of broken wire
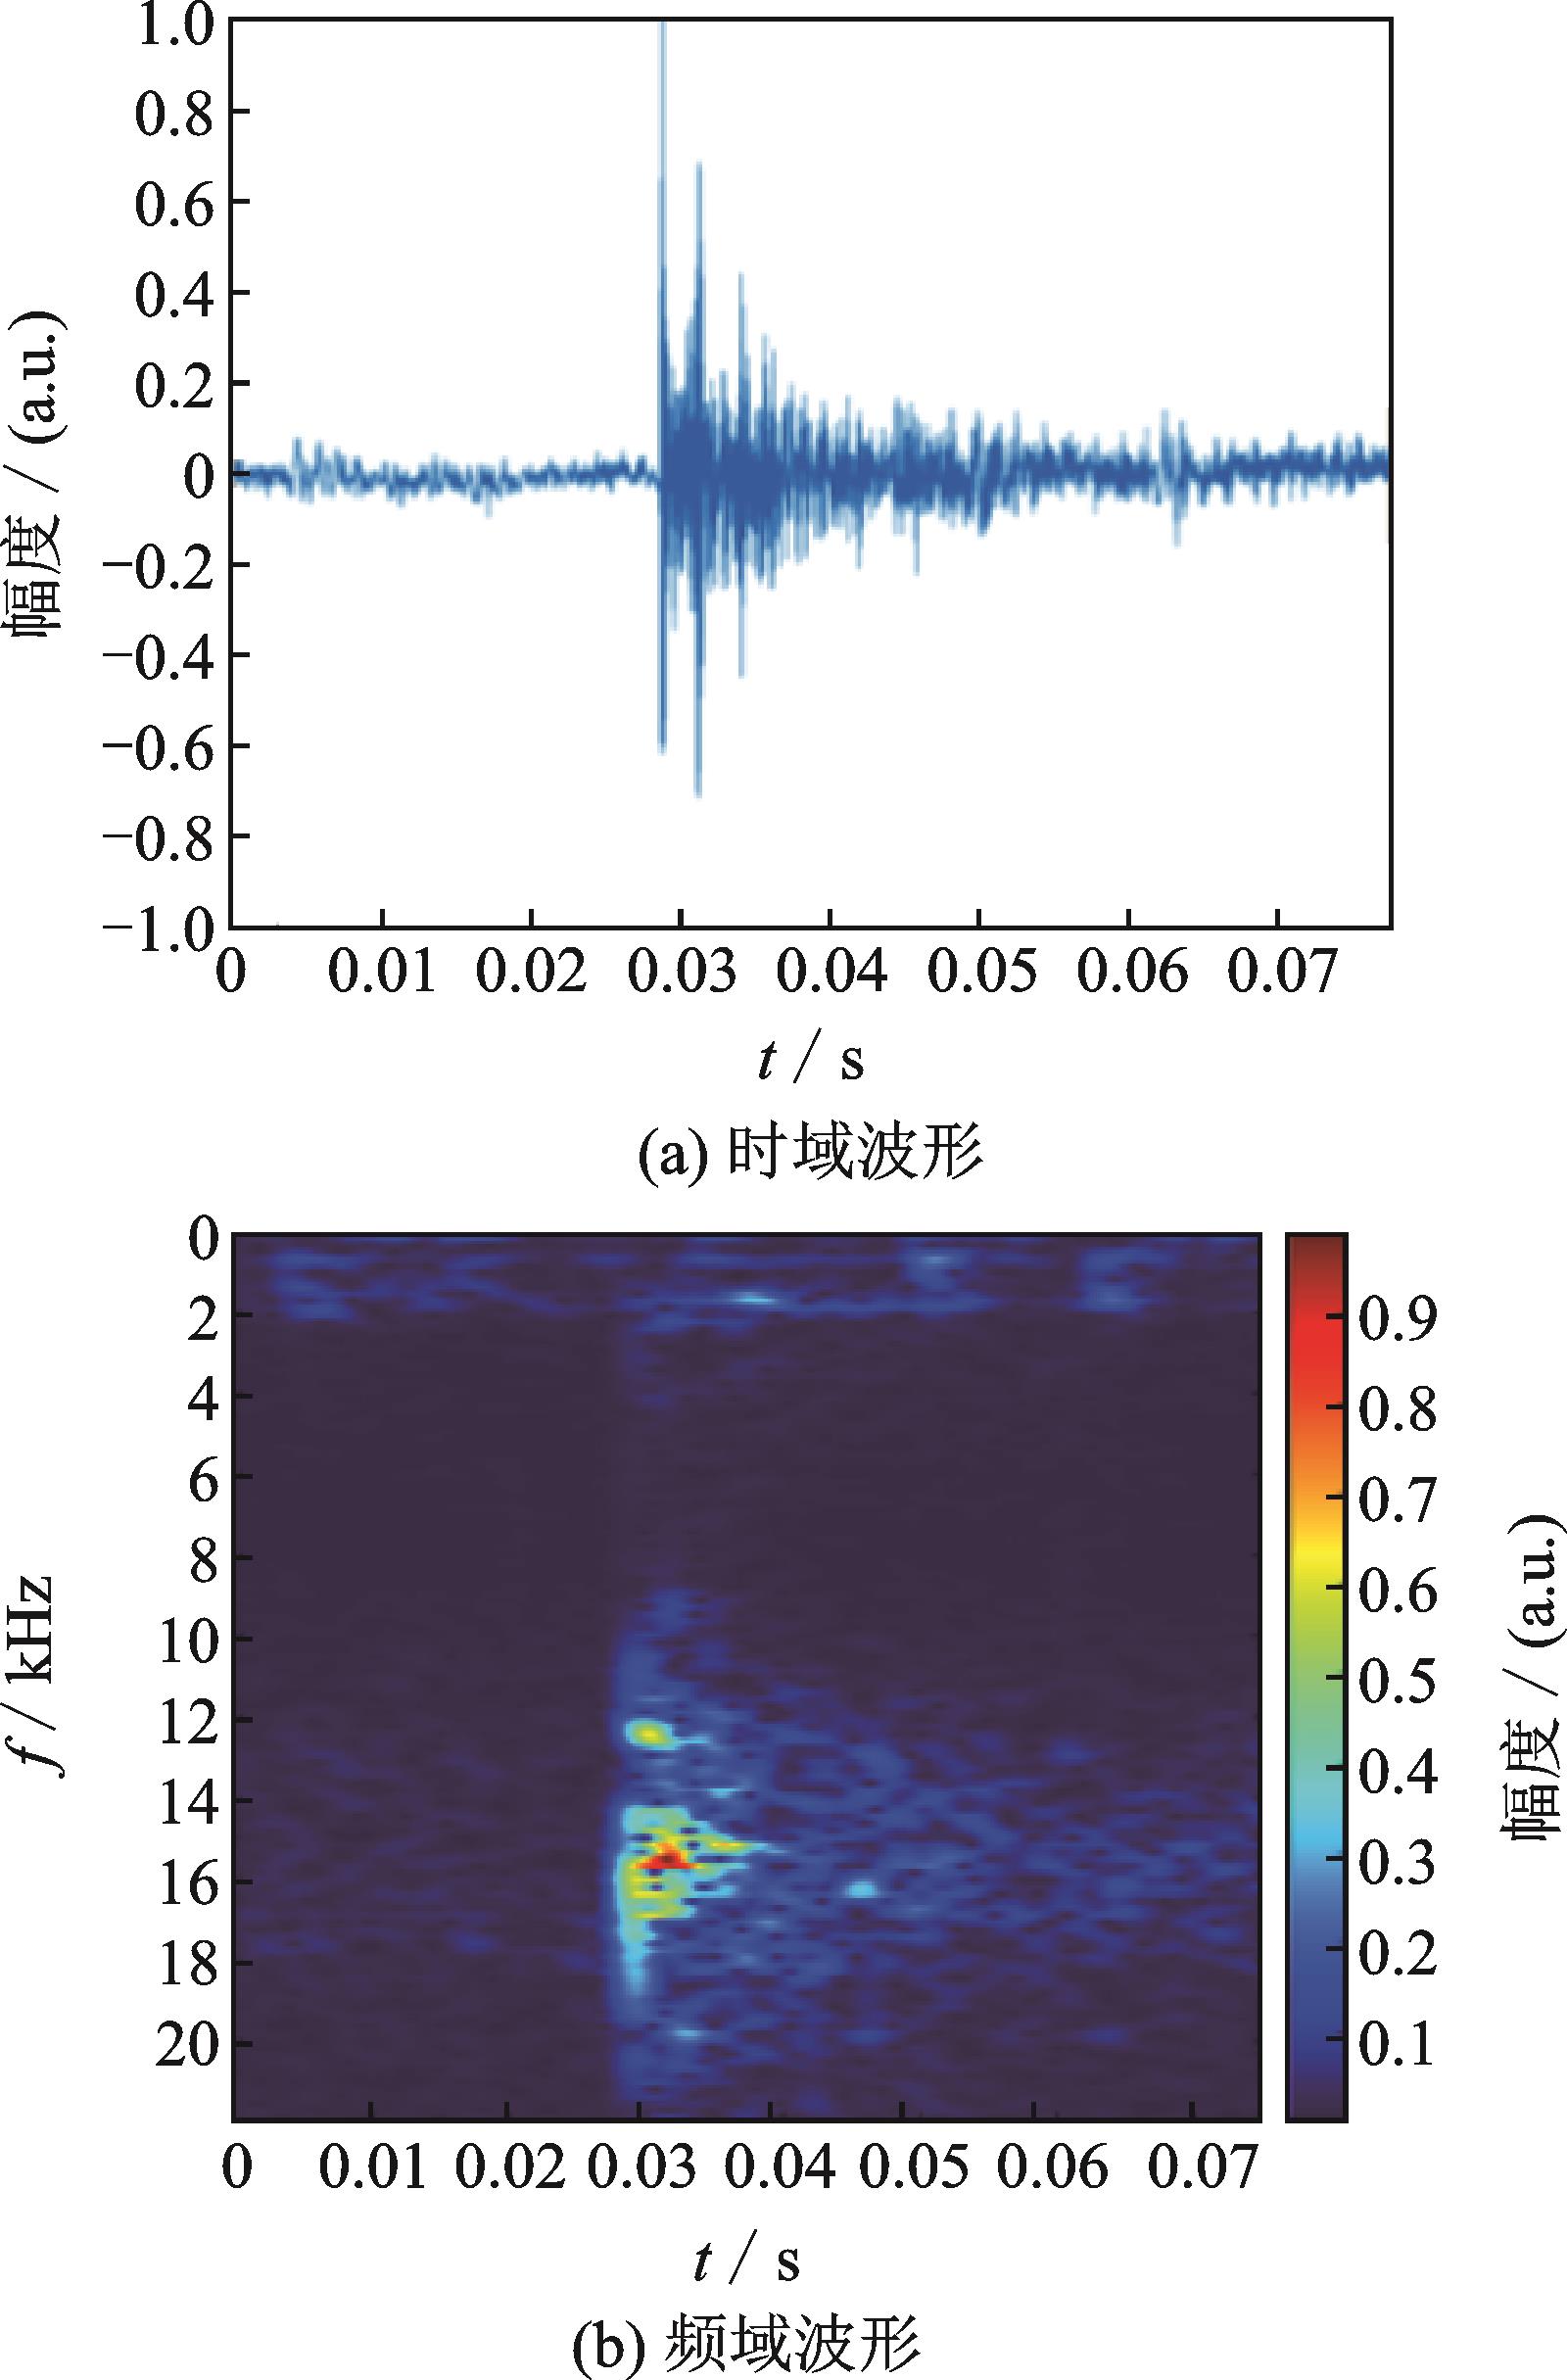
    Fig. 1. Acoustic signal of broken wire
    Structural diagram of broken wire detection system of PCCP pipeline merged with Φ‑OTDR and MZI
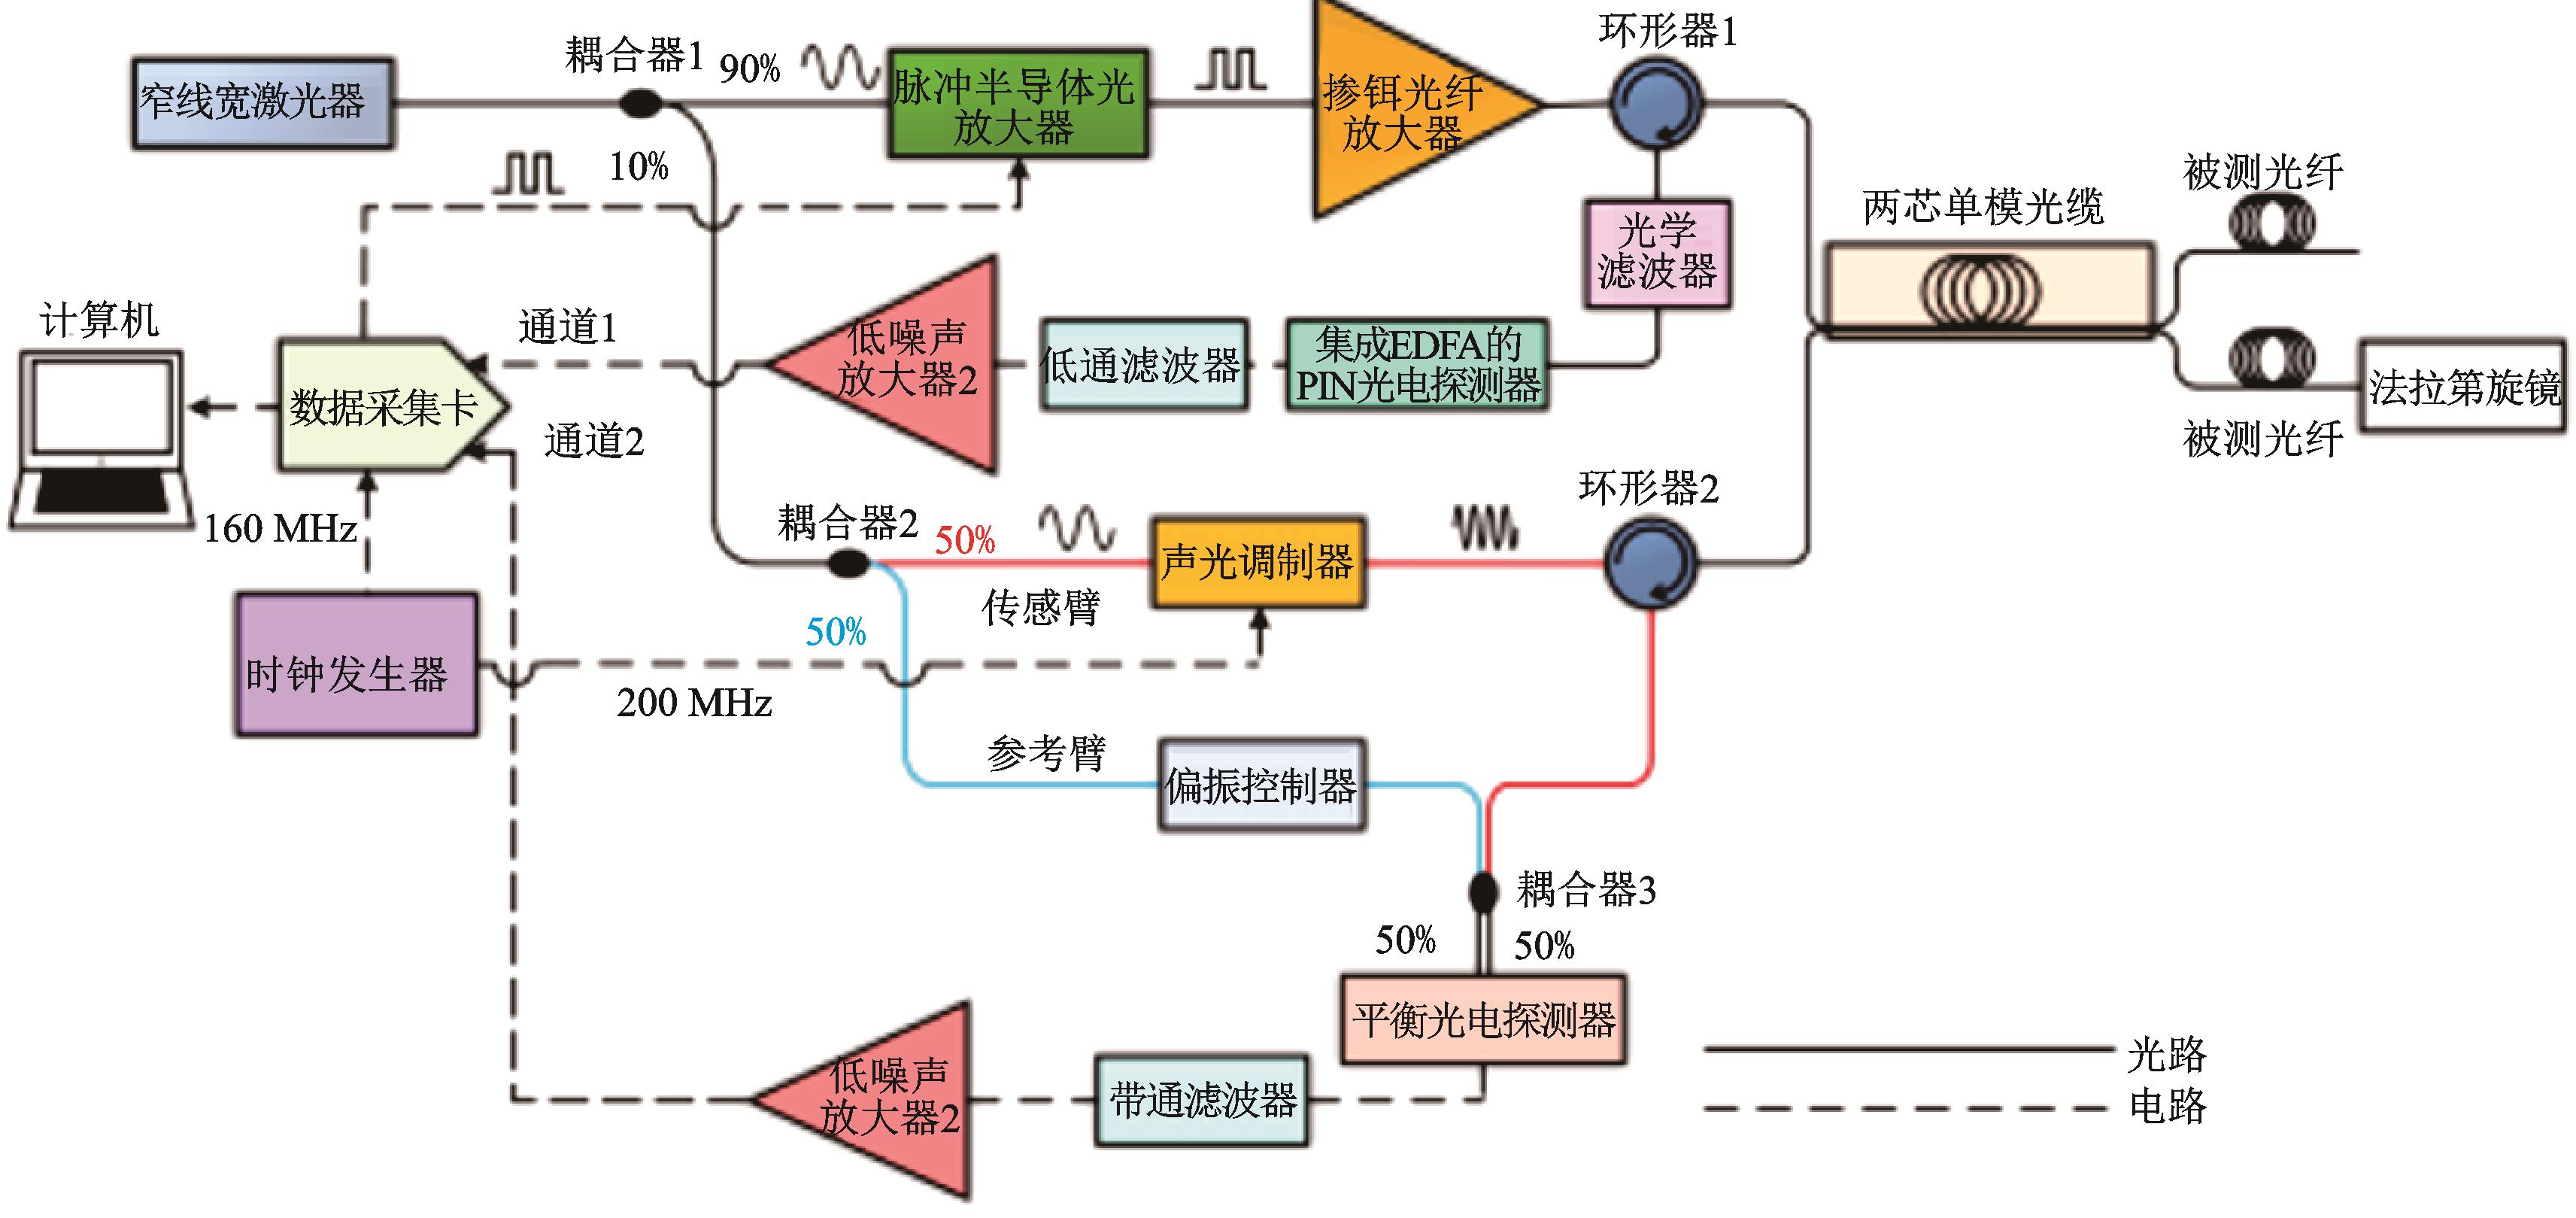
    Fig. 2. Structural diagram of broken wire detection system of PCCP pipeline merged with Φ‑OTDR and MZI
    Schematic of IQ demodulation
    Fig. 3. Schematic of IQ demodulation
    Schematic of the position of PZT
    Fig. 4. Schematic of the position of PZT
    Original waveform diagrams
    Fig. 5. Original waveform diagrams
    Φ-OTDR system with applying 10.1 kHz vibration signal by PZT
    Fig. 6. Φ-OTDR system with applying 10.1 kHz vibration signal by PZT
    MZI system with applying 10 kHz vibration signal by PZT
    Fig. 7. MZI system with applying 10 kHz vibration signal by PZT
    Time domain spectrum of different vibration signals
    Fig. 8. Time domain spectrum of different vibration signals
    Frequency spectrum of different vibration signals
    Fig. 9. Frequency spectrum of different vibration signals
    Broken wire simulation device
    Fig. 10. Broken wire simulation device
    Layout of the optical fiber on the plate
    Fig. 11. Layout of the optical fiber on the plate
    Time domain waterfall plot during the drop of the steel sphere
    Fig. 12. Time domain waterfall plot during the drop of the steel sphere
    Location information of the sphere drop
    Fig. 13. Location information of the sphere drop
    Position of five-time sphere drops
    Fig. 14. Position of five-time sphere drops
    Fei XIONG, Boyang QU, Guangnan ZHOU, Haoran WANG, Xuping ZHANG, Lei LIANG, Jin WANG, Shisong ZHAO, Dao ZHANG, Feng WANG, Yixin ZHANG. A Broken Wire Detection System of PCCP Pipeline Based on Φ‑OTDR and MZI[J]. Optoelectronic Technology, 2023, 43(2): 133
    Download Citation