• Journal of Geo-information Science
  • Vol. 22, Issue 5, 1073 (2020)
Wenqian DONG1、1, Liang DONG2、2、3、3, Lin XIANG1、1、*, Haijun TAO1、1, Chuanhu ZHAO4、4, and Hanbing QU2、2、3、3
Author Affiliations
  • 1.中国计量大学信息工程学院,杭州 310018
  • 1College of Information Engineering, China Jiliang University, Hangzhou 310018, China
  • 2.北京市科学技术研究院,北京 100089
  • 2Beijing Academy of Science and Technology, Beijing 100089, China
  • 3.北京市新技术应用研究所,北京 100094
  • 3Beijing Institute of New Technology Applications, Beijing 100094, China
  • 4.河北工业大学人工智能与数据科学学院,天津 300401
  • 4School of Artificial Intelligence, Hebei University of Technology, Tianjin 300401, China
  • show less
    DOI: 10.12082/dqxxkx.2020.190413 Cite this Article
    Wenqian DONG, Liang DONG, Lin XIANG, Haijun TAO, Chuanhu ZHAO, Hanbing QU. Spatiotemporal Variability of Urban Management Events based on the Bayesian Spatiotemporal Model[J]. Journal of Geo-information Science, 2020, 22(5): 1073 Copy Citation Text show less
    Spatial distribution of urban management event number in the study area
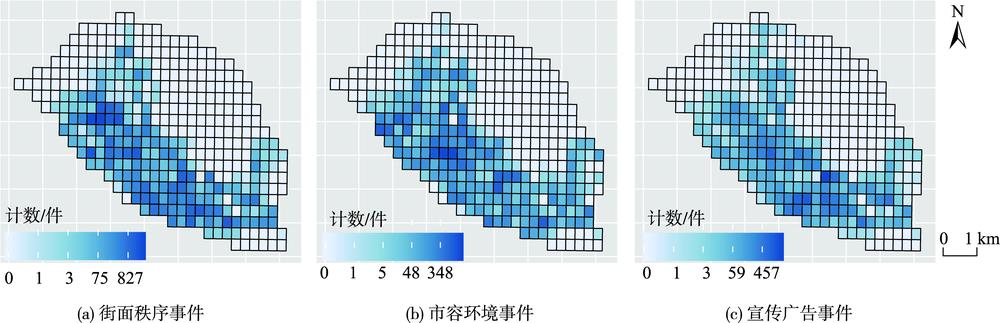
    Fig. 1. Spatial distribution of urban management event number in the study area
    Temporal trend of urban management event number in a week
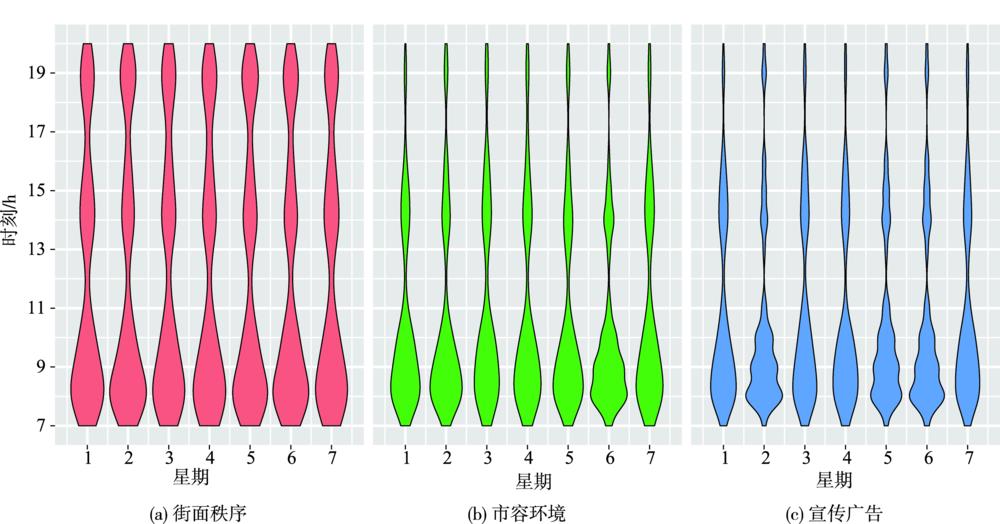
    Fig. 2. Temporal trend of urban management event number in a week
    Spatial distribution of the POI data
    Fig. 3. Spatial distribution of the POI data
    Spatial distribution of urban management events' relative risk
    Fig. 4. Spatial distribution of urban management events' relative risk
    Spatial hot/cold spots of urban management events
    Fig. 5. Spatial hot/cold spots of urban management events
    Temporal relative risk trend of urban management events during a week with the 95% CI
    Fig. 6. Temporal relative risk trend of urban management events during a week with the 95% CI
    Temporal relative risk trend of urban management events during a day with the 95% CI
    Fig. 7. Temporal relative risk trend of urban management events during a day with the 95% CI
    POI类别POI内容均值(标准差)
    餐饮服务类中餐厅、快餐厅、外国餐厅、休闲餐饮场所等0.77(1.20)
    交通设施类公交车站、物流站等0.20(0.37)
    居民住宅类住宅区0.35(0.58)
    购物服务类便利店、超市、烟酒专卖店、购物相关场所等0.71(1.07)
    生活服务类美容美发店、洗浴推拿场所、生活服务场所等0.71(1.00)
    住宿服务类酒店、旅馆、招待所等0.13(0.38)
    医疗保健类医院、社区诊所、卫生院、药店、药房等0.37(0.69)
    公司企业类公司、企业、工厂等0.68(0.78)
    Table 1. Summary of the POI data
    模型模型结构
    M1logλijk=b0+pβpXpijk+logEij
    M2logλijk=b0+pβpXpijk+μi+νi+logEij
    M3logλijk=b0+pβpXpijk+μi+νi+γj+φj+τk+logEij
    Table 2. Candidate models with different components
    协变量(POI密度)VIF协变量(POI密度)VIF
    餐饮服务类4.53生活服务类5.17
    交通设施类1.37住宿服务类2.52
    居民住宅类2.26医疗保健类3.21
    购物服务类3.88公司企业类1.41
    Table 3. Results of multicollinearity evaluation
    事件类别候选模型DIC
    街面秩序M136 873.15
    M226 182.07
    M324 851.99
    市容环境M127 093.02
    M221 791.38
    M319 099.85
    宣传广告M129 935.99
    M223 364.75
    M320 375.71
    Table 4. DIC values for the various candidate models
    协变量街面秩序类市容环境类宣传广告类
    截距项0.586(0.549, 0.624)0.654 (0.614, 0.697)0.611 (0.573, 0.651)
    餐饮服务类1.083*(1.032, 1.136)1.065*(1.017, 1.116)1.086* (1.036, 1.138)
    交通设施类1.105*(1.047, 1.166)1.056* (1.001, 1.113)1.091* (1.035, 1.151)
    居民住宅类1.156*(1.017, 1.315)1.073 (0.949, 1.213)1.118 (0.990, 1.263)
    购物服务类1.055(0.963, 1.157)1.039 (0.950, 1.136)1.052 (0.962, 1.150)
    生活服务类1.084*(1.026, 1.145)1.065* (1.009, 1.125)1.081* (1.024, 1.141)
    住宿服务类1.158*(1.019, 1.315)1.201* (1.070, 1.363)1.205* (1.069, 1.359)
    医疗保健类1.070(0.956, 1.162)1.001 (0.931, 1.093)1.081 (0.997, 1.171)
    公司企业类0.984(0.928, 1.043)0.995 (0.941, 1.052)0.944 (0.921, 1.031)
    Table 5. Posterior mean and confidence intervals of potential covariates
    Wenqian DONG, Liang DONG, Lin XIANG, Haijun TAO, Chuanhu ZHAO, Hanbing QU. Spatiotemporal Variability of Urban Management Events based on the Bayesian Spatiotemporal Model[J]. Journal of Geo-information Science, 2020, 22(5): 1073
    Download Citation