• High Power Laser Science and Engineering
  • Vol. 7, Issue 3, 03000e49 (2019)
Zhiyu He1, Guo Jia1、†, Fan Zhang1, Xiuguang Huang1、2, Zhiheng Fang1, Jiaqing Dong1, Hua Shu1, Junjian Ye1, Zhiyong Xie1, Yuchun Tu1, Qili Zhang3, Erfu Guo1, Wenbing Pei1、2, and Sizu Fu1、2
Author Affiliations
  • 1Shanghai Institute of Laser Plasma, CAEP, Shanghai 201800, China
  • 2IFSA Collaborative Innovation Center, Shanghai Jiao Tong University, Shanghai 200240, China
  • 3Institute of Applied Physics and Computational Mathematics, Beijing 100094, China
  • show less
    DOI: 10.1017/hpl.2019.27 Cite this Article Set citation alerts
    Zhiyu He, Guo Jia, Fan Zhang, Xiuguang Huang, Zhiheng Fang, Jiaqing Dong, Hua Shu, Junjian Ye, Zhiyong Xie, Yuchun Tu, Qili Zhang, Erfu Guo, Wenbing Pei, Sizu Fu. Calibration and verification of streaked optical pyrometer system used for laser-induced shock experiments[J]. High Power Laser Science and Engineering, 2019, 7(3): 03000e49 Copy Citation Text show less
    Spectral radiance and Planck fit of the lower-color-temperature $({\sim}3000~\text{K})$ halogen tungsten lamp (thick orange line and thin red line) and the higher-color-temperature $({\sim}5000~\text{K})$ specially designed lamp (thick blue line and thin purple line).
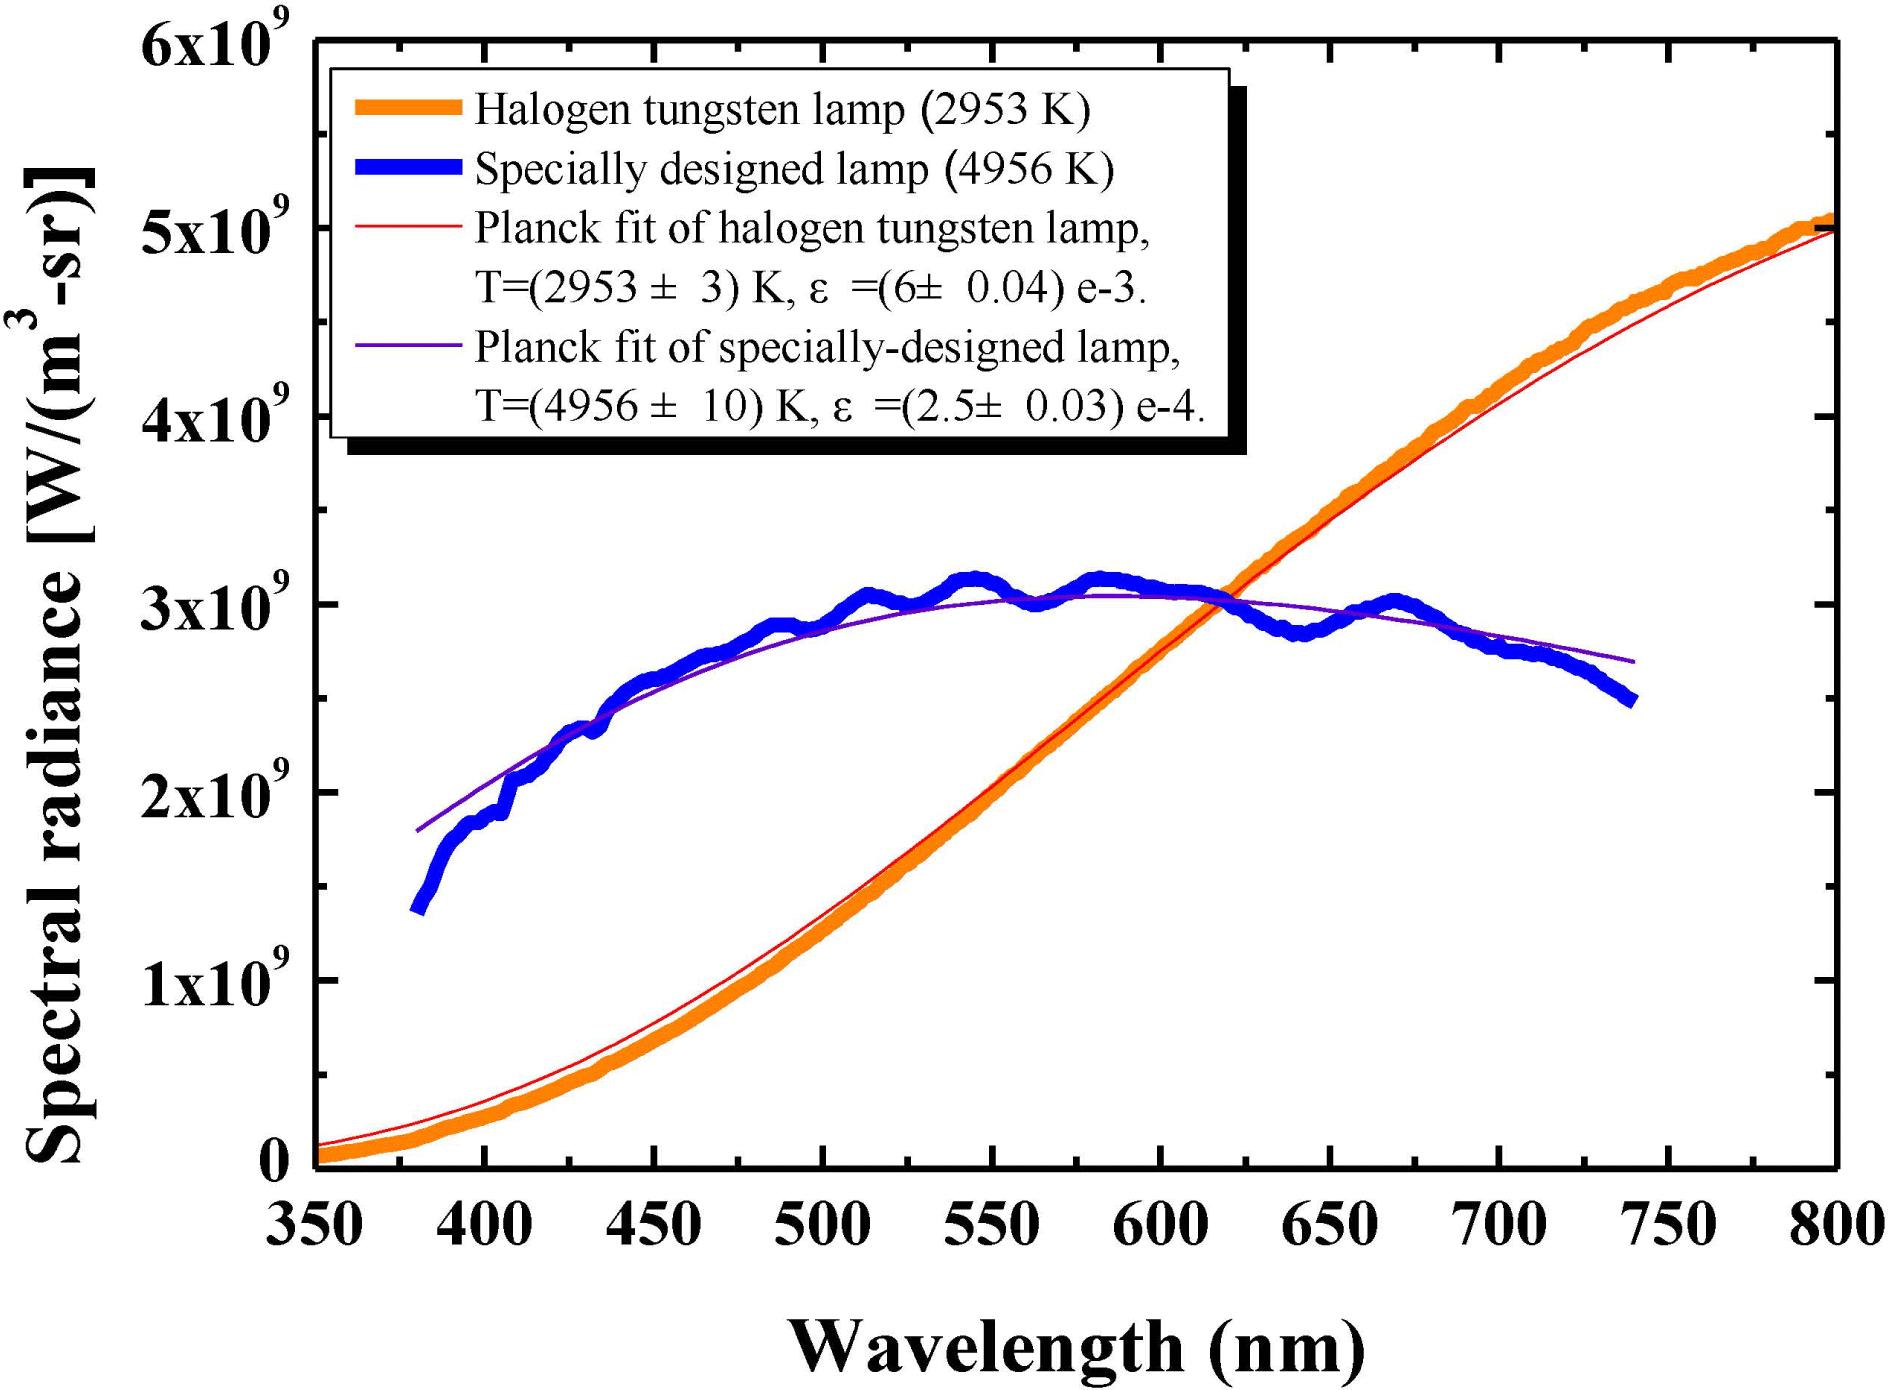
    Fig. 1. Spectral radiance and Planck fit of the lower-color-temperature $({\sim}3000~\text{K})$ halogen tungsten lamp (thick orange line and thin red line) and the higher-color-temperature $({\sim}5000~\text{K})$ specially designed lamp (thick blue line and thin purple line).
    Calibration and verification configuration of the SOP system (top view).
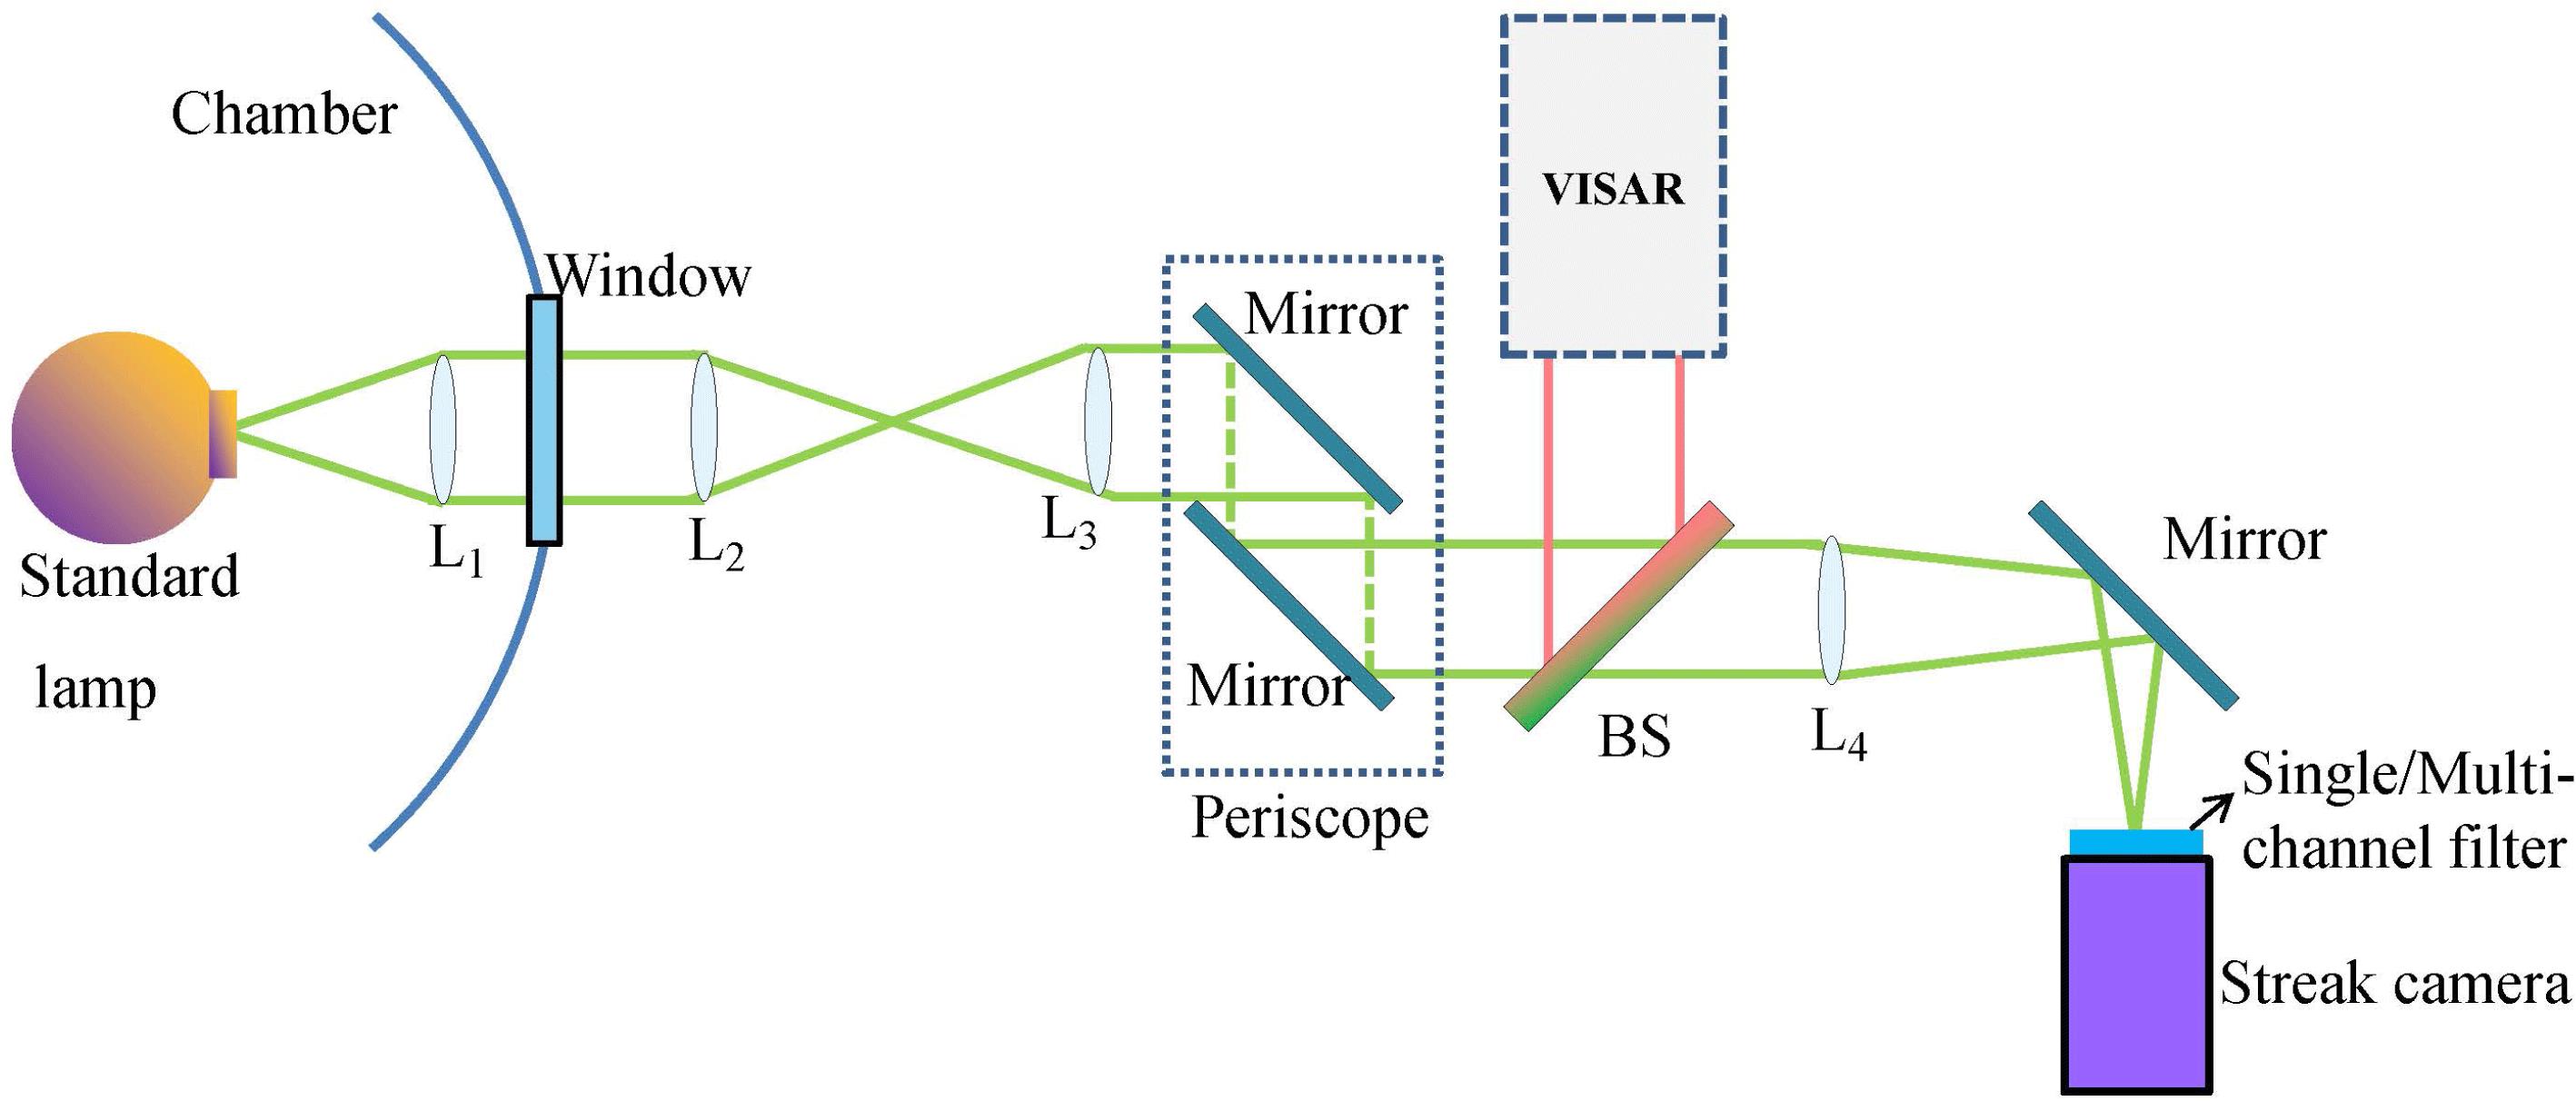
    Fig. 2. Calibration and verification configuration of the SOP system (top view).
    (a) LSF FWHM and (b) spectral response of the SC-10 streak camera.
    Fig. 3. (a) LSF FWHM and (b) spectral response of the SC-10 streak camera.
    Schematic of the four-channel filter.
    Fig. 4. Schematic of the four-channel filter.
    Spectral radiance data and theoretical Planck fit curve for conditions using (a) Lamp A as the standard or (b) Lamp B as the standard. Spatial chromaticity maps representing the measured temperature using (c) Lamp A as the standard or (d) Lamp B as the standard.
    Fig. 5. Spectral radiance data and theoretical Planck fit curve for conditions using (a) Lamp A as the standard or (b) Lamp B as the standard. Spatial chromaticity maps representing the measured temperature using (c) Lamp A as the standard or (d) Lamp B as the standard.
    Relationship between $\unicode[STIX]{x0394}T/T$ and $\unicode[STIX]{x0394}X/X$ and the sensitivity curve of the calibration (No. S003B, (a) and (b)) and shock-wave experiment (No. D0211, (c) and (d)).
    Fig. 6. Relationship between $\unicode[STIX]{x0394}T/T$ and $\unicode[STIX]{x0394}X/X$ and the sensitivity curve of the calibration (No. S003B, (a) and (b)) and shock-wave experiment (No. D0211, (c) and (d)).
    (a) Schematic of the target; (b) VISAR line-image record; (c) SOP image record; (d) a comparison of the reflectivity as a function of shock velocity in quartz and fused silica by Hicks et al.[2, 6]; and (e) a comparison of the measured temperature as a function of shock velocity in quartz by Hicks et al. (solid pink diamonds), the Sesame model (solid cyan line), and this work (solid blue circles for fused silica and solid red circles for quartz).
    Fig. 7. (a) Schematic of the target; (b) VISAR line-image record; (c) SOP image record; (d) a comparison of the reflectivity as a function of shock velocity in quartz and fused silica by Hicks et al.[2, 6]; and (e) a comparison of the measured temperature as a function of shock velocity in quartz by Hicks et al. (solid pink diamonds), the Sesame model (solid cyan line), and this work (solid blue circles for fused silica and solid red circles for quartz).
    No.MCP ChannelStandard: Lamp AStandard: Lamp B
    $T_{B}$ (K)$\unicode[STIX]{x1D702}_{B}$ (%)$T_{A}$ (K)$\unicode[STIX]{x1D702}_{A}$ (%)
    M001850 V Four-channel4893 1.32904 1.7
    M002800 V Four-channel4870 1.82924 0.99
    S001750 VSingle-channel: 442 nm4801 3.22981 0.94
    S002800 VSingle-channel: 442 nm4818 2.92975 0.74
    S003850 VSingle-channel: 442 nm4839 2.42966 0.44
    S0011850 VSingle-channel: 410 nm4711 5.22981 0.94
    S0012850 VSingle-channel: 450 nm4844 2.32967 0.47
    S0013850 VSingle-channel: 490 nm4857 2.02978 0.84
    S0014850 VSingle-channel: 590 nm4749 4.33041 2.9
    S0021800 VSingle-channel: 410 nm4752 4.32990 1.2
    S0022800 VSingle-channel: 450 nm4879 1.62977 0.81
    S0023800 VSingle-channel: 490 nm4894 1.32983 1.0
    S0024800 VSingle-channel: 590 nm4782 3.63057 3.4
    Table 1. Calibration and verification results (measured temperature $T$, deviation between the measured temperature and the standard value $\unicode[STIX]{x1D702}$) of the SOP system using a single-channel (No. S001–S0024) or multi-channel (No. M001–M002) method are listed in addition to the MCP of the streak camera for each experiment.
    No. Sample
    (nm)(nm)(K)(K)
    M001B Lamp BFour-channel$2.2\times 10^{-4}$$6.0\times 10^{-5}$4893226
    M002B Lamp BFour-channel$2.3\times 10^{-4}$$9.8\times 10^{-5}$4870217
    S001B Lamp B$1.99\times 10^{9}$$2.99\times 10^{8}$44220$2.5\times 10^{-4}$$2.7\times 10^{-6}$4799121
    S002B Lamp B$2.04\times 10^{9}$$3.06\times 10^{8}$44220$2.5\times 10^{-4}$$2.7\times 10^{-6}$4817121
    S003B Lamp B$2.10\times 10^{9}$$3.15\times 10^{8}$44220$2.5\times 10^{-4}$$2.7\times 10^{-6}$4838122
    S0011B Lamp B$1.49\times 10^{9}$$2.23\times 10^{8}$41010$2.5\times 10^{-4}$$2.7\times 10^{-6}$4711102
    S0012B Lamp B$2.18\times 10^{9}$$3.27\times 10^{8}$45010$2.5\times 10^{-4}$$2.7\times 10^{-6}$4843113
    S0013B Lamp B$2.48\times 10^{9}$$3.72\times 10^{8}$49015$2.5\times 10^{-4}$$2.7\times 10^{-6}$4854123
    S0014B Lamp B$2.45\times 10^{9}$$3.68\times 10^{8}$59015$2.5\times 10^{-4}$$2.7\times 10^{-6}$4747138
    S0021B Lamp B$1.52\times 10^{9}$$2.28\times 10^{8}$41010$2.5\times 10^{-4}$$2.7\times 10^{-6}$4725103
    S0022B Lamp B$2.26\times 10^{9}$$3.39\times 10^{8}$45010$2.5\times 10^{-4}$$2.7\times 10^{-6}$4869114
    S0023B Lamp B$2.56\times 10^{9}$$3.84\times 10^{8}$49015$2.5\times 10^{-4}$$2.7\times 10^{-6}$4880124
    S0024B Lamp B$2.49\times 10^{9}$$3.73\times 10^{8}$59015$2.5\times 10^{-4}$$2.7\times 10^{-6}$4762139
    M001A Lamp AFour-channel$7.0\times 10^{-3}$$3.0\times 10^{-3}$2904140
    M002A Lamp AFour-channel$7.3\times 10^{-3}$$2.5\times 10^{-3}$292450
    S001A Lamp A$7.68\times 10^{8}$$1.15\times 10^{8}$44220$6.1\times 10^{-3}$$3.9\times 10^{-5}$298184
    S002A Lamp A$7.52\times 10^{8}$$1.13\times 10^{8}$44220$6.1\times 10^{-3}$$3.9\times 10^{-5}$297584
    S003A Lamp A$7.29\times 10^{8}$$1.09\times 10^{8}$44220$6.1\times 10^{-3}$$3.9\times 10^{-5}$296784
    S0011A Lamp A$4.78\times 10^{8}$$7.17\times 10^{7}$41010$6.1\times 10^{-3}$$3.9\times 10^{-5}$298256
    S0012A Lamp A$8.12\times 10^{8}$$1.22\times 10^{8}$45010$6.1\times 10^{-3}$$3.9\times 10^{-5}$296854
    S0013A Lamp A$1.32\times 10^{9}$$1.98\times 10^{8}$49015$6.1\times 10^{-3}$$3.9\times 10^{-5}$297764
    S0014A Lamp A$3.30\times 10^{9}$$4.95\times 10^{8}$59015$6.1\times 10^{-3}$$3.9\times 10^{-5}$304064
    S0021A Lamp A$4.81\times 10^{8}$$7.21\times 10^{7}$41010$6.1\times 10^{-3}$$3.9\times 10^{-5}$298357
    S0022A Lamp A$8.38\times 10^{8}$$1.26\times 10^{8}$45010$6.1\times 10^{-3}$$3.9\times 10^{-5}$297654
    S0023A Lamp A$1.36\times 10^{9}$$2.04\times 10^{8}$49015$6.1\times 10^{-3}$$3.9\times 10^{-5}$298664
    S0024A Lamp A$3.50\times 10^{9}$$5.25\times 10^{8}$59015$6.1\times 10^{-3}$$3.9\times 10^{-5}$306265
    D0211 Quartz$4.61\times 10^{15}$$6.91\times 10^{14}$450100.7070.109464987727
    D0212 Quartz$1.80\times 10^{15}$$2.70\times 10^{14}$590150.7200.111477108787
    D0213Fused silica$4.37\times 10^{15}$$6.55\times 10^{14}$410100.5340.082431346847
    D0214Fused silica$3.65\times 10^{15}$$5.47\times 10^{14}$490150.5340.0826111711836
    Table 2. Variables and their uncertainties in the calibrations and shock-wave experiments. Samples for the calibrations using a single-channel begin with an S; samples for calibrations using a multi-channel begin with an M; and samples for the shock-wave experiments begin with a D. In particular, the $L_{m}$, $\unicode[STIX]{x1D700}$, and $T$ of the shock-wave experiments refer to values at the interface of the sample and base material.
    Zhiyu He, Guo Jia, Fan Zhang, Xiuguang Huang, Zhiheng Fang, Jiaqing Dong, Hua Shu, Junjian Ye, Zhiyong Xie, Yuchun Tu, Qili Zhang, Erfu Guo, Wenbing Pei, Sizu Fu. Calibration and verification of streaked optical pyrometer system used for laser-induced shock experiments[J]. High Power Laser Science and Engineering, 2019, 7(3): 03000e49
    Download Citation