Author Affiliations
1.河南大学 黄河文明与可持续发展研究中心暨黄河文明传承与现代文明建设河南省协同创新中心,开封 4750011Key Research Institute of Yellow River Civilization and Sustainable Development & Collaborative Innovation Center on Yellow River Civilization of Henan Province, Henan University, Kaifeng 475001, China2.河南大学环境与规划学院,开封 4750042College of Environment and Planning, Henan University, Kaifeng 475004, China3.华东师范大学地理信息科学教育部重点实验室,上海 2002413Key Laboratory of Geographical Information Science, Ministry of Education of China, East China Normal University, Shanghai 200241, Chinashow less
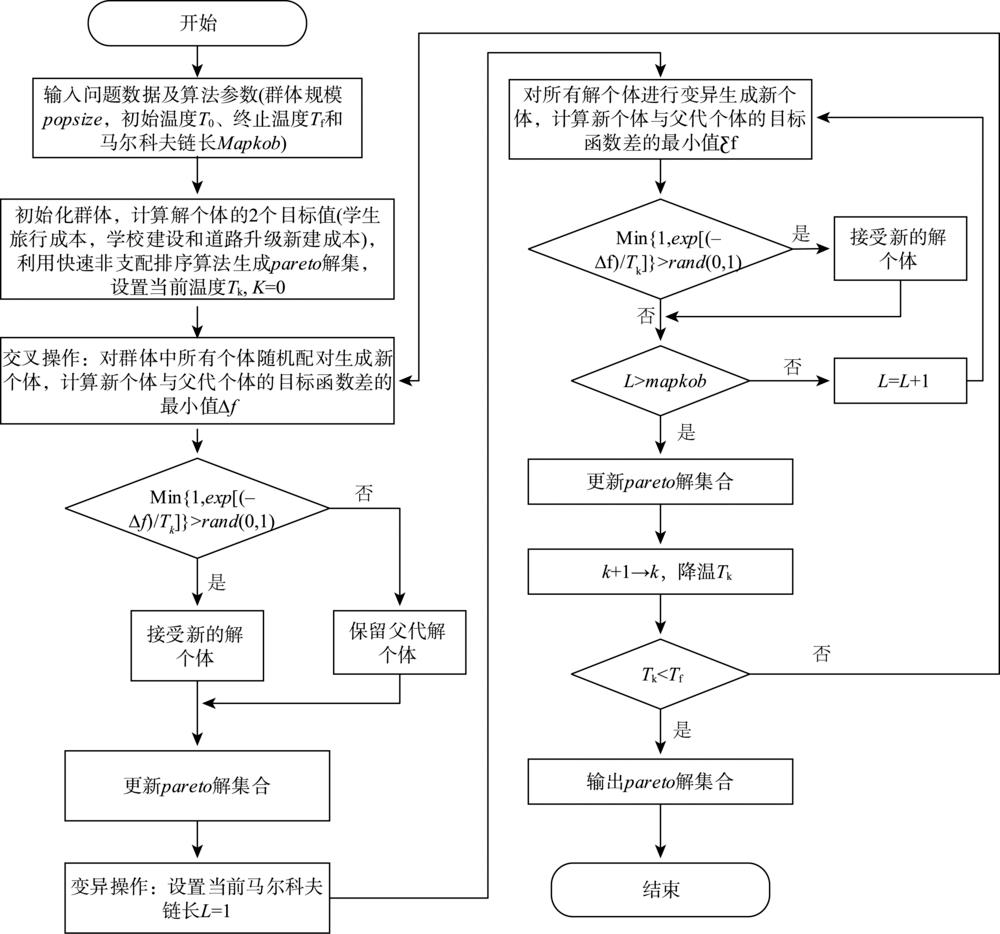
Fig. 1. Flow chart of improved multi-objective simulated annealing algorithm
Fig. 2. The 21-node network
Fig. 3. Flow chart of facility location-network design system calculation process
Fig. 4. Operation interface of rural schools optimized layout system
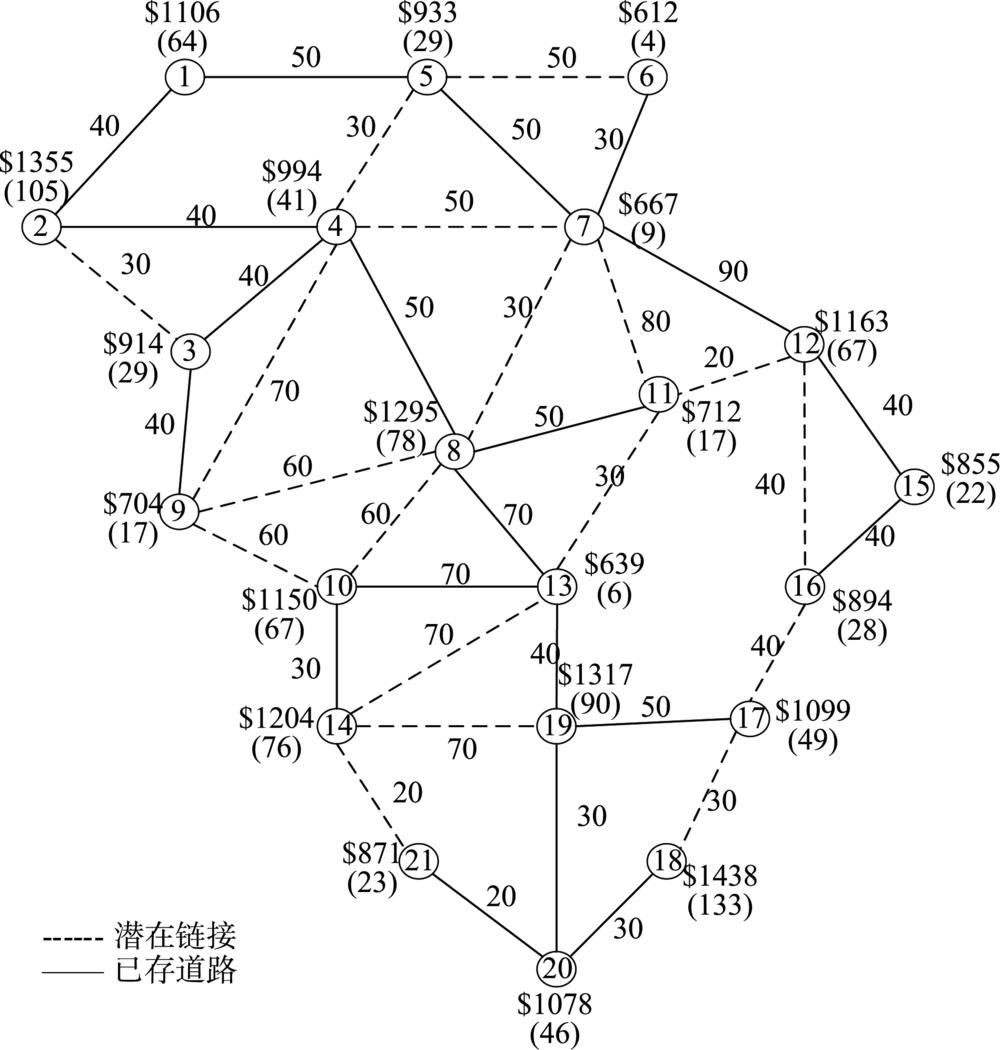
Fig. 5. Road network map containing potential roads
Fig. 6. School locations results for scenario 1
Fig. 7. School locations and road upgrade results for scenario 2
Fig. 8. School locations, road upgrades and construction results for scenario 3
Fig. 9. The spatial distribution of students' time to school at each village for different scenarios
| 算法 | NN | | MGD | | SP | 平均时间/s |
|---|
| 平均值/个 | 总和/个 | 平均值 | 标准方差 | 平均值 | 标准方差 |
|---|
| MOSA | 7 | 216 | | 537.41 | 246.30 | | 924.29 | 639.11 | 84.77 | | NSGA-II | 15 | 456 | | 276.30 | 106.20 | | 726.30 | 315.65 | 68.62 | | IMOSA | 22 | 647 | | 130.60 | 40.12 | | 525.14 | 170.04 | 59.53 |
|
Table 1. Comparisons of performance indicators of three algorithms
| 方案编号 | 新建设施个数 | 设施选址位置 | 旅行成本(第一目标值) | 设施建设成本(第二目标值) |
|---|
| 1 | | 1 | 1 642 335 | 400 000 | | 2 | | 15 | 1 488 424 | 450 000 | | 3 | | 1,22 | 1 495 064 | 800 000 | | 4 | | 1,15 | 1 331 460 | 850 000 | | 5 | | 15,21 | 1 315 524 | 900 000 | | 6 | | 15,17 | 1 303 802 | 1 000 000 | | 7 | | 15,17,21 | 1 130 902 | 1 450 000 | | 8 | | 1,15,21 | 1 158 560 | 1 300 000 | | 9 | | 1,11,22 | 1 379 636 | 1 200 000 | | 10 | | 1,11,15 | 1 216 032 | 1 250 000 | | 11 | | 9,15,17 | 1 121 438 | 1 550 000 | | 12 | | 1,15,17 | 1 146 838 | 1 400 000 |
|
Table 2. Scheme and objective function value of Pareto optimal solution in scenario 1
| 方案编号 | 新建设施个数 | 设施选址位置 | 旅行成本(第一目标值) | 建设成本(第二目标值) |
|---|
| 1 | | 15 | 1 295 687 | 559 000 | | 2 | | 15 | 1 132 810 | 787 155 | | 3 | | 15 | 1 068 135 | 890 765 | | 4 | | 15 | 1 002 049 | 991 840 | | 5 | | 15 | 864 630 | 1 271 470 | | 6 | | 15 | 807 618 | 1 431 305 | | 7 | | 15,17 | 1 000 392 | 1 267 605 | | 8 | | 15,17 | 855 648 | 1 466 570 | | 9 | | 15,17 | 742 158 | 1 687 960 | | 10 | | 15,17 | 713 800 | 1 736 255 | | 11 | | 15,17 | 655 768 | 1 865 215 | | 12 | | 15,17 | 622 996 | 1 981 305 | | 13 | | 15,17 | 610 746 | 2 078 610 | | 14 | | 15,17 | 593 241 | 2 195 025 | | 15 | | 15,17 | 553 786 | 2 313 000 | | 16 | | 1,15,17 | 857 898 | 1 712 325 | | 17 | | 1,15,17 | 750 337 | 1 874 305 | | 18 | | 1,15,17 | 692 305 | 2 003 265 | | 19 | | 1,15,17 | 580 291 | 2 118 835 | | 20 | | 1,15,17 | 548 536 | 2 199 760 | | 21 | | 1,15,17 | 536 285 | 2 297 065 | | 22 | | 1,15,17 | 508 400 | 2 458 200 |
|
Table 3. Scheme and objective function value of Pareto optimal solution in scenario 2
| 方案编号 | 新建设施个数 | 设施选址位置 | 旅行成本(第一目标值) | 建设成本(第二目标值) |
|---|
| 1 | | 15 | 969 011 | 1 049 911 | | 2 | | 15 | 909 984 | 1 176 466 | | 3 | | 15 | 797 970 | 1 292 036 | | 4 | | 15 | 764 372 | 1 420 996 | | 5 | | 15 | 752 155 | 1 479 340 | | 6 | | 15 | 720 408 | 1 560 265 | | 7 | | 15 | 689 716 | 1 781 031 | | 8 | | 15,17 | 861 953 | 1 458 445 | | 9 | | 15,17 | 805 014 | 1 580 320 | | 10 | | 15,17 | 717 808 | 1 753 675 | | 11 | | 15,17 | 650 227 | 1 782 035 | | 12 | | 15,17 | 567 661 | 1 932 035 | | 13 | | 15,17 | 549 277 | 2 012 960 | | 14 | | 15,17 | 521 388 | 2 174 095 | | 15 | | 15,17 | 506 368 | 2 292 070 | | 16 | | 15,17,21 | 897 560 | 1 859 931 | | 17 | | 15,17,21 | 736 467 | 2 098 156 | | 18 | | 15,17,21 | 646 687 | 2 308 041 | | 19 | | 15,17,21 | 522 456 | 2 481 955 | | 20 | | 15,17,21 | 515 037 | 2 549 215 | | 21 | | 15,17,21 | 400 220 | 2 724 416 | | 22 | | 15,17,21 | 372 331 | 2 885 551 |
|
Table 4. Scheme and objective function value of Pareto optimal solution in scenario 3