Abstract
A high-power all-fiber supercontinuum (SC) laser source based on germania-core fiber (GCF) was presented. The lesser absorption loss of GCF than silica fiber beyond 2.0 μm makes GCF more suitable for extending the SC spectrum to the long wavelength side. In this work, the GCF-based SC laser had a maximum power of 30.1 W, together with a 10 dB spectral bandwidth of spanning from 1.95 to 3.0 μm. To the best of our knowledge, this is the highest output power level ever reported for a GCF-based SC laser as well as a 2–3 μm SC laser.1. INTRODUCTION
In recent years, supercontinuum (SC) laser sources based on non-silica fibers have been widely investigated. Utilizing non-silica fibers, the spectra of SCs could be further extended toward the mid-infrared region taking advantage of their lower propagation losses than silica fibers in longer wavelengths. Like fibers made of fluoride [1,2], telluride, and chalcogenide [3,4], germania fiber is another candidate for mid-infrared SC generation. Germania has better mid-infrared transparency than silica due to a lower phonon energy (typically [5]) and has more solid physical characteristics than soft glass. Therefore, making fibers with high concentration cores [6–10] or pure cores [11,12] could improve long wavelength transmittance of silica fibers, and there have been some reports in recent years. Besides, because the nonlinear coefficient of germania is times higher than that of silica [13], fibers made of germania are also able to obtain much broader SC lasers [14,15]. As some SC applications such as laser printing, surgery, spectroscopy, and infrared illumination have requirements for average power, there are strong needs for power scaling of various SC lasers with different spectral ranges as well as for germania-fiber-based SC lasers.
To date, in 2012 Kamynin et al. reported the first nanosecond 1.6–2.7 μm SC generation in a germania fiber (64 mol. % core) pumped by a -switched erbium-doped fiber laser at 1.59 μm [8] (see Table 1). Soon after that, Zhang et al. achieved an SC source in the 1.9–3 μm wavelength region by pumping a piece of 75 mol. % germania-doped fiber with a femtosecond 1.95 μm thulium-doped fiber master oscillator power amplifier (MOPA) system [12]. Maximal output power of the MOPA system (150 mW) limited the output power of the 1.9–3 μm SC source. In 2016, we demonstrated an ultra-broadband 0.6–3.2 μm SC source with maximum average power of 350 mW, where a short piece of germania core fiber (GCF) was pumped by a nanosecond Er-doped MOPA system [14]. Later on, the average power of ultra-broadband SC was elevated to a watt level. Jain et al. reported SC sources with a highest output power of 1.44 W for a broadest spectrum from 700 to 3200 nm, where 75 mol. % germania-doped fiber was pumped with 1550 nm laser pulses with duration of [16]. Recently, we reported 1.9–3.6 μm SC source with a maximum average power of 6.12 W in GCF [15]. In such an experiment, a 1.9–2.6 μm SC source with a pulse width of 1 ns and a repetition rate of 2 MHz was used to pump a piece of GCF. Theoretically, with a larger core diameter, there is a lot of room to further scale the average power of a germania-fiber-based SC laser.
| Ref. | GeO2Concentration (%) | Core Diameter (μm) | Fiber Length (m) | Spectrum (μm) | Output Power (W) |
| [8] | 64 | 5.5 | 7 | 1.6–2.8 | <1 |
| [12] | 75 | | 3.4 | 1.9–3.0 | 0.15 |
| [14] | 100 | 3 | 0.8 | 0.6–3.2 | 0.35 |
| [16] | 74 | 3.5 | 0.9 | 0.7–3.2 | 1.44 |
| [15] | 100 | 3.5 | 0.12 | 1.9–3.6 | 6.12 |
| This work | 100 | 8 | 1 | 1.95–3.0 | 30.1 |
Table 1. Summary of Representative Germania-Fiber-Based SC Works
In this work, a high-power GCF-based 2–3 μm SC laser is presented. The GCF had a pure core with a diameter of 8 μm, which was pumped by a two-stage thulium-doped fiber amplifier seeded with a chirped picosecond pulses at 1960 nm. The maximum output power was 30.1 W, which set a new record for germania-fiber-based SC lasers showing great improvement from previous literature. Interestingly, the average power beyond 2600 nm was a little higher than 10 W, which brought a promising mid-infrared laser scalpel.
2. EXPERIMENTAL SETUP AND RESULTS
The experimental setup of the high-power 2–3 μm SC laser is depicted in Fig. 1. The pump source was an MOPA system at 2 μm. An all-fiber ultrafast mode-locked thulium-doped fiber laser (TDFL) based on nonlinear polarization rotation was adopted as the seed oscillator. The oscillator had a length of ring cavity. A segment of single-mode single-cladding thulium-doped fiber (TDF) was used to provide lasing gain at 2 μm. A home-made continuous-wave fiber laser at 1570 nm was used to pump the gain fiber via a 1550/2000 nm wavelength division multiplexer. An optical polarization maintaining isolator was used to ensure the unidirectional laser propagation, and, together with the Kerr nonlinearity of silica fiber, it could provide a fast saturable absorber for mode-locking. Output pulses are extracted from a optical coupler. Before being amplified following the two-stage thulium-doped fiber amplifier (TDFA), a 300 m length of dispersion compensated fiber (DCF) was utilized to stretch the seed pulse width to hundreds of picoseconds. The DCF had a group-velocity dispersion (GVD) of at 1.96 μm.
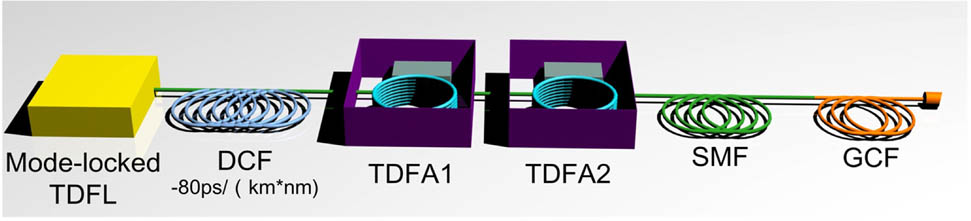
Figure 1.Experimental setup. DCF, dispersion compensated fiber; TDFL, thulium-doped fiber laser; TDFA, thulium-doped fiber amplifier; SMF, single-mode fiber; GCF, germania core fiber.
In the experiments, the seed oscillator could provide ultrafast pulses at 1960 nm with a fundamental repetition rate of 115.4 MHz. The mode-locking operation was stable and had a signal-to-noise suppression ratio of ; it could be self-started with an average power of 11 mW. Figure 2 shows the measured spectral and temporal characteristics of the seed pulses. As can be seen, the direct mode-locked output pulses had a 3 dB spectral width of 6.1 nm. From the autocorrelation trace in Fig. 2(b), a pulse width of 1.09 ps was measured if a pulse profile was assumed. Therefore, a time-bandwidth product of 0.52 was calculated, indicating a slight negative chirp. With the values of pulse width and repetition rate, a pulse duty ratio of was obtained. However, such a low pulse duty ratio would allow nonlinear effects to occur at comparatively low average power, which would seriously limit the output power of the TDFAs.
Sign up for Photonics Research TOC. Get the latest issue of Photonics Research delivered right to you!Sign up now

Figure 2.Characteristics of seed pulses. (a) Measured spectra of mode-locked output and after DCF. (b) Autocorrelation trace. (c) Temporal profile after DCF.
Thus, with the introduction of the DCF, the duty cycle of seed pulses was expected to be scaled up by stretching the pulse width to ensure high efficiencies for the following TDFAs. From Fig. 2(a), it is clear that there was a slight spectral broadening of seed pulses due to the nonlinearity of self-phase modulation in the DCF, resulting in a 3 dB spectral bandwidth of 16.1 nm. Figure 2(c) shows that, after the DCF, the pulse width was stretched to (positive chirp). Therefore, the duty ratio of the seed pulse was greatly scaled.
In the TDFA chain, the gain fiber of each TDFA was a section of 5 m long single-mode double-cladding TDF with a core/cladding diameter of 10/130 μm and a core/cladding NA of 0.15/0.46. The gain fiber had a cladding absorption coefficient of at 793 nm. The pump powers for TDFA1 and TDFA2 were 24 and 135 W, respectively. After TDFA1, the average power was increased to 6.2 W, corresponding to a power conversion efficiency of 27.9%. Then, after TDFA2, the output power was scaled up to 65.9 W with a slope efficiency of . Because both the gain fiber and other passive fibers in the two TDFAs had negative dispersion at 2 μm, the positive chirped seed pulses would get shorter during power amplification and acquire high peak power.
The following silica single-mode fiber (SMF) had a length of 12 m, a core/cladding diameter of 7/125 μm, and a core NA of 0.20. The GCF had a pure germania core with a diameter of 8 μm surrounded by a 125 μm silica cladding, resulting in a core NA of 0.65. The GCF was spliced with the SMF by using a fusion splicer with repeated arc discharges to compensate the mode-field mismatch induced loss, and about of power transmission at 2 μm was achieved. The length of GCF used in the experiment was 1 m. The SMF was exploited for preliminary spectral broadening, while the GCF served as the main nonlinear medium. The comparative high NA values of both SMF and GCF could increase the confinement of light in the cores. Figure 3 shows the calculated GVD curve and the measured loss profile of GCF. The loss of silica [17] is also plotted for comparison. The GVD curve was calculated by the finite element method. As can be seen, the used GCF had a zero dispersion wavelength (ZDW) of 1505 nm, indicating spectral broadening at 2–3 μm located in the anomalous dispersion regime. The loss profile of GCF was measured using a cut-back technique. As shown, GCF had a propagation loss between 2 and 2.8 μm, which made it much more suitable for obtaining SC with longer wavelengths than silica fibers. Inset of Fig. 3 shows the step-index cross profile of GCF captured with an optical microscope.
Figure 3.Dispersion and loss profiles of GCF and silica. Inset shows cross profile of GCF. ZDW, zero dispersion wavelength.
In order to understand the related nonlinear process, Fig. 4 plots the measured spectra of laser pulses under maximum output power at different positions of the whole SC laser. As can be seen, there was no spectral broadening on the output spectrum after TDFA1 (with average power of 6.2 W). When the output average power was scaled up to 65.9 W in TDFA2, there was slight broadening toward the long wavelength side. However, most of the laser energy was still located at the signal wavelength. Then, in the following SMF, it was believed that the amplified pulses were broken into abundant femtosecond soliton pulses by modulation instability (MI), and some soliton pulses with high peak powers were shifted toward the longer wavelength region via Raman-assisted soliton self-frequency shift (SSFS) mechanism. In such process, the spectrum extends to the long wavelength region drastically, but the long wavelength cutoff was halted at 2.5 μm due to high attenuation of silica fibers. Fortunately, the GCF supported SC generation and light propagation have much longer wavelengths up to 3 μm. As can be seen from Fig. 4, the 10 dB bandwidths of three spectra after TDFA2, SMF and GCF were 140 nm (1.94–2.08 μm), 520 nm (1.93–2.45 μm), and 1050 nm (1.95–3.0 μm), respectively.
Figure 4.Spectral comparison at different positions.
Next, the spectral evolution of GCF-based SC laser as a function of the output power was examined. The results with corresponding output powers of 1.9, 6.0, 14.4, 21.7, 26.8, 29.3, and 30.1 W are plotted in Fig. 5. Obviously, as a result of increasing output power, the long wavelength cutoff was gradually extended. When the output power was 6.0 W, the SC was broadened to 2800 nm but with a low spectral flatness. By increasing of the output power, SC spectrum became broader and broader, while the spectral flatness was also enhanced. When the output power was increased to the maximum of 30.1 W, the spectrum covered the entire 2–3 μm wavelength region with the best flatness. Spectral dips around 2.7 μm matched the water molecule’s absorption due to the long propagation distance in the monochromator.
Figure 5.Spectral evolutions of SC laser measured after GCF.
Figure 6 plots the power evolution measured after TDFA2, SMF, and GCF as well as the filtered SC power of wavelengths . As can be seen, the output power measured after TDFA2 increased almost linearly with respect to the injected pump power at 793 nm, corresponding to a slope efficiency of . This result indicated no obvious spectral broadening induced loss, which matched well to the green spectrum in Fig. 4. For the output power after SMF, the drop of slope efficiency when pump power was showed power loss, as the spectrum was already extended into the wavelength region in such a silica SMF. After SMF, the obtained 1.93–2.45 μm SC had a maximum output power of 41.6 W. The output power after GCF had a much lower slope efficiency compared with that after SMF, which resulted from not only the spectral broadening induced loss but also the propagation loss in GCF. Under the maximum pump strength, the obtained 2–3 μm SC had an output power of 30.1 W, with 34.2% (10.2 W) of the full SC power located beyond wavelengths of 2600 nm.
Figure 6.Power evolution of SC laser at different positions with respect to pump power of TDFA2.
3. CONCLUSION
In conclusion, a high-power GCF-based SC source is reported. It had a 10 dB spectral bandwidth of 1050 nm (1.95–3.0 μm). A maximum SC power over 30 W was obtained, with a power ratio of 34.2% located at wavelength . To the best of our knowledge, this is the highest recorded power ever reported for both 2–3 μm SC sources and GCF based SC sources. This work provides an ideal high-power pump source for ZBLAN or fiber-based mid-infrared SC sources with wavelengths up to 4–5 μm range.
References
[1] K. Yin, B. Zhang, J. Yao, L. Yang, S. Chen, J. Hou. Highly stable, monolithic, single-mode mid-infrared supercontinuum source based on low-loss fusion spliced silica and fluoride fibers. Opt. Lett., 41, 946-949(2016).
[2] W. Yang, B. Zhang, G. Xue, K. Yin, J. Hou. Thirteen watt all-fiber mid-infrared supercontinuum generation in a single mode ZBLAN fiber pumped by a 2 μm MOPA system. Opt. Lett., 39, 1849-1852(2014).
[3] Y. Yu, B. Zhang, X. Gai, C. Zhai, S. Qi, W. Guo, Z. Yang, R. Wang, D.-Y. Choi, S. Madden, B. Luther-Davies. 1.8–10 μm mid-infrared supercontinuum generated in a step-index chalcogenide fiber using low peak pump power. Opt. Lett., 40, 1081-1084(2015).
[4] H. Ou, S. Dai, P. Zhang, Z. Liu, X. Wang, F. Chen, H. Xu, B. Luo, Y. Huang, R. Wang. Ultrabroad supercontinuum generated from a highly nonlinear Ge-Sb–Se fiber. Opt. Lett., 41, 3201-3204(2016).
[5] X. Zou, T. Izumitani. Spectroscopic properties and mechanisms of excited state absorption and energy transfer upconversion for Er3+-doped glasses. J. Non-Cryst. Solids, 162, 68-80(1993).
[6] K. Yin, B. Zhang, W. Yang, H. Chen, J. Hou. Over an octave cascaded Raman scattering in short highly germanium-doped silica fiber. Opt. Express, 21, 15987-15997(2013).
[7] E. A. Anashkina, A. V. Andrianov, M. Y. Koptev, S. V. Muravyev, A. V. Kim. Towards mid-infrared supercontinuum generation with germano-silicate fibers. IEEE J. Sel. Top. Quantum Electron, 20, 643-650(2014).
[8] V. A. Kamynin, A. E. Bednyakova, M. P. Fedoruk, I. A. Volkov, K. N. Nishchev, A. S. Kurkov. Supercontinuum generation beyond 2 μm in GeO2 fiber: comparison of nano- and femtosecond pumping. Laser Phys. Lett., 12, 065101(2015).
[9] E. Anashkina, A. Andrianov, M. Y. Koptev, V. Mashinsky, S. Muravyev, A. Kim. Generating tunable optical pulses over the ultrabroad range of 1.6–2.5 μm in GeO2-doped silica fibers with an Er:fiber laser source. Opt. Express, 20, 27102-27107(2012).
[10] X. Dong, L. Wang, X. Li, P. P. Shum, H. Su, Q. Wang. Raman lasers with germania-core and silica-cladding fibers. Nonlinear Optics, NM3A.2(2015).
[11] V. V. Dvoyrin, I. T. Sorokina. All-fiber optical supercontinuum sources in 1.7–3.2 μm range. Proc. SPIE, 8961, 89611C(2014).
[12] M. Zhang, E. Kelleher, T. Runcorn, V. Mashinsky, O. Medvedkov, E. Dianov, D. Popa, S. Milana, T. Hasan, Z. Sun. Mid-infrared Raman-soliton continuum pumped by a nanotube-mode-locked sub-picosecond Tm-doped MOPFA. Opt. Express, 21, 23261-23271(2013).
[13] T. Kato, Y. Suetsugu, M. Nishimura. Estimation of nonlinear refractive index in various silica-based glasses for optical fibers. Opt. Lett., 20, 2279-2281(1995).
[14] L. Yang, B. Zhang, K. Yin, J. Yao, G. Liu, J. Hou. 0.6–3.2 μm supercontinuum generation in a step-index germania-core fiber using a 4.4 kW peak-power pump laser. Opt. Express, 24, 12600-12606(2016).
[15] K. Yin, B. Zhang, J. Yao, L. Yang, G. Liu, J. Hou. 1.9–3.6 μm supercontinuum generation in a very short highly nonlinear germania fiber with a high mid-infrared power ratio. Opt. Lett., 41, 5067-5070(2016).
[16] D. Jain, R. Sidharthan, P. M. Moselund, S. Yoo, D. Ho, O. Bang. Record power, ultra-broadband supercontinuum source based on highly GeO2 doped silica fiber. Opt. Express, 24, 26667-26677(2016).
[17] J. Lægsgaard, H. Tu. How long wavelengths can one extract from silica-core fibers?. Opt. Lett., 38, 4518-4521(2013).


