
Haiyong Gan, Yingwei He, Xiangliang Liu, Nan Xu, Houping Wu, Guojin Feng, Wende Liu, Yandong Lin, "Absolute cryogenic radiometer for high accuracy optical radiant power measurement in a wide spectral range," Chin. Opt. Lett. 17, 091201 (2019)
- Chinese Optics Letters
- Vol. 17, Issue 9, 091201 (2019)
Abstract
Absolute electrical substitution radiometers (ESRs) working at cryogenic temperatures were first developed at the National Physical Laboratory (NPL) in the UK with superior performance to those working at ambient temperature[
Works on high accuracy measurement of optical radiant power based on absolute cryogenic radiometers (ACRs) have been conducted worldwide[
ACRs have played a critical role in metrology and drawn increasing amounts of interest from important applications fields such as earth observing systems (EOS). For instance, scientists from the National Institute of Standards and Technology (NIST) in the U.S. successfully applied the ACRs for the low background infrared (LBIR) measurement facility and effectively provided traceability to the calibration of remote sensing instruments for missile defense and climate research[
Sign up for Chinese Optics Letters TOC. Get the latest issue of Chinese Optics Letters delivered right to you!Sign up now
Chinese scientists have been actively working on ACRs for more than twenty years and made important progress on ACR component renovation, spectral range extension, quality calibration service, and system development[
Herein, we report our recent achievement of building a home-made ACR for a wide spectral range, high accuracy optical radiant power measurement with a standard uncertainty of 0.041% at the ∼100 μW level in the 250 nm–16 μm range and 0.015% at the ∼1 mW level in the 500 nm–16 μm range.
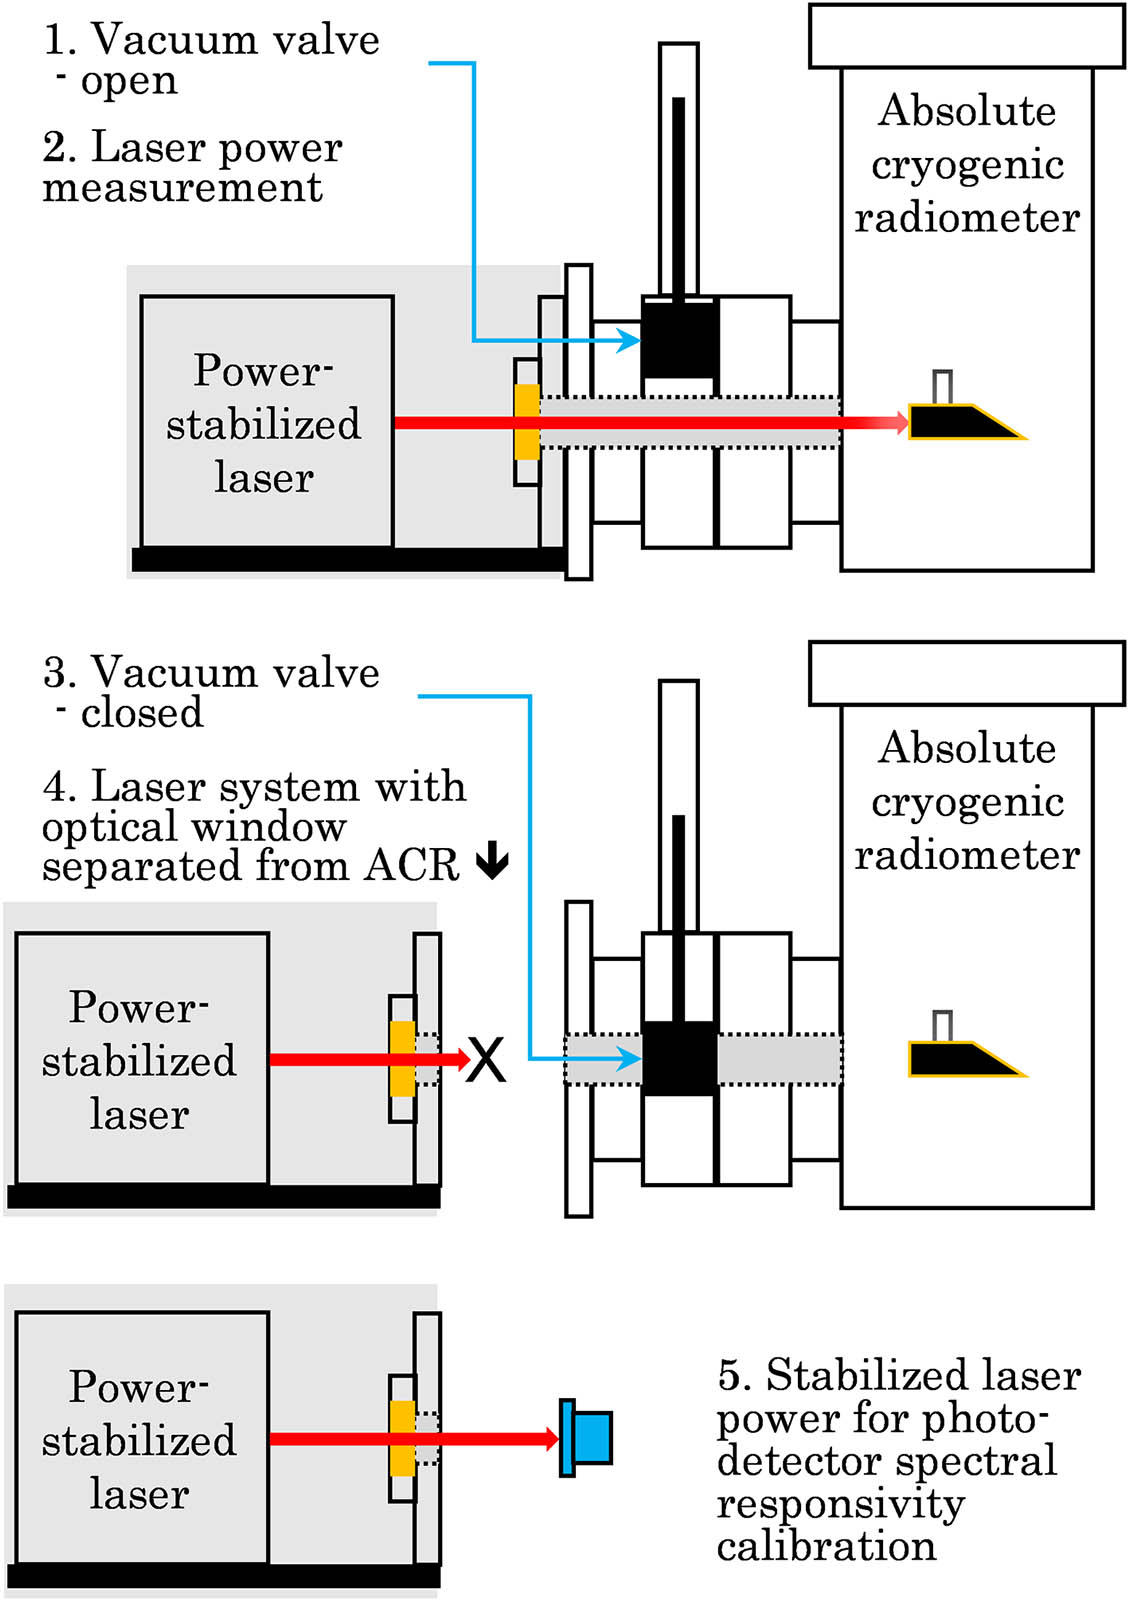
The ACR was designed as illustrated in Fig.
![]()
Figure 1.Optical radiant power measurement and photodetector spectral responsivity calibration scheme.
![]()
Figure 2.ACR facility at the National Institute of Metrology, China.
The cavity receiver of the ACR has a classical tube shape (Fig.
![]()
Figure 3.Picture of the ACR cavity receiver.
![]()
Figure 4.Spectral diffuse reflectance measurement results of the specular black material on a flat surface. Inset: the cavity receiver with the inner surface coated with the specular black material.
A highly sensitive low temperature thermistor was placed on the cavity wall near the open end to measure the temperature change induced by either electrical or optical heating. Two 10 K ohm heaters were mounted on the slanted bottom surface separated by a distance of 10 mm and lined up with the thermistor. About 1 mW of the same electrical power was applied on each heater in turn to measure the temperature change difference and, hence, the cavity thermal non-equivalence to be no higher than 0.005%.
The cavity receiver was then installed on a base, and then a sample stage was connected to the second stage cool head of a Gifford–McMahon-type mechanical cryocooler (Pride Cryogenics, China) with a 1.5 W cooling power at 4.2 K. The temperature of the sample stage is actively controlled at 5.2 K. A stainless-steel rod was adopted as the thermal link between the cavity receiver and its base. The thermal impulse response time constant of the cavity receiver is about a few tens of seconds, and the optimal work time for complete thermal equilibrium is approximately several minutes.
Normally, the heat sensitivity of the cavity receiver can be higher when a weaker thermal link is used, although the thermal impulse response time constant becomes larger and consequently requires a longer period of system thermal stability. In our work, the ACR background temperature can be well controlled for 7 min with a noise-equivalent power of a few nanowatts using the proportion-integral-differentiative method. However, unfavorable influence may occur during minutes-long complete equilibrium working time and compromise the measurements. Two different sets of means can be sought to solve this problem. The first set includes physical modification methods to lower the thermal impulse response time constant, such as (1) reducing the heat capacitance of the cavity receiver by revising the cavity size or wall thickness or so, and (2) increasing the thermal conductivity of the thermal link by changing the link material or the link diameter or so. The second set includes a series of actions based on heat transfer models and mathematical analyses to accelerate the measurement processes: first, experiment data were recorded for some time after heat switching but not until achieving complete thermal equilibrium; then, the first order derivatives of the thermistor resistance change were calculated, and the measurement data were re-aligned based on the first order derivatives correspondingly; and last, the thermistor resistance change results at complete thermal equilibrium can be extrapolated when the first derivatives approach zero. In our work, the cavity receiver was designed to measure an optical radiant power as low as ∼1 μW with high accuracy, and therefore, we took advantage of the mathematical methods to shorten the total work time instead of physically reducing the thermal impulse response time.
The thermistor resistance change (
![]()
Figure 5.Cavity receiver thermistor resistance records during the optical radiant power measurements without reaching full thermal equilibrium.
![]()
Figure 6.Thermistor resistance reading changing rate during the optical radiant power measurements without reaching complete thermal equilibrium.
![]()
Figure 7.Derivation of thermistor resistance at complete thermal equilibrium based on the optical radiant power measurement results without reaching complete thermal equilibrium.
A He–Ne laser with 632.8 nm wavelength was vertically polarized and then stabilized with ≤50 ppm (parts per million) drifting by using a liquid crystal modulator. The effective electric heating power across the heater resistance was controlled at a 210 ppm relative uncertainty level. Since the electrical substitution can be performed with small intervals in power, the nonlinearity of the ACR can be minimized to negligible. The typical uncertainty source from the Brewster window is no longer an issue in this work due to the application of the detachable window on the ACR. The uncertainty for optical radiant power measurements using the home-made ACR can be evaluated to be 0.041% (
| Source | Type | Value (%) |
|---|---|---|
| Effective electric heating power | B | 0.021 |
| Cavity thermal non-equivalence | B | 0.005 |
| Cavity absorptivity (250 nm–16 μm) | B | 0.01 |
| Laser power stability | B | 0.005 |
| Nonlinearity | B | (–) |
| Repeatability | A | 0.033 |
| Combined uncertainty ( | 0.041 | |
Table 1. Uncertainty Analysis for Optical Radiant Power Measurements at ∼100 μW (250 nm–16 μm)
| Source | Type | Value (%) |
|---|---|---|
| Effective electric heating power | B | 0.007 |
| Cavity thermal non-equivalence | B | 0.005 |
| Cavity absorptivity (500 nm–16 μm) | B | 0.005 |
| Laser power stability | B | 0.005 |
| Nonlinearity | B | (–) |
| Repeatability | A | 0.01 |
| Combined uncertainty ( | 0.015 | |
Table 2. Uncertainty Analysis for Optical Radiant Power Measurements at ∼1 mW (500 nm–16 μm)
For optical radiant power measurement at the ∼1 mW level, the relative uncertainties of relevant sources are reduced significantly, such as the effective electric heating power and repeatability. If only the spectral range of 500 nm–16 μm is considered, the cavity absorptivity is higher than 0.99995, and the relative uncertainty is 0.005%. The relative uncertainty of the repeatability for multiple rounds of measurements is 0.01%. The combined relative standard uncertainty can then be evaluated to be 0.015% based on the uncertainty analyses highlighted in Table
References
[1] J. E. Martin, N. P. Fox, P. J. Key. Metrologia, 21, 147(1985).
[2] T. Varpula, H. Seppä, J. M. Saari. IEEE Trans. Instrum. Meas., 38, 558(1989).
[3] P. V. Foukal, C. Hoyt, H. Kochling, P. Miller. Appl. Opt., 29, 988(1990).
[5] T. R. Gentile, J. M. Houston, J. E. Hardis, C. L. Cromer, A. C. Parr. Appl. Opt., 35, 1056(1996).
[6] K. D. Stock, H. Hofer. Metrologia, 30, 291(1993).
[7] S. P. Morozova, V. A. Konovodchenko, V. I. Sapritsky, B. E. Lisiansky, P. A. Morozov, U. A. Melenevsky, A. G. Petic. Metrologia, 32, 557(1995).
[8] J. E. Martin, N. P. Fox. Metrologia, 30, 305(1993).
[9] J. Zwinkels, A. Sperling, T. Goodman, J. C. Acosta, Y. Ohno, M. L. Rastello, M. Stock, E. Woolliams. Metrologia, 53, G1(2016).
[10] A. C. Carter, S. R. Lorentz, T. M. Jung, R. U. Datla. Appl. Opt., 44, 871(2005).
[12] N. P. Fox, P. R. Haycocks, J. E. Martin, I. Ul-Haq. Metrologia, 32, 1995.
[13] K. D. Stock, H. Hofer, M. White, N. P. Fox. Metrologia, 37, 437(2000).
[14] W. Pang, X. Zheng, J. Li, X. Shi, H. Wu, M. Xia, D. Gao, J. Shi, T. Qi, Q. Kang. Chin. Opt. Lett., 13, 051201(2015).
[15] K. Zhao, X. Shi, H. Chen, Y. Liu, C. Liu, K. Chen, L. Li, H. Gan, C. Ma. Metrologia, 53, 981(2016).
[16] N. Xu, Y. Lin, H. Gan, J. Li. Proc. SPIE, 10155, 1015513(2016).
[17] X. Zhao, Y. Zhao, K. Tang, L. Zheng, S. Liu, Y. Zhao, F. Li, M. Cui. Nucl. Tech., 41, 040101(2018).
[18] X. Ye, X. Yi, W. Fang, K. Wang, Y. Luo, Z. Xia, Y. Wang. IET Sci. Meas. Technol., 12, 994(2018).
[19] X. Zhuang, H. Liu, P. Zhang, X. Shi, C. Liu, H. Liu, H. Wang. Acta Phys. Sin., 68, 060601(2019).
[20] Z. Qin, G. Xie, J. Ma, P. Yuan, L. Qian. Chin. Opt. Lett., 15, 111402(2017).
[21] J. Hua, Z. Wang, J. Duan, L. Li, C. Zhang, X. Wu, Q. Fan, R. Chen, X. Sun, L. Zhao, Q. Guo, L. Ding, L. Sun, C. Han, X. Li, N. Wang, H. Gong, X. Hu, Q. Liao, D. Liu, T. Yu, Y. Wu, E. Liu, Z. Zeng. Chin. Opt. Lett., 16, 111203(2018).


Set citation alerts for the article
Please enter your email address

© Copyright 2018-2021 | Chinese Laser Press. All Rights Reserved 沪ICP备15018463号-20