
Wenchao LIU, Jiyuan LIU, Wenhui KUANG. Spatio-temporal characteristics of soil protection efforts of the Grain for Green Project in northern Shaanxi Province[J]. Journal of Geographical Sciences, 2020, 30(3): 401
- Journal of Geographical Sciences
- Vol. 30, Issue 3, 401 (2020)
Abstract
Keywords
1 Introduction
Northern Shaanxi Province is situated in the middle of China’s Loess Plateau and is part of the Yellow River system. Soil erosion has been a serious problem in the Loess Plateau since historical records began due to destruction of forests, low vegetation cover and high surface fragmentation, as well as loess’s poor resistance to erosion (
Soil erosion is a major indicator of the soil conservation service function of an ecosystem, which has become an important topic in research on ecosystem services and global environmental change (
The Loess Plateau is the region worst affected by soil erosion in China (
This paper makes use of spatio-temporal serial monitoring data on land cover changes in northern Shaanxi between 2000 and 2013 produced based on human and computer interaction visual interpretations of medium- and high-resolution satellite remote sensing data as well as field investigations. It also uses a RUSLE model to analyze changes in soil erosion in northern Shaanxi during the study period. Analyzing changes in soil erosion caused by turning farmland into forest and grassland will clarify the impact of the Green for Grain Project on changing soil erosion and its effect on soil conservation, thereby providing a scientific basis for the ecological protection and restoration of the Loess Plateau.
Moreover, based on the features of soil erosion in areas dominated by hills and gullies in the Loess Plateau, this paper includes research on improving the parameterization and P-factor of the RUSLE model. Medium- and high-resolution remote sensing images are used to identify terraced fields and carry out P-factor improvements. National soil erosion remote sensing survey data is introduced to adjust the model’s parameters, and an improved parameterization scheme is used to form time series parameters and scale conversions of fragmented ground features, which significantly improves the parameterization scheme and leads to obvious improvements compared to previous RUSLE models.
2 Research data and methods
2.1 Study area overview
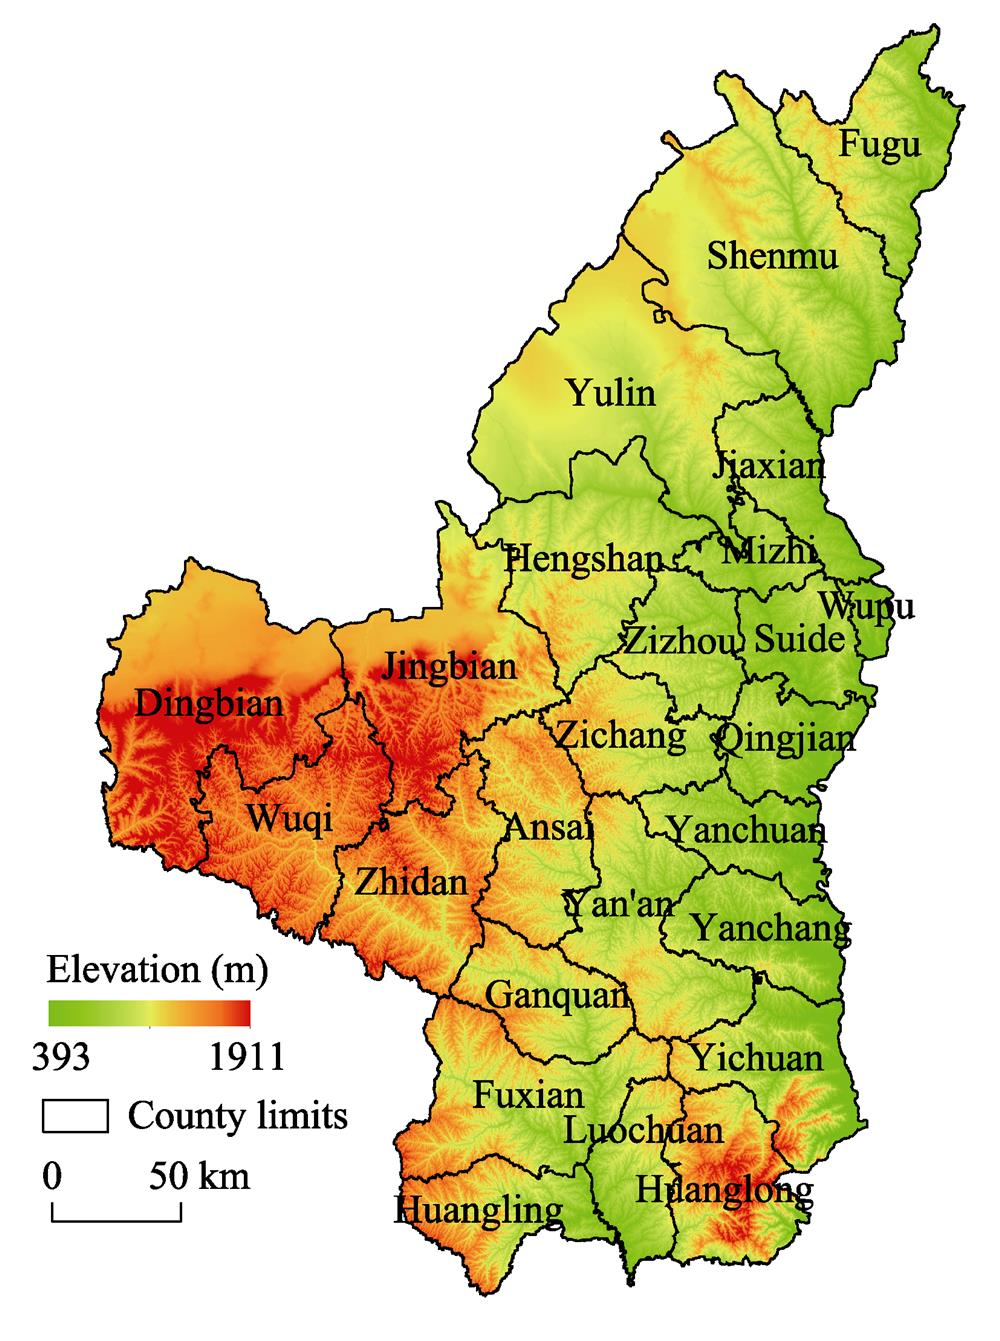
Located in the middle of the Loess Plateau, northern Shaanxi is located at 35°02°- 39°35°N and 107°15°-110°15°E, and borders the Yellow River Gorge and the Loess Plateau of western Shanxi Province to the east, Ziwu Ridge and the Loess Plateau of eastern Gansu Province to the west, the Guanzhong Basin to the south and the Ordos Plateau to the north (
![]()
Figure 1.Figure 1
2.2 Data sources and preprocessing
2.2.1 Farmland and vegetation cover datasets
This paper uses farmland and vegetation cover datasets obtained from the National Changing Land Use Database. The database is a multi-phase 1:100,000 scale land use database established by the author’s research team over the years (
2.2.2 Remote sensing data
Remote sensing data mainly includes monthly normalized difference vegetation index (NDVI) MOD13A data, with spatial resolution of 1km for the period 2000 to 2013, which is used to calculate the vegetation dynamic factors of the RUSLE model.
2.2.3 Meteorological data
Meteorological observation data is from the Chinese Meteorological Data Service Center (http://cdc.cma.gov.cn), including daily and annual data on temperature, precipitation and so on from 27 national weather stations in northern Shaanxi and surrounding areas between 2000 and 2013 recorded by the National Meteorological Administration’s weather station observation network. Based on this, the spline interpolation method from AUNSPLINE meteorological interpolation software was used to obtain temperature and precipitation raster data for northern Shaanxi. Through projection transformation and spatial registration, it is used as the basis for determining soil erosion and runoff precipitation.
2.2.4 Soil data
Soil data is based on the 1:1,000,000 China Soil Database compiled by the Nanjing Soil Research Institute. The database was generated based on the 1:1,000,000 soil maps compiled and published by the National Soil Census Office in 1995. Soil organic carbon data is based on data collected by the National Earth System Science Data Sharing Platform of the Institute of Geographic Sciences and Natural Resources Research, Chinese Academy of Sciences. Soil texture data is based on data provided by the Global Climate Change Data Sharing Network of Beijing Normal University (http://globalchange.bnu.edu.cn). Soil data is used to calculate soil erodibility factors of the RUSLE model.
2.2.5 Terrain data
The topographic dataset required for this study is the Chinese 90-m resolution digital elevation data product in the Shuttle Radar Topography Mission (SRTM), which is sourced from the International Scientific Data Mirror website of the Chinese Academy of Sciences’ Computer Network Information Center (http://datamirror.csdb.cn). It is used to calculate the gradient and slope length factors of the RUSLE model.
2.3 Dynamic monitoring and analysis of arable land, forests and grasslands
This study used a 1:100,000 scale national remote sensing land cover change spatio-temporal sequence dataset, and then used spatial analysis by GIS tools to obtain maps of land cover change for 2000, 2010 and 2013, which were superimposed with a 1km×1km vector grid to generate land use utilization data for 2000, 2010 and 2013, with spatial resolution of 1 km×1 km, as well as to produce dynamic land use raster datasets for the periods 2000-2010 and 2010-2013. This study extracts current and dynamic data of arable land, forest and grassland to conduct dynamic analysis of arable land and forests and grasslands.
2.4 Calculating soil erosion and its parameters based on the RUSLE model
This study uses the Revised Universal Soil Loss Equation (RUSLE) model to estimate levels of soil erosion in northern Shaanxi. The specific equation for calculating soil erosion is as follows:
where A is soil erosion per unit of area (t/ha/a), R is rainfall erosivity factor (MJ·mm/ha/h/a), K is soil erodibility factor ((t·h)/(ha·MJ·mm)), L is the slope length factor, S is the slope steepness factor, C is vegetation cover management factor and P is the support practice factor. L, S, C and P represent the dimensionless impacts.
2.4.1 Calculating rainfall erosivity factor (R)
Rainfall erosivity factor (R) is a leading factor in soil erosion, and it is directly related to the intensity of soil erosion. There are two ways of calculating rainfall erosivity (R): the EI30 classic calculation method and the conventional meteorological data simple algorithm. Because it is difficult to obtain data on the kinetic energy (E) and the intensity of 30 mm (I30) of rainfall, many scholars in China and abroad have created a simple model that considers regional characteristics of rainfall erosion and is based on conventional rainfall data. This study uses Zhang Wenbo et al.’s national daily rainfall fitted model, which is a half-month rainfall erosivity model based on daily rainfall data to estimate rainfall erosivity (
where Mi is the rainfall erosivity value ((MJ·mm)/(ha·h·a)) for a half-month period; Dj is the volume of erosive daily rainfall for day j within a half-month period (requires that the daily rainfall is greater than or equal to 12 mm, otherwise it is calculated as 0, as the threshold of 12 mm is consistent with China’s erosive rainfall standard); k is the number of days in the half-month period, with the half-month cut off set as the 15th day of each month (the first 15 days of each month constitute half-month periods, and the rest of each month constitutes the other half-month periods, giving 24 half-month periods for the year).
α and β are undetermined parameters of the model:
where Pd12 represents average daily rainfall of 12 mm or more, and Py12 represents average annual rainfall of 12 mm or more per day.
2.4.2 Calculating soil erodibility factor (K)
Soil is key to soil erosion, and soil erodibility is an indicator of the susceptibility of surface material to erosion. Although there has been significant research conducted on calculating soil erodibility, seminal approaches using the RUSLE model are Wischmeie et al.’s nomograph method and Williams et al.’s Erosion-Productivity Impact Calculator (EPIC) for determining the relationship between erosion and soil productivity (
Based on soil properties in the US, Wischmeier analyzed 55 soil types, and selected five soil properties, namely silt and very fine sand content, sand content, organic matter content, structure and permeability, to establish a nomograph of K value and soil property. This is calculated as follows:
where K is soil erodibility; OM is the percentage of organic matter content of the soil; M is the soil particle grading parameter, which is claculated as silt (in%) + very fine sand (in%)×(100-clay (in%)) according to the US particle size classification system; S is the soil structure coefficient; P is the permeability level; and Ratio is the conversion coefficient from units in the US system to units in the international system, with a value of 0.1317.
The particle sizes under the US system are as follows: clay (<0.002 mm), silt (0.002-0.05 mm), very fine sand (0.05-0.1 mm) and sand (0.1-2.0 mm).
In this study, data on the Loess Plateau from the 1:1,000,000 National Soil Database was used to calculate soil erodibility. The database was constructed based on the 1:1,000,000 Soil Map of the People's Republic of China compiled and published by the National Soil Census Office in 1995, covering various soil types and major attribute parameters, including erodibility.
2.4.3 Calculating topographic factors (LS)
Topography is a directly inducing factor that leads to soil erosion. LS is the influence of slope length and slope steepness on the erosion process. The methods used to calculate L and S in this study are based on research by
where γ is the slope length (m), and m is a dimensionless constant, which depends on the slope percentage value (θ).
2.4.4 Calculating vegetation cover factor (C)
Vegetation cover factor is the most sensitive factor affecting soil erosion and is directly related to the degree of vegetation cover. It refers to the ratio of total soil loss for soil under certain vegetation cover conditions or field management and total soil loss under the same conditions for clear and continuous fallow land, which is a dimensionless number between 0 and 1. This study uses the C value calculation method proposed by
where the degree of vegetation cover (f) is calculated based on the NDVI, the equation for which is as follows:
where NDVIsoil is the NDVI value for bare soil, and NDVImax is the NDVI for full vegetation cover.
2.4.5 Calculating the support practice factor (P) and improving its method
Support practice factor is defined in the RUSLE model as the ratio of soil loss with a support practice (such as contouring or terracing) to soil loss with straight-row farming up and down the slope (
This study focuses on the effect on soil erosion of turning farmland into forest and grassland, so the impact of terracing on the model’s parameters is of particular importance. Terraced fields are an effective means of controlling water loss and soil erosion on sloping farmland, with clear water retention and soil conservation benefits. A field survey found that terraced fields in northern Shaanxi mainly consist of horizontal terraces. According to an analaysis of data on horizontal terraces in statistcial yearbooks, the terraces were built before the Grain for Green Project was initiated. As such, the extracted results on terraced fields from the year 2000 were input into the RUSLE model to improve the support practice factor (P) and increase the simulation’s accuracy. The specific process was as follows:
(1) Satellite image preprocessing
Terraced fields in the study area were mapped using 67 images with a 2-m resolution from the 2013 ZY-3 satellite, which were processed with geometric precision correction and used as the basis for extracting data on terracing.
(2) Terrace extraction method and outcome
First, the high-resolution satellite images of northern Shaanxi from the 2013 ZY-3 satellite were loaded in ArcGIS 10.0 (
![]()
Figure 2.Figure 2
A hundred fields were randomly selected from the identified terraced fields, and the ratio of the area of terraced fields to the area of the terrace walls were calculated to give their regression relation, with the results showing a complex correlation coefficient of 0.91 (
![]()
Figure 3.Figure 3
Based on the 30 m×30 m spatial resoluton terrace distribution data, P-factor assignment was determined for each grid and then input into the RUSLE model following scale conversion, which improved the RUSLE model in terms of making it more localized.
3 Results and analysis
3.1 Percentage-based support practice factor (P) spatial dataset resolution conversion
To achieve the goal of unifying data using multiple scales, as well as to integrate the scales of other factors in the RUSLE model, it was necessary to convert the terracing data at a spatial resolution of 30 m×30 m into 1 km×1 km resolution data. To do so, this study did not simply use raster data resampling to convert the resolution; rather, the proportion of area of terraced fields was converted to the 1 km grid in order to ensure the proportion of land accounted for by terraced fields did not decrease when the resolution was reduced, and so as not to affect the accuracy of the original data. The specific method employed involved creating a 1 km×1 km grid of northern Shaanxi using GIS and calculating the area of terraced fields in each 1 km grid square to give the proportion of terracing for the dataset. This allowed the conversion of terracing data while ensuring accuracy (
![]()
Figure 4.Figure 4
Taking the year 2000 as an example, if we compare the calculation results of the RUSLE model before and after adding the terraced field data, we see that when terraced field data is not part of the calculation, the average soil erosion modulus of northern Shaanxi is 38.33 t/ha, and when it is added, the average is 34.66 t/ha, a decrease of 9.57%. It is worth noting that, in areas with large areas of terraced fields, if terracing data are included, the calculated soil erosion modulus can reduce by more than 40%. This shows the degree to which terraced field data affects the results of the RUSLE model.
3.2 Verifying and evaluating the accuracy of the RUSLE model
3.2.1 Comparing with the national soil erosion survey dataset
A 2005 national soil erosion remote sensing survey dataset compiled by the Institute of Remote Sensing and Digital Earth (RADI) of the Chinese Academy of Sciences was used to verify soil erosion results simulated by the RUSLE model. The dataset was revised based on a large volume of measured data from provincial soil and water conservation agencies and that was officially released by the Soil and Water Conservation Center of the Ministry of Water Resources of the People’s Republic of China, meaning it is highly precise and complete in terms of its coverage.
The erosion classification system used in the dataset uses a multi-level grading method. The primary level is mainly determined by the type and nature of the external force; the secondary level is the erosion method of the external force; and the third level is the degree of erosion intensity (
| Primary | Secondary | Intensity |
|---|---|---|
| 1 Water erosion | 11 Surface erosion | 111Trace 112 Slight 113 Moderate |
| 114 High 115 Severe 116 Extreme | ||
| 12 Gullying | 121Trace 122 Slight 123 Moderate | |
| 124 High 125 Severe 126 Extreme | ||
| 2 Wind erosion | 20 No sub-classes | 201Trace 202 Slight 203 Moderate |
| 204 High 205 Severe 206 Extreme | ||
| 3 Freeze-thaw erosion | 30 No sub-classes | 301Trace 302 Slight 303 Moderate |
| 304 High | ||
| 4 Gravitational erosion | 40 No sub-classes | No intensity grading |
| 5 Man-made erosion | 50 No sub-classes | No intensity grading |
Table 1.
National soil erosion classification system
| Level | Average erosion modulus (t/ha·a) |
|---|---|
| 1 Trace erosion | < 10 |
| 2 Slight erosion | 10-25 |
| 3 Moderate erosion | 25-50 |
| 4 High erosion | 50-80 |
| 5 Severe erosion | 80-150 |
| 6 Extreme erosion | ≥ 150 |
Table 2.
Soil erosion classification standards
This paper used the GIS method to create 321 random verification points in the northern Shaanxi water erosion data of the national soil erosion remote sensing survey (
![]()
Figure 5.Figure 5
The results show that, of the soil erosion moduli simulated by the RUSLE model for the 321 verification points, a total of 213 accorded with classification data from the national soil erosion remote sensing survey, giving an average correct judgement rate of 66.36%. The correct judgement rates for trace erosion, slight erosion and severe erosion were all over 70%, and only the simulated results for extreme erosion were overestimated. Overall, the mean values of erosion moduli for the verification points were slightly lower than the classification standards from the national soil erosion remote sensing survey. The simulated mean erosion moduli calculated in the other erosion grades were consistent with the soil erosion classification standards. It was verified, then, that the model simulation results were highly accurate.
| Erosion level | Theoretical value (t/ha) | Verification points | No. of points with simulated values within the theoretical value range | Correct judgement rate (%) | 2005 model simulated average (t/ha) |
|---|---|---|---|---|---|
| Trace | <10 | 50 | 38 | 76.00 | 7.89 |
| Slight | 10-25 | 46 | 33 | 71.74 | 17.90 |
| Moderate | 25-50 | 56 | 39 | 69.64 | 37.29 |
| High | 50-80 | 46 | 28 | 60.87 | 61.61 |
| Severe | 80-150 | 50 | 37 | 74.00 | 89.43 |
| Extreme | ≥ 150 | 73 | 38 | 52.05 | 123.42 |
Table 3.
RUSLE model simulation results
3.2.2 Comparing annual sediment runoff data from hydrological stations in the Yellow River Sediment Bulletin
This study also compared the annual sediment runoff volumes of six hydrological stations around the northern Shaanxi region published in the Yellow River Sediment Bulletin (compiled by the Hydrology Bureau of the Yellow River Conservancy Commission in 2001) with annual sediment runoff moduli. The six hydrological stations are the Longmen station in the Yellow River Basin, the Wenjiachuan station in the Kuye River Basin, the Baijiachuan station in the Wuding River Basin, the Ganguyi station in the Yanhe River Basin, the Huangfuchuan station in the Huangfu River Basin and the Zhuangtou station in the Beiluo River Basin. Of these, the Huangfuchuan, Wenjiachuan, Baijiachuan and Ganguyi stations are located inside the northern Shaanxi study area, and the Longmen and Zhuangtou stations are located outside the study area (
![]()
Figure 6.Figure 6
Based on the sediment runoff volumes and catchment areas of the six hydrological stations in the Yellow River Sediment Bulletin, sediment runoff moduli were calculated for each hydrological station (
| Station name | Catchment area (104 ha) | Sediment runoff (108 t) | Sediment runoff modulus (t/ha) |
|---|---|---|---|
| Wenjiachuan | 86.45 | 0.11 | 12.72 |
| Baijiachaun | 296.62 | 0.96 | 32.36 |
| Ganguyi | 58.91 | 0.22 | 37.35 |
| Huangfuchuan | 31.99 | 0.14 | 43.76 |
| Zhuangtou | 251.54 | 0.70 | 27.83 |
| Longmen | 4975.52 | 2.36 | 4.75 |
Table 4.
Hydrological station data
3.3 Analysis of erosion in northern Shaanxi in 2000, 2010 and 2013
The model results show that total soil erosion in northern Shaanxi was 27,488.07× 104 t in 2000, and erosion levels in the Yan’an and Yulin areas were 11,856.38×104 t (43.13% of the total for the region) and 15,631.69 ×104 t (56.77%), respectively (
| 2000 | 2010 | 2013 | ||||
|---|---|---|---|---|---|---|
| Soil erosion | Proportion* | Soil erosion | Proportion* | Soil erosion | Proportion* | |
| Yan’an | 11856.38 | 43.13 | 6484.56 | 40.59 | 5503.15 | 35.46 |
| Yulin | 15631.69 | 56.87 | 9493.14 | 59.41 | 10016.61 | 64.54 |
Table 5.
Statistical analysis of soil erosion in Yan’an and Yulin in 2000, 2010 and 2013
![]()
Figure 7.Figure 7
In 2010, total soil erosion in northern Shaanxi was 15,977.69×104 t, with erosion in Yan’an and Yulin totaling 6484.56×104 t (40.59%) and 9493.14×104 t (59.41%), respectively (
In 2013, total soil erosion in northern Shaanxi was 15,519.76 ×104 t. Soil erosion in Yan’an and Yulin was 5503.15 ×104 t (35.46%) and 10,016.61 ×104 t (64.54%), respectively (
3.4 Changing soil erosion in project area from 2000 to 2013
Using the aforementioned data on changing land use and soil erosion simulations, this study pays close attention to changes in soil erosion of farmland inside the project area before and after implementation of the Green for Grain Project as a means of assessing the effectiveness of the project. With the help of overlay analysis of soil erosion data and data on farmland returned to forest and grassland, it was found that soil erosion in areas where the Green for Grain Project was implemented decreased between 2000 and 2010 by 885.59×104 t, equivalent to 47.08% of soil erosion in 2000. In particular, soil erosion in project areas in Yan’an decreased by 528.18×10⁴ t, equivalent to 46.59% of soil erosion in 2000, while soil erosion in project areas in Yulin decreased by 357.71×10⁴ t, equivalent to 47.82% of soil erosion in 2000. As such, whether one looks at northern Shaanxi as a whole or the areas of Yan’an and Yulin, the effect of the Green for Grain Project on reducing soil erosion is clear. The repurposing of farmland into forest and grassland accounted for the largest proportion of the decrease in soil erosion. Specifically, the conversion of farmland into forest resulted in a decrease in soil erosion of 217.11×10⁴ t, equivalent to 43.91% of soil erosion prior to the Green for Grain Project, while the conversion of farmland into grassland resulted in a decrease of 654.29×10⁴ t, equivalent to 48.51% of soil erosion before the project. Moreover, the repurposing of cultivated land for construction land resulted in a reduction in soil erosion of 13.84×10⁴ t, which was the biggest cause of the reduction in soil erosion except for the Green for Grain Project (
| Type of change | Region | Yan’an | Yulin | |||
|---|---|---|---|---|---|---|
| Soil erosion | Proportion* | Soil erosion | Proportion* (%) | Soil erosion | Proportion* | |
| Farmland→Forest | -217.11 | -43.91 | -129.05 | -43.18 | -88.06 | -45.02 |
| Farmland→Grassland | -654.29 | -48.51 | -391.28 | -47.93 | -263.01 | -49.39 |
| Farmland→Water body | -0.26 | -24.49 | -0.10 | -33.99 | -0.16 | -20.94 |
| Farmland→Construction | -13.84 | -38.31 | -7.57 | -43.10 | -6.28 | -33.79 |
| Farmland→Unutilized | -0.40 | -28.14 | -0.19 | -25.72 | -0.21 | -30.75 |
| Total reductions | -885.90 | -47.08 | -528.18 | -46.59 | -357.71 | -47.82 |
Table 6.
Soil erosion moduli change of repurposed farmland in northern Shaanxi between 2000 and 2010
It is worth noting that the conversion of farmland to other types of land use, such as uncultivated farmland or construction land, is not necessarily ecological reforestation. In addition, uncultivated farmland or farmland converted to forest or grassland that is improperly managed and deteriorates, can actually have a slight increase in erosion modulus.
Farmland areas with the most significant reductions in their soil erosion moduli were concentrated in the counties surrounding the city of Yan’an in the south-central parts of northern Shaanxi and areas east and southwest of the city of Yulin. There were also a few places in the south-central parts of northern Shaanxi near Yan’an where a reduction in farmland, mainly due to it being left uncultivated, caused an increase in the soil erosion modulus (
![]()
Figure 8.Figure 8
Between 2010 and 2013, the first phase of the Green for Grain Project in northern Shaanxi was coming to an end, and the main focus was on consolidating results, with little farmland still being repurposed. During this period, changing land use of farmland had little to do with ecological objectives. Rather, the main reason for repurposing farmland was for urban construction or simply leaving land uncultivated. Compared to 2010, soil erosion fell slightly by 2013. In terms of quantities, the reduction in farmland in northern Shaanxi decreased soil erosion by 622.97 t in 2013, equivalent to 1.7% of the region’s soil erosion in 2010. Reductions in farmland in Yan’an and Yulin decreased soil erosion by 107.17 t (1.88% of the 2010 erosion level) and 515.81 t (1.67%) respectively. Looking at the changing land uses, the reduction in soil erosion as a result of converting farmland to construction land was the greatest, at 2162.13 t, equivalent to 15.32% of the region’s soil erosion in 2010; whereas, the increase in soil erosion due to converting farmland to unutilized land was 1880.37 t, equivalent to 10.26% of the region’s soil erosion in 2010 (
| Type of change | Region | Yan’an | Yulin | |||
|---|---|---|---|---|---|---|
| Soil erosion | Proportion* | Soil erosion | Proportion* | Soil erosion | Proportion* | |
| Farmland→Forest | 0.00 | 0.00 | 0.00 | 0.00 | 0.00 | 0.00 |
| Farmland→Grassland | -45.50 | -51.98 | 0.00 | 0.00 | -45.50 | -51.98 |
| Farmland→Water body | -295.72 | -7.24 | -44.67 | -4.67 | -251.05 | -8.02 |
| Farmland→Construction | -2162.13 | -15.32 | 130.87 | 3.05 | -2293.00 | -23.35 |
| Farmland→Unutilized | 1880.37 | 10.26 | -193.36 | -43.39 | 2073.73 | 11.59 |
| Total reductions | -622.97 | -1.70 | -107.17 | -1.88 | -515.81 | -1.67 |
Table 7.
Changes in soil erosion resulting from repurposing farmland in northern Shaanxi between 2010 and 2013
3.5 Spatio-temporal characteristics of soil erosion changes in integral northern Shaanxi from 2000 to 2013 and driving force analysis
Between 2000 and 2010, soil erosion in the northern Shaanxi region as a whole decreased by 11,510.38×104 t, equivalent to 41.87% of total erosion in northern Shaanxi in 2000, while soil erosion fell by 5371.83×104 t (19.54% of the 2000 erosion level for the whole of northern Shaanxi) and 6138.55×104 t (22.33%) in Yan’an and Yulin, respectively (
![]()
Figure 9.Figure 9
Between 2010 and 2013, soil erosion in northern Shaanxi continued to decrease slightly. The total reduction for the region was 457.94×10⁴ t (2.87% of the 2010 erosion level for the whole of northern Shaanxi). Yan’an and Yulin differed, in that Yan’an’s soil erosion decreased by 981.41×10⁴ t (6.14% of the 2010 level for the whole of northern Shaanxi) and Yulin’s soil erosion increased by 523.48×10⁴ t (3.28%) in that period (
During the first 10 years and the last 3 years of the study period, the variation trend of the amount of erosion in northern Shaanxi was different. From 2000 to 2010, the changes of natural conditions and land surface by human activities were the two main reasons made the soil erosion changes. From 2010 to 2013, human beings had little disturbance to the land surface, and natural conditions including precipitation and vegetation coverage were the main driving factors for the change of soil erosion during this period. Therefore, it is neces- sary to analyze the changes of precipitation and vegetation coverage in this region from 2000 to 2013, so as to clarify the driving mechanism of soil erosion changes in northern Shaanxi.
It can be seen from
![]()
Figure 10.Figure 10
From the perspective of space, the precipitation of northern Shaanxi increased significantly in many places from 2000 to 2010, especially in Shenmu county and Fugu county in the north, Dingbian county and Jingbian county in the west, and Fu county and Huangling county in the south. Precipitation decreased only in the southern mountainous area of Huanglong county in Yan’an (
![]()
Figure 11.Figure 11
From 2010 to 2013, the amount of precipitation in northern Shaanxi showed obvious discrepancy in different regions, which was also the main reason for the spatial differentiation of soil erosion during this time. In this period, the precipitation in the central part of northern Shaanxi increased significantly, while the northern and southern parts decreased significantly (
3.6 Soil conservation effects of the Green for Grain Project in northern Shaanxi
The mean soil erosion modulus of repurposed farmland in northern Shaanxi was the highest in 2000, at 48.22 t/ha, falling to 25.52 t/ha in 2010, a decrease of 47.08% over the decade. By comparison, the mean soil erosion modulus of land that remained farmland but had other ecological restoration measures applied to it decreased by only 28.6%. During the same period, the mean erosion modulus for the whole of northern Shaanxi decreased 41.87% (
| 2000 mean soil erosion modulus (t/ha) | 2010 mean soil erosion modulus (t/ha) | 2000-2010 change in soil erosion modulus (%) | |
|---|---|---|---|
| Repurposed farmland | 48.22 | 25.52 | -47.08 |
| Non-repurposed farmland | 38.41 | 27.43 | -28.60 |
| Whole of northern Shaanxi | 34.66 | 20.15 | -41.87 |
Table 8.
Changes in the soil erosion moduli of different regions of northern Shaanxi between 2000 and 2010
The rate of reduction in the erosion modulus of the region’s non-repurposed farmland was clearly lower than the rate of reduction for northern Shaanxi as a whole, but the reduction is largely attributable to the overall increase in vegetation coverage across the region. Due to ecological projects such as the afforestation of barren hillsides, the tops of many hillside fields now have relatively good forest and grassland coverage, which has helped to protect the farmland below. This has caused a clear decrease in the soil erosion modulus of non-repurposed farmland in northern Shaanxi compared to 2000. Nevertheless, the rate of decrease is still much lower than that of repurposed farmland and of the region as a whole.
Looking at different farming methods, there are stark differences in soil erosion. There is not a significant difference in the reduction in soil erosion between repurposed terraced farmland and non-repurposed terraced farmland, at 4.17% and 5.28% respectively, proving that terraced fields have relatively low levels of erosion and whether farmland is repurposed or not does not have a significant impact on the level of erosion. Sloping farmland though, shows a very different picture. The mean erosion modulus of repurposed sloping farmland decreased by 48.09% between 2000 and 2010, which means that the majority of the decrease in the erosion modulus of repurposed farmland came from repurposed sloping farmland, while the average erosion modulus of non-repurposed sloping farmland during that period fell by 29.95% (
| 2000 mean soil erosion modulus (t/ha) | 2010 mean soil | 2000-2010 change | |
|---|---|---|---|
| Repurposed terraced farmland | 15.21 | 14.58 | -4.17 |
| Repurposed sloping farmland | 50.66 | 26.30 | -48.09 |
| Non-repurposed terraced farmland | 16.74 | 15.84 | -5.38 |
| Non-repurposed sloping farmland | 41.57 | 29.12 | -29.95 |
Table 9.
Changing soil erosion moduli of terraced and sloping farmland in northern Shaanxi between 2000 and 2010
In general, although terraced farmland made up a small proportion of the total repurposed farmland between 2000 and 2010, whether it was repurposed or not did not have a large impact on soil erosion, and changing the land use of terraced farmland did not have actual ecological benefits. As such, when choosing whatever type of farmland for changing the land use pattern, sloping farmland should be the main choice, and terraced farmland should not be repurposed or seldomly repurposed.
4 Discussion and conclusions
4.1 Discussion
(1) This study uses remote sensing monitoring technology to analyze farmland dynamics. Specifically, this study based on medium-high resolution remote sensing dataset, adopted human-computer interaction interpretation method to obtained spatio-temporal monitoring datasets of land cover changes, and the results were verified in the field. However, the conversion of farmland to forest and grassland has a certain hysteresis in the remote sensing image. Usually, the vegetation cover changes can only be accurately identified on the remote sensing image several years after the beginning of the project. As a result, the mapping accuracy of farmland conversion may be reduced by this phenomenon. Although we have strengthened the field investigation and verification work to improve the mapping accuracy, yet the terrain in northern Shaanxi is broken, and the patches of converted farmland are relatively small, so it is inevitable that there will be a small number of omission or miscalculation. In the future, remote sensing information sources with high spatial resolution and high spectral resolution can be used to assist in so as to improve the accuracy of mapping and classification.
(2) The Green for Grain Project has made outstanding contributions to the protection and improvement of ecosystem service functions, which is mainly reflected in its soil conservation results. The RUSLE model is an empirical equation used in recent years to estimate a soil erosion modulus, but previous studies have sought to improve the accuracy of the model by improving natural factors such as rainfall erosivity, while tending to determine the support practice factor (P) by assigning weighted values to different land use types (
(3) Previous research on soil erosion in northern Shaanxi has largely been on small watershed (
(4) A focus of this study was to improve the support practice factor used in the RUSLE model, but topographical and soil data was not used as dynamic parameters in the model’s calculation. Improvements could be made to such factors in future research in order to further improve the accuracy of the model simulation.
4.2 Conclusions
(1) Between 2000 and 2010, soil erosion declined by 885.9×10⁴ t in areas of repurposed farmland in northern Shaanxi, equivalent to 47.08% of the soil erosion of repurposed farmland in 2000. The conversion of farmland into forest and grassland contributed the most to reducing soil erosion, with falls of 43.91% and 48.51% in their respective areas. Comparing this with the change in soil erosion for northern Shaanxi as a whole during the same period, it was found that the repurposing of sloping farmland had a significant effect on reducing the soil erosion modulus of the whole region, and the main reason for the reduction in the soil erosion modulus of non-repurposed farmland was an increase in surrounding vegetation coverage (but the decrease in the erosion modulus was lower than the regional average). Driven by ecological projects, soil erosion in northern Shaanxi decreased significantly between 2000 and 2013, with a reduction of 41.87% between 2000 and 2010, and a further reduction of 6.14% between 2010 and 2013.
(2) The following was seen from a comparative analysis of Yan’an and Yulin: 19.67% of farmland in the Yan’an area was repurposed and soil erosion declined 53.58% between 2000 and 2013, while during the same period, 5.85% of farmland in the Yulin area was repurposed and soil erosion fell 35.92%; the Green for Grain Project was implemented significantly more in Yan’an than in Yulin, which meant that soil erosion declined far more in Yan’an than in Yulin, indicating that the soil conservation effect of the Green for Grain Project was better in Yan’an than in Yulin. As a result, during the next phase of implementing ecological projects, Yulin should increase implementation appropriately to improve the soil conservation effects of projects.
(3) This paper researched improvements to the parameterization and P-factor of the RUSLE model based on the soil erosion characteristics of areas dominated by hills and gullies in the Loess Plateau. An improvement to the P-factor was achieved by using high-resolution remote sensing data to extract data on terraces, which significantly improved quantitative simulation results.
References
[1] C F Cai, S W Ding, Z H Shi et al. Study of applying USLE and geographical information system IDRISI to predict soil erosion in small watershed. Journal of Soil and Water Conservation, 14, 19-24(2000).
[2] Q G Cai, Z X Lu, G P Wang. Process-based soil erosion and sediment YIEID model in a small basin in the hilly loess region. Acta Geographica Sinica, 63, 108-117(1996).
[3] Q G Cai, G P Wang, Y Z Chen. Erosion and Sediment Yield Process and Simulation in Small Watershed of Loess Plateau(1998).
[4] J S Chen. Grain for Green Project with Sustainable Development of the Western China(2006).
[5] Roo A De, C G Wesseling, C G Ritsma. LISEM: A single-event, physical based hydrological and soils erosion model for drainage basin, I: Theory, input and output. Hydrological Processes, 10, 1107-1117(1996).
[6] W D Ellision. Soil erosion studies - Part I. Agricultural Engineering, 28, 145-146(1947).
[8] B J Fu, W W Zhao, L D Chen et al. Multi-scale soil erosion evaluation index. Chinese Science Bulletin, 51, 1936-1943(2006).
[9] S H Fu, B Y Liu. Evolution of the soil erosion model. Advance in Earth Sciences, 17, 78-84(2002).
[10] G Y Gao, B J Fu, Y H Lv et al. The effect of land cover pattern on hillslope soil and water loss in the arid and semi-arid region: A review. Acta Ecologica Sinica, 33, 12-22(2013).
[11] W S Gao, X B Dong. Valuation of fragile agriculture ecosystem services in loess hilly-gully region: A case study of Ansai county. Journal of Natural Resources, 18, 182-188(2003).
[12] M M Guo, W L Wang, H L Kang et al. Changes in soil properties and erodibility of gully heads induced by vegetation restoration on the Loess Plateau, China. Journal of Arid Land, 10, 712-725(2018).
[13] X H Han. Research on ecological effect and mechanism of forestry (grass) project in Loess Plateau. Yangling: Northwest A & F University(2008).
[14] Z L Huang, B J Fu, L D Chen. Restructure and restoration of ecosystem in Loess Plateau based on restoration ecology. Journal of Soil and Water Conservation, 16, 122-125(2002).
[16] Z S Jiang, Z Liu, Z W Jia. Research for relationships between topographic factors and loss of soil and water on sloping land. Academic Sinica & Ministry of Water Conservancy, 12, 1-3(1990).
[17] Q Li, M X Xu, Y G Zhao et al. Gully erosion soil quality assessment on the cultivated slope land in the Loess Plateau region, China. Journal of Natural Resources, 27, 1001-1012(2012).
[18] T H Li, L N Zheng. Soil erosion changes in the Yanhe watershed from 2001 to 2010 based on RUSLE model. Journal of Natural Resources, 27, 1164-1175(2012).
[19] Z S Liang, C Q Zuo, J R Jiao. The role of ecology restores on soil and water conservation in Loess Plateau. Journal of Northwest Forestry University, 18, 20-24(2003).
[20] B Y Liu, M A Nearing, L M Risse. Slope gradient effects on soil loss for steep slopes. Transactions of the ASAE, 37, 1835-1840(1994).
[22] D S Liu. Loess and Environment, 176-190(1985).
[23] J Y Liu, M L Liu, D F Zhuang et al. Study on spatial pattern of land-use change in China during 1995-2000. Science in China, 46, 373-384(2003).
[24] D K McCool, G R Foster, C K Mutchler et al. Revised slope length factor for the universal soil loss equation. Transactions of the ASAE, 30, 1387-1396(1989).
[25] R Morgan, R J Rickson. The European soil erosion model: An update on its structure and research base. Conserving Soil Resources European Perspectives(1994).
[26] Z Y Ouyang, R S Wang. Ecosystem services and their economic valuation. World Sci-Tech R&D, 1, 45-50(2000).
[27] K G Renard, G R Foster, G A Weesies et al. Predicting soil erosion by water: A guide to conservation planning with the revised universal soil loss equation (RUSLE). Agriculture Handbook, 703, 27-28(1997).
[29] . Shaanxi Statistical Yearbook(2010).
[30] Man’s Impact on the Global Environment. Berlin: Springer-Verlag(1970).
[31] F Q Song, K X Xing, Y Liu et al. Monitoring and assessment of vegetation variation in northern Shaanxi based on MODIS/NDVI. Acta Ecologica Sinica, 31, 354-363(2011).
[32] L X Wang, C W Wu. Study on the mechanism of soil conservation effect of forested hillslope. Journal of Beijing Forestry University, 16, 1-7(1994).
[33] T Wang. Quantitative analysis on influencing factors of soil erosion using RUSLE: A case study of the Luohe basin in northern Shanxi province. Environmental Science & Technology, 41, 170-177(2018).
[34] W Z Wang. A study on rainfall erosion R index in loess region. Soil and Water Conservation in China, 12, 36-40(1987).
[35] X P Wang, H Y Li. Study on ecological restoration and reconstruction in the Loess Plateau. Soil and Water Conservation in China, 6, 23-25(2006).
[36] J Williams, C Jones, P Dyke. Modeling approach to determining the relationship between erosion and soil productivity. Transactions of the ASAE, 27, 129-144(1984).
[37] W H Wischmeier, C B Johnson, B V Cross. A soil erodibility nomograph for farmland and construction sites. Journal of Soil and Water Conservation, 26, 189-193(1971).
[38] Y Xu, Y H Liu, Q Tang. National major function oriented zoning and ecological environment restoration of the Loess Plateau. Research of Soil and Water Conservation, 16, 1-5(2009).
[39] Y Q Xu, X M Shao. Estimation of soil erosion supported by GIS and RUSLE: A case study of Maotiaohe watershed, Guizhou province. Journal of Beijing Forestry University, 28, 67-71(2006).
[40] J P Yan. Ecological Environment Construction and System Innovation in Northwest China(2004).
[41] S C You, W Q Li. Estimation of soil erosion supported by GIS: A case study in Guanxi township, Taihe, Jiangxi. Journal of Natural Resources, 14, 63-69(1999).
[42] Q Y Zhang, X X Jia, C L Zhao et al. Revegetation with artificial plants improves topsoil hydrological properties but intensifies deep-soil drying in northern Loess Plateau, China. Journal of Arid Land, 10, 335-346(2018).
[43] W B Zhang, Y Xie, B Y Liu. Rainfall erosivity estimation using daily rainfall amounts. Scientia Geographica Sinica, 22, 705-711(2002).


Set citation alerts for the article
Please enter your email address

© Copyright 2018-2021 | Chinese Laser Press. All Rights Reserved 沪ICP备15018463号-20