
Benjamin M. Knight, Connor M. Gautam, Colton R. Stoner, Bryan V. Egner, Joseph R. Smith, Chris M. Orban, Juan J. Manfredi, Kyle D. Frische, Michael L. Dexter, Enam A. Chowdhury, Anil K. Patnaik, "Detailed characterization of kHz-rate laser-driven fusion at a thin liquid sheet with a neutron detection suite," High Power Laser Sci. Eng. 12, 010000e2 (2024)
- High Power Laser Science and Engineering
- Vol. 12, Issue 1, 010000e2 (2024)
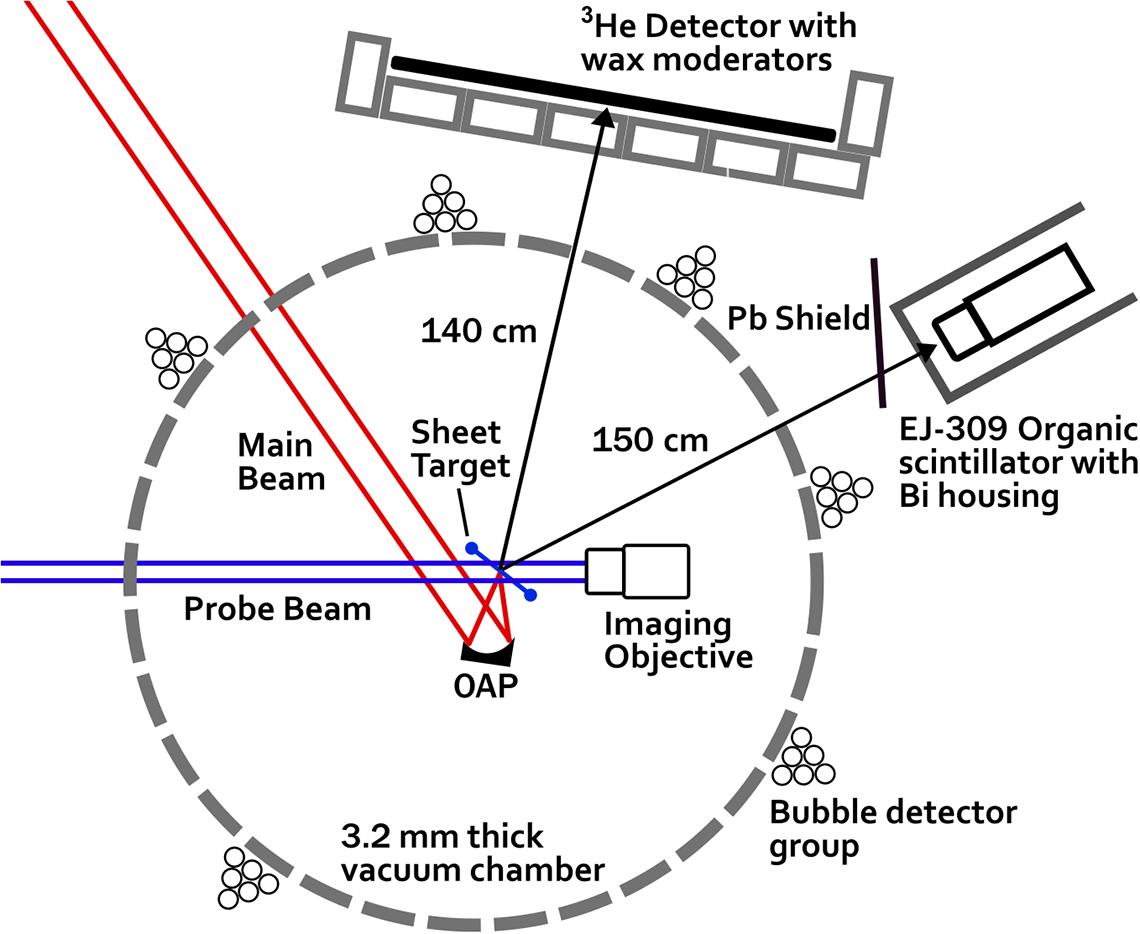
Fig. 1. Simplified overhead view of the target chamber and surrounding detectors. The main beam has a central wavelength of 780 nm with 8 mJ energy; the probe beam has a central wavelength of 420 nm with 80 μJ energy.

Fig. 2. Three-dimensional model of the interaction region. As in Figure 1, the main beam is shown in red and the probe beam is shown in blue. The jets are in white near the top of the image, and the size of the liquid sheet is exaggerated for illustration.
Fig. 3. Absolute detection efficiency of the EJ-309 scintillator calculated via Geant4 simulation. The vertical axis indicates that roughly  neutrons are produced for every neutron detected, and the shaded regions indicate error. Light-yield thresholds are equal to or more than 0.4 MeVee, and the difference in the two efficiencies is less than 0.5%. The units are defined such that 1 MeVee (MeV electron equivalent) equals the number of scintillation photons produced by a 1 MeV electron.
neutrons are produced for every neutron detected, and the shaded regions indicate error. Light-yield thresholds are equal to or more than 0.4 MeVee, and the difference in the two efficiencies is less than 0.5%. The units are defined such that 1 MeVee (MeV electron equivalent) equals the number of scintillation photons produced by a 1 MeV electron. Fig. 4. Two-dimensional PSD histogram of neutrons and photons in the organic scintillator. The color scale denotes the number of events.
Fig. 5. One-dimensional PSD histograms for the EJ-309 scintillator. The blue data are the same as in Figure 4; the red curve shows a shorter-duration experiment with  instead of
  as a control.
instead of as a control. Fig. 6. Background-subtracted data from the  tube.
tube.  (blue) and
  (red) correspond to the same experiments shown in
 Figure 5 .
tube. (blue) and (red) correspond to the same experiments shown in Fig. 7. Energy histogram of emitted neutrons, as measured by the organic scintillator via time-of-flight. Data were collected for 54 minutes with the scintillator subtending 0.0035 steradians, and counts are not scaled with detection efficiency. That is, only the raw counts are shown. The peak corresponds to the expected 2.45 MeV of D-D fusion neutrons.
Fig. 8. 2D3v PIC simulation results. The top figure shows neutron count data versus time and shows the difference between s- and p-polarization. The dashed line marks the time when the laser’s pulse envelope interacts with the target. Neutrons begin to leave the simulation starting around 800 fs. The bottom figure shows energy spectra of the simulation particles at 500 fs. Deuteron energies are shown with dotted lines and neutron energies are shown with solid lines. The p-polarized laser simulations show enhanced neutron generation and ion acceleration.
Fig. 9. A frame of the 2D3v simulation with s-polarization at 600 fs after the start of the simulation, showing the deuterated sheet in black and neutrons in red. The supplemental movie (see the Supplementary Material section) shows the full evolution through 900 fs.
|
Table 1. Comparison of neutrons/second and associated statistical errors from the three detection systems across two separate experiments. Note that other non-statistical errors contribute to the uncertainties and are not represented in this table, in particular for the  He detector and bubble detectors.
He detector and bubble detectors.
|
Table 2. Detector angles, estimated source counts and calculated uncertainties for the three-scintillator array. Detectors are named by their viewing angle, with  defined as the laser propagation direction.
defined as the laser propagation direction. 

Set citation alerts for the article
Please enter your email address

© Copyright 2018-2021 | Chinese Laser Press. All Rights Reserved 沪ICP备15018463号-20