
Zhishan Hou, Jiaji Cao, Aiwu Li, Han Yang. Tunable protein microlens array[J]. Chinese Optics Letters, 2019, 17(6): 061702
- Chinese Optics Letters
- Vol. 17, Issue 6, 061702 (2019)
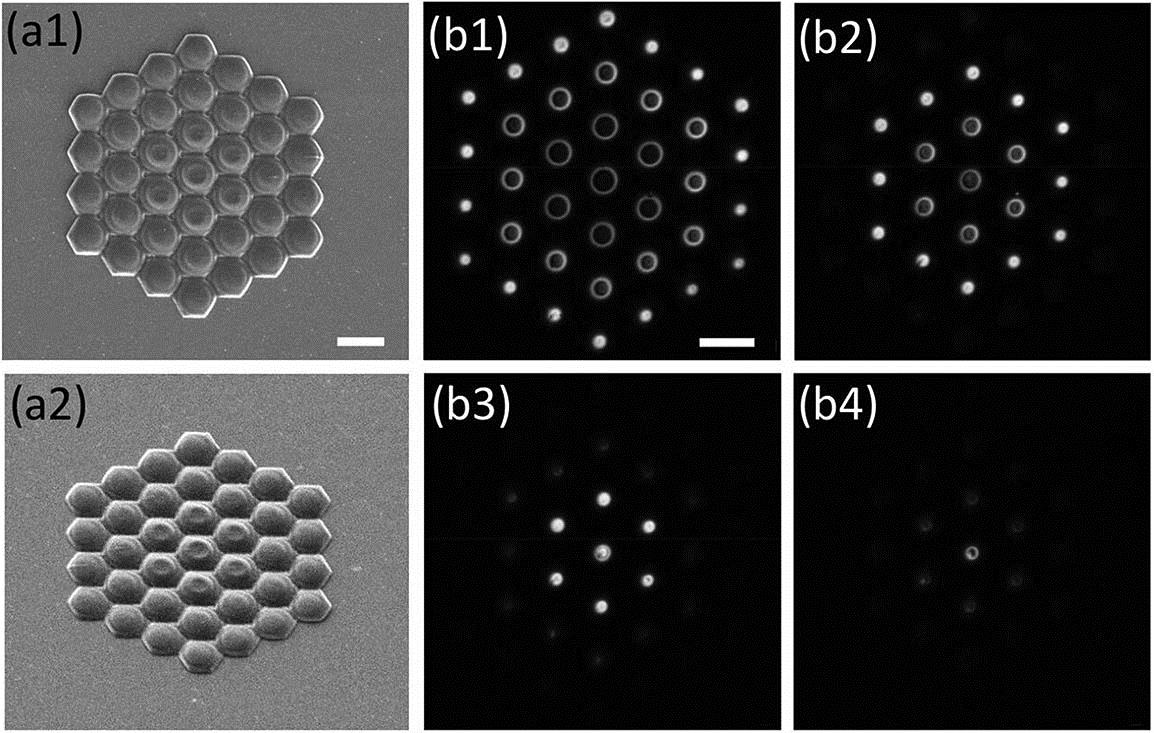
Fig. 1. (a1) and (a2) SEM images of four-circle PMLADC taken from top and 45°, respectively; scale bar: 20 μm. (b1)–(b4) The LSCM images of four-circle PMLADC were taken with 1 μm position interval; scale bar: 20 μm.
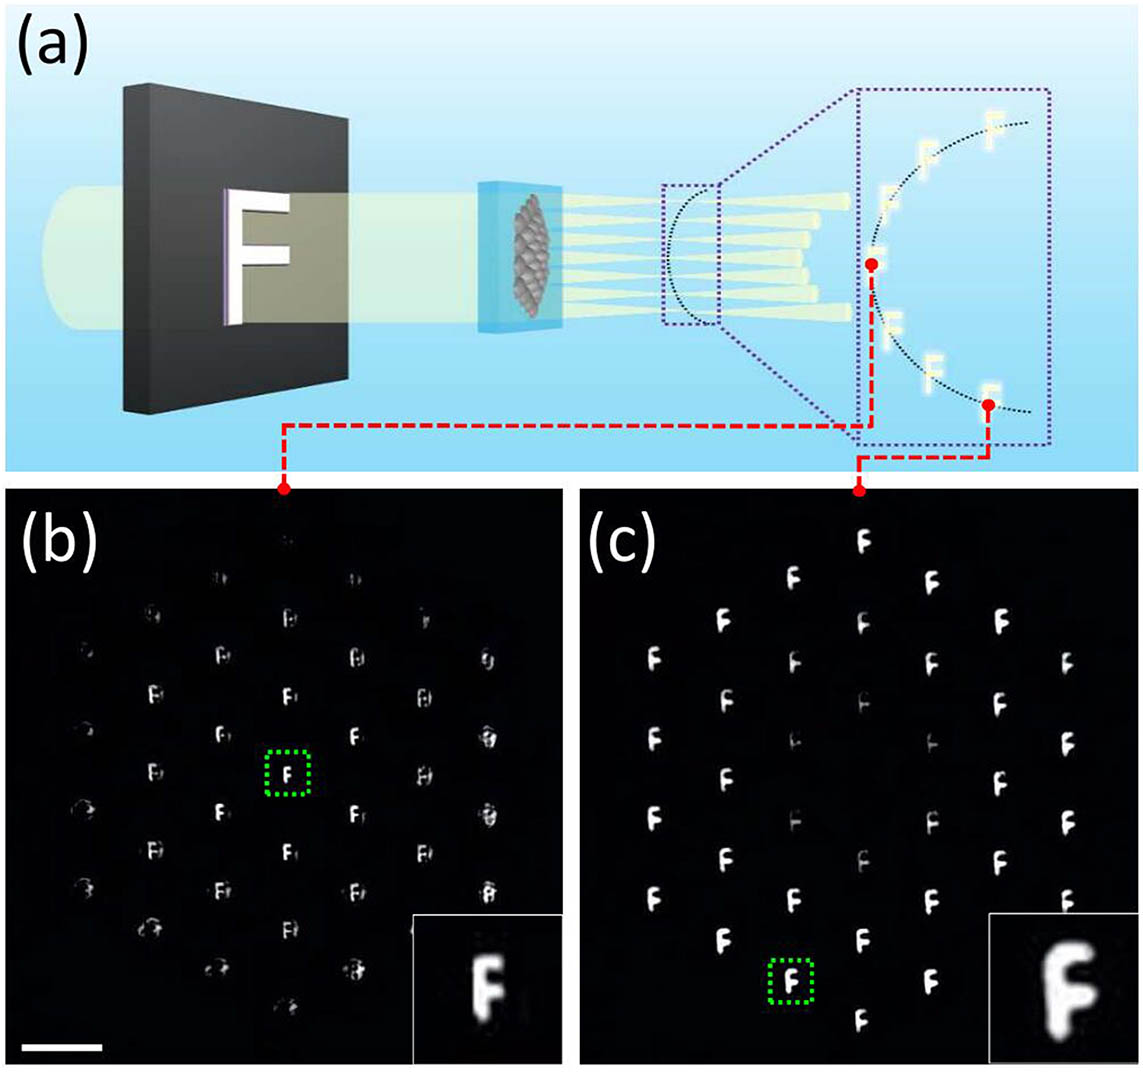
Fig. 2. (a) Schematic of the test of the PMLADC. Imaging pictures were taken at (b) 19.6 μm and (c) 24.2 μm from PMLADC; scale bar: 20 μm.
Fig. 3. (a1) and (a2) SEM images of one-row microlenses taken from the top and 45°. (b1)–(b6) Focus images were taken at different locations from the lenses: 18.2 μm, 19.6 μm, 22.7 μm, 26.2 μm, 34.0 μm, 41.4 μm, respectively. (c1)–(c6) Relative intensity distribution of focus images (b1)–(b6). Scale bar: (a) 10 μm, (b) 20 μm.
Fig. 4. (a) LSCM images of one-row PMLADC; scale bar: 10 μm. (b) The profile lines of the lens group under different pH values. (c) The curvature radii of lenses A, B, C under different pH values.
Fig. 5. (a) Focal length and refractive index of lens B at different pH values. (b) Schematic of the change of the focal plane of the one-row PMLADC and (c) schematic of four-circle PMLADC under a microscope.

Set citation alerts for the article
Please enter your email address
© Copyright 2018-2021 | Chinese Laser Press. All Rights Reserved 沪ICP备15018463号-20