• Journal of Resources and Ecology
  • Vol. 11, Issue 5, 499 (2020)
Yajun WANG* and Lifang ZHONG
Author Affiliations
  • School of Economics and Management, Ningxia University, Yinchuan 750021, China
  • show less
    DOI: 10.5814/j.issn.1674-764x.2020.05.007 Cite this Article
    Yajun WANG, Lifang ZHONG. Research Framework for Ecosystem Vulnerability: Measurement, Prediction, and Risk Assessment[J]. Journal of Resources and Ecology, 2020, 11(5): 499 Copy Citation Text show less
    Fig. 1
    Fig. 1. Fig. 1
    Target layerIndex layerResearch objectLiterature sources
    Exposure, sensitivity, adaptabilityPopulation pressure, environmental degradation, industrial pollution, income difference, natural background, economic strength, infrastructure, fiscal expenditure, social securityLoess plateau areaMa et al., 2019
    Ecological environment, natural resources, social economy, sustainabilityVegetation index, soil organic matter, rainfall, water resources, engel coefficient, gross domestic product(GDP) index, natural population growth rate, contribution rate of tertiary industryHilly mining areaLiu et al., 2018
    Pressure, sensitivity, stabilityPopulation pressure, social pressure, environmental pressure, economic pressure, desertification sensitivity, salinity sensitivity, function, vitality, elasticity, structural limitationsTurpan areaPei et al., 2015
    Natural quality, anthropogenic pressurePrecipitation rate, drought index, soil depth, soil parent material, vegetation coverage, population growth rate, population densityItalySalvati et al., 2013
    Causes and resultsLand use type, annual average precipitation, temperature, humidity, population density, per capita income, cultivated land areaQinghai-TibetregionZhou et al., 2011
    Ecological pressure, ecological sensitivity, ecological resilienceInverse fractal dimension, disturbance index, terrain index, soil sensitivity index, dominance, fragmentationWugong mountainZhang et al., 2018
    Table 1.

    Literature review of EV measurement and prediction indicators

    Primary indexSecondary indexTertiary index
    Indicators of Natural factorTerrain, climate, soil, vegetation, geology, water resourcesVegetation coverage rate, terrain distribution, precipitation, soil type, soil erosion rate, total water resources
    Indicators of social factorsSocial development indexPopulation density, natural population growth rate, per capita arable land area, urbanization level, poverty rate, unemployment rate, school enrollment rate
    Indicators of economic factorsEconomic development indexPer capita GDP, proportion of primary industry, proportion of secondary industry, per capita net income of farmers, consumer price index, industrial wastewater discharge, energy consumption
    Table 2.

    The EV index system

    Measurement modelModel contentModel evaluationScope of application
    PSR (pressure- state-response) modelPressure indicators based on the effects of human economic and social activities on the environment, the status quo of ecosystem and natural environment represented by the status indicators, and the response indicators are established to prevent the negative impacts of human activities on the environmentThree basic questions “what happened, why did it happen and how to do it” are answered, which fully explain the situation of the evaluation object compared with the reference standardApplicable to regional environment, soil and water resources and agricultural protection
    VSD (exposure-sensitive- adaptation) modelVulnerability is studied from three dimensions: exposure degree, sensitivity and adaptive potential. Each indicator is refined with circle-level data, and evaluated effectively and clearly by “aspect layer—index layer—parameter layer”It fails to clarify which reflects the natural factors, and which reflects the human factorsSuitable for the basic data of comprehensive regional EV measurement
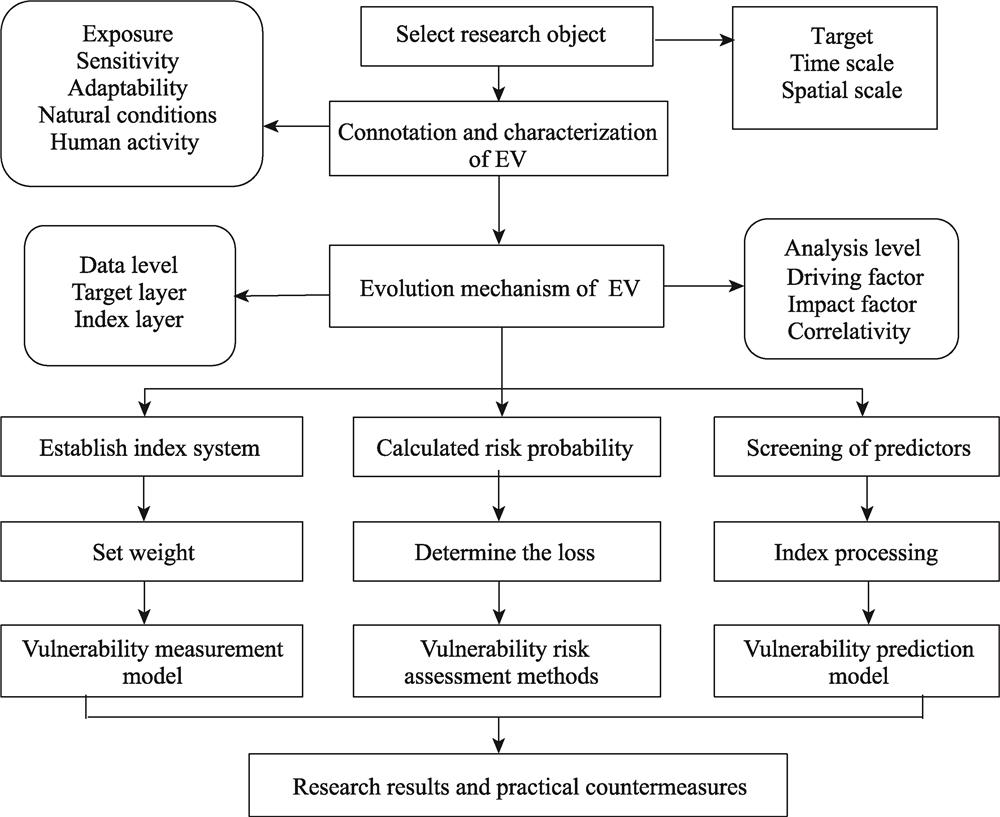
    Pressure sensitivity resilience modelThe intensity of ecological pressure includes area-weighted average fractal dimension reciprocal and disturbance indexes. The ecological sensitivity includes soil erosion sensitivity index, terrain index and landscape fragmentation index. The ecological resilience refers to the self-resilience of an ecosystem and when it is disturbed, it is related to the stability of its internal organizational structureThe emphasis is put on the natural factors, and the proportion of human factors in the index is not highThe vulnerability of ecologically fragile areas are measured and compared
    Fuzzy evaluation methodEstablish the index system and weight, calculate factors for the membership of each evaluation index vector, evaluate regional vulnerability degreeFuzzy trigonometric functions can reduce the shortcomings of subjective effects, which has certain objectivity, but the index of significance is not obvious, and is a heavy workloadSuitable for a specific areas or multiple regions
    Analytic hierarchy process (AHP)Establish the evaluation index, score and weight the index, multiplied by the score value and weight, which are added up to obtain the total score to determine the degree of ecological vulnerabilityIt provides a clearer idea and logic for selection of related indices. The index selection is subjectiveSuitable for the analysis of regional and internal evaluation units
    Principal component methodData standardization, set up the correlation coefficient matrix, calculate eigenvalues and eigenvectors and cumulative contribution rates, and obtain the main ingredients of vulnerability analysisVariable selection of dimensions is not restricted, but it particularly focuses on the main ingredients, which causes some information to be missed, and fails to fully reflect the index of all informationSuitable for regional analysis of the internal evaluation unit
    BP neural network methodSet the objective function of the calculated index, and the weight between the input and output layers of the index can be adjusted and modified with the gradient descent methodIntervention processing, compatibilityDeals with the measurement of regional ecological vulnerability with some complex states
    Cause-result evaluation methodEstablish the corresponding index system according to the characteristics and causes of EV, and the entropy weight method is usually used to assign the weight to each indexRelatively simple, and difficult to deal with complex stateUsed for the comparison of vulnerability degrees between regions for a rough analysis
    Set pair analysisEstablish coefficient of difference degree and correlation degree, weights set, scheme set and evaluation set, the standard deviation classification method is used to measure and classify the EVThe calculation is complicated, and the analysis result has some intuitivenessCan be used to measure and analyze the EV of regional units
    Landscape ecology modelComputer simulation data is used to characterize the dynamic characteristics of EV, which is combined with GIS, remote sensing data and other system analysis dataThis model focuses on local spatial analysis and ignores the influence of human factorsAnalysis of EV from the perspectives of regional space and spatial heterogeneity
    Grey relational degreeThe reference sequence of ecological vulnerability characterization and the comparative sequence of influencing system behavior are determined, the data are processed dimensionless, the grey correlation coefficients of the reference sequence and the comparative sequence are calculated, and the correlation degree is sortedThe degree of correlation between vulnerability factors is emphasizedUsed for comparative analysis between regions
    Matter-element extension modelThe classical domain, node domain and object element to be evaluated are determined, the index weight is set, the correlation degree is calculated, and finally the vulnerability degree of the member to be evaluated is obtainedThis method is suitable for multi-factor analysis, which uses formal language to deal with the characteristics of ecological vulnerabilityUsed for delicate analysis of fragility between regions
    Table 3.

    Brief evaluation of EV measurement models

    Qualitative predictionQuantitative prediction
    MethodEvaluationMethodEvaluation
    Deduction methodBased on the past and current data, the future trends of EV can be deduced. At the macro level, the prediction has good applicability in the case of low precision and missing dataLife zone modelSelect a specific model according to the vulnerability data, input parameters and constraints, and simulate the evolutionary trend of the ecological vulnerability. It has the limitation of a high requirement of data quality, which requires strict discrimination, otherwise significant errors may exist in trend judgment
    Scenario analysis modelIt can be used for scenario prediction of greenhouse gas emission and concentrations, and prediction of the change trend of climate vulnerability. It has the limitation that it can only conduct simulations and predictions based on the natural ecosystem, and rarely involves the social and economic ecosystems
    Logistic regression methodAccording to the law of succession, the trend characteristics of data are used for prediction. It has the shortcoming of excessive dependency on the subjective evaluation of the principles, which does not have a high requirement for the quality and prediction of data
    Neural network modelWith certain accuracy, it can efficiently process noisy and incomplete data and non-linear complex systems. However, this model does not have strong interpretability for simple ecosystems
    Table 4.

    Prediction methods and evaluation of EV

    MethodContent and evaluation
    Risk assessment index methodBased on the subjective evaluation method, the severity and possibility of EV are determined according to the evaluation purpose, and an expert questionnaire is compiled for scoring, so as to determine the possibility and risk level of adverse effects. It has certain subjectivity, which is applicable to fragile ecosystems affected by both human and natural factors. The model has the limitation that the subjective factor is too strong, so it cannot be evaluated in an objective and effective way
    Risk synthesis index methodThe relationship between the landscape structure and the regional EV risk is established, and the vulnerability risk index is determined by the area proportions of landscape components and landscape loss index. It is mainly used to analyze complex ecosystems that are more strongly influenced by natural factors than by human factors. The shortcoming is that it can only analyze simple ecosystems under the influence of natural factors, while it does not work for complicated ecosystems with less interference of human factors
    Risk causal chain modelThree-dimensional models are established by identifying the risk receptors, exposure - response processes and ecological endpoints. Risk = risk probability ×vulnerability ×degree of loss. It includes the explicit characterization of the system exposure response process, the sensitivity of loss as a loss correction factor, and a more comprehensive reflection of the vulnerability pattern of the ecosystem. The main limitation is that it is too objective, and so it lacks a certain subjective judgment
    “Probability-loss” two-dimensional modelDetermines the probability and consequences of ecological vulnerability events. Risk = probability of risk × outcome. The method is simple, but it does not consider whether the ecosystem is affected by the risk source or its sensitivity
    Table 5.

    Risk assessment methods and evaluation of EV

    Yajun WANG, Lifang ZHONG. Research Framework for Ecosystem Vulnerability: Measurement, Prediction, and Risk Assessment[J]. Journal of Resources and Ecology, 2020, 11(5): 499
    Download Citation