
Yuhuan Li, Yong Chen, Huanlin Liu, Tao Jiang. Respiration and Heartbeat Signal Acquisition Method Based on Fiber Optic Sensing[J]. Chinese Journal of Lasers, 2022, 49(4): 0406004
- Chinese Journal of Lasers
- Vol. 49, Issue 4, 0406004 (2022)
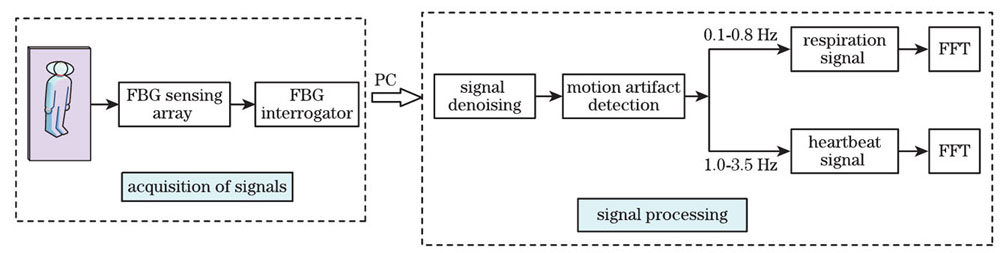
Fig. 1. Block diagram of acquisition method
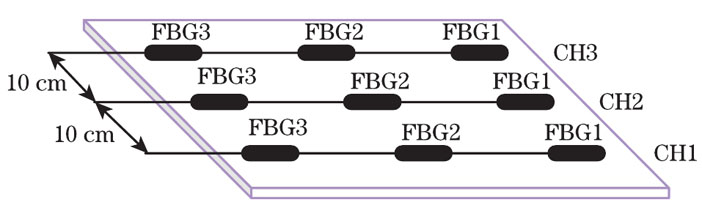
Fig. 2. Simplified structure of testing platform
Fig. 3. Performance of improved threshold function
Fig. 4. Denoising principle of VMD-IWT
Fig. 5. Motion artifact in signal
Fig. 6. Simulated signals. (a) Pure signal; (b) signal after adding 5 dB Gaussian white noise; (c) signal after adding 15 dB Gaussian white noise; (d) signal after adding 25 dB Gaussian white noise
Fig. 7. Comparison chart of each evaluation metric. (a) SNR metric; (b) RMSE metric; (c) PRD metric
Fig. 8. Respiration and heartbeat signal acquisition experiment
Fig. 9. Respiration and heartbeat mixed signal
Fig. 10. Component diagrams of VMD
Fig. 11. Effect plots of each algorithm after denoising. (a) EEMD algorithm; (b) CEEMDAN algorithm; (c) EMD-ICA algorithm; (d) proposed method
Fig. 12. Detailed plots of signals. (a) EEMD algorithm; (b) CEEMDAN algorithm; (c) EMD-ICA algorithm; (d) proposed method
Fig. 13. Signal separation and frequency calculation. (a) Original signal; (b) denoised signal; (c) respiratory signal; (d) respiratory spectrogram; (e) heartbeat signal; (f) heartbeat spectrogram
|
Table 1. Calculation results of correlation coefficients of simulated signal
|
Table 2. Calculation results of SNR
|
Table 3. Calculation results of RMSE
|
Table 4. Calculation results of PRD
|
Table 5. Calculation results of correlation coefficients of acquisition signal
| |||||||||||||||||||||||||||||||||||||||||||||||||||||||
Table 6. Calculation results of respiration and heart rate

Set citation alerts for the article
Please enter your email address
© Copyright 2018-2021 | Chinese Laser Press. All Rights Reserved 沪ICP备15018463号-20